


Abstract
Oncogenic FGFR–TACC fusions are present in 3–5% of high-grade gliomas (HGGs). Fexagratinib (AZD4547) is an oral FGFR1–3 inhibitor with preclinical activity in FGFR–TACC+ gliomas. We tested its safety and efficacy in patients with recurrent FGFR–TACC + HGGs.
TARGET (NCT02824133) is a phase I/II open-label multicenter study that included adult patients with FGFR–TACC + HGGs relapsing after ≥1 line of standard chemoradiation. Patients received fexagratinib 80 mg bd on a continuous schedule until disease progression or unacceptable toxicity. The primary endpoint was the 6-month progression-free survival rate (PFS6).
Twelve patients with recurrent IDH wildtype FGFR–TACC + HGGs (all FGFR3–TACC3+) were included in the efficacy cohort (male/female ratio = 1.4, median age = 61.5 years). Most patients (67%) were included at the first relapse. The PFS6 was 25% (95% confidence interval 5–57%), with a median PFS of 1.4 months. All patients without progression at 6 months (n = 3) were treated at first recurrence (versus 56% of those in progression) and remained progression-free for 14–23 months. The best response was RANO partial response in 1 patient (8%), stable disease in 5 (42%), and progressive disease in 6 (50%). Median survival was 17.5 months from inclusion. Grade 3 toxicities included lymphopenia, hyperglycaemia, stomatitis, nail changes, and alanine aminotransferase increase (n = 1 each). No grade 4–5 toxicities were seen. A 32-gene signature was associated with the benefit of FGFR inhibition in FGFR3–TACC3 + HGGs.
Fexagratinib exhibited acceptable toxicity but limited efficacy in recurrent FGFR3–TACC3 + HGGs. Patients treated at first recurrence appeared more likely to benefit, yet additional evidence is required.
Lay Summary
Some high-grade gliomas have a specific genetic change where 2 genes, FGFR and TACC, join together. This change is thought to make tumors grow. There are drugs that can block FGFR, but it’s not clear if they work for these types of brain tumors. The TARGET clinical trial tested one of these drugs on 12 patients with this specific kind of brain tumor after their tumor grew back following standard treatments like chemotherapy and radiation. Overall, most patients were able to handle the treatment without significant side effects. But after 6 months of treatment, 9 patients’ tumors started growing again, while 3 patients’ tumors did not grow. One patient’s tumor actually got smaller after treatment. The treatment did not help patients with more advanced tumors.
Fexagratinib has limited efficacy in FGFR–TACC + high-grade gliomas, with a 25% PFS6 and an 8% overall response rate.
Durable disease control occurs in patients treated at the first recurrence.
A gene signature could predict the benefit of FGFR inhibition.
High-grade gliomas (HGGs) are aggressive tumors with limited therapeutic options. HGGs of 3–5% bear oncogenic and targetable FGFR–TACC gene fusions. We tested in phase I/II trial the safety and efficacy of fexagratinib (AZD4547), a potent FGFR1–3 inhibitor, in patients with recurrent FGFR–TACC + HGGs. Twelve patients were included in the efficacy cohort of the trial. Fexagratinib demonstrated acceptable safety and limited efficacy, with 3 (25%) progression-free patients at 6 months and durable disease control for 14–23 months. All 3 were treated at first recurrence, suggesting further evaluation of FGFR inhibition in the upfront setting. We identified potential methylation and transcriptomic biomarkers of benefit from FGFR inhibition in FGFR3–TACC3 gliomas.
Diffuse gliomas are the most frequent primary central nervous system (CNS) tumors in adults.1 The current WHO classification defines diffuse gliomas according to their histological and molecular profile.2 The presence of isocitrate dehydrogenase (IDH) 1 or 2 mutations identifies the cases with a better prognosis,3 but the vast majority of high-grade diffuse gliomas (HGGs), including the most aggressive glioblastoma (GBM), lack the IDH mutation. The current standard of care relies on maximal safe resection followed by concurrent and adjuvant chemoradiation,4 but the tumor inevitably recurs. Median overall survival does not exceed 18 months, despite aggressive second-line treatments. New therapeutic options are urgently needed for these tumors.5 Unfortunately, precision medicine aimed at targeting oncogenic factors present in GBMs almost invariably failed, the best illustration of this being the targeting of epidermal growth factor receptor (EGFR) alterations that are present in more than 40% of GBMs.6–8 These negative results have been attributed to intratumor heterogeneity, the instability of this oncogenic pathway,8 and the presence of redundant parallel signaling.9
IDH wildtype (IDHwt) HGGs cover in fact heterogeneous entities. Around 3–5% of them have highly oncogenic gene fusions involving fibroblast growth factor receptor (FGFR) and transforming acidic coiled-coil-containing (TACC) genes (most often FGFR3–TACC3, rarely FGFR1–TACC1 that are found mostly in circumscribed gliomas).10,11 We and others have demonstrated that FGFR–TACC fusion-positive (FGFR–TACC+) HGGs constitute a distinct subgroup of HGGs with well-defined histological,12 molecular,10,13 and clinical10 profiles.14 They exhibit moderately but significantly increased overall survival compared to other IDHwt HGGs.10,13 The presence of an FGFR–TACC gene fusion is mutually exclusive with other activating events in receptor tyrosine kinase genes commonly altered in HGGs, such as the already mentioned EGFR, or PDGFRA, MET, and KIT.10,13
FGFR–TACC fusion proteins have transforming properties that depend on constitutive FGFR tyrosine kinase domain activity.11 In vitro and murine models showed that FGFR–TACC+ tumors are highly sensitive to FGFR inhibition.11,15 FGFR–TACC + gliomas display diffuse FGFR immunostaining of tumor cells,15,16 also retained at relapse.15–17 There is therefore a strong rationale to target FGFR–TACC fusions because they are a strong oncogenic driver, likely clonal, and stable in most cases. Drug targeting of fusion genes has indeed proven to be an extremely effective therapeutic approach in several solid18 and hematologic19 cancers, including some CNS tumors.20,21
Fexagratinib (previously AZD4547, Astra Zeneca) is a potent (IC50 < 50 nm) oral inhibitor of FGFR-1, 2, and 3 receptor tyrosine kinases.22 Experimental data indicates that fexagratinib crosses the blood–brain barrier (refs.,11,23 A. Tovmasyan personal communication and A. Iavarone unpublished data), reaching nanomolar concentrations in intracranial tumors mice models (Supplementary Table). Treatment with fexagratinib prolonged the survival of mice harboring intracranial FGFR3–TACC3–initiated gliomas.11 We tested its efficacy, safety, and tolerability in patients with recurrent/relapsing (r/r) FGFR–TACC + HGGs. We additionally performed a comprehensive genetic, epigenetic, and transcriptomic profiling to identify potential prognostic and predictive markers of response, as recently shown in breast cancer patients treated with fexagratinib.24
Materials and Methods
Study Design
TARGET is a phase I/II, open-label, multicentric study assessing the safety, tolerability, and clinical efficacy of the oral FGFR1–3 inhibitor fexagratinib in patients with r/r HGGs harboring an FGFR–TACC gene fusion.
The sample size was calculated based on a 2-stage optimum Simon’s design,25 where P0 was defined as a 6-month progression-free survival rate (referred to as PFS6) = 15%, P1 as PFS6 = 35%, type I error rate = 5%, and power = 80%. An initial cohort of 12 patients with r/r FGFR–TACC + HGGs was planned to be treated. If fewer than 3 patients were alive without progression at 6 months, the study was planned to be stopped for futility. Otherwise, an additional 26 patients would be enrolled, making a total of 38 patients with r/r FGFR–TACC + HGGs. If the final number of responders was 9 or less, the drug would be considered insufficiently effective.
The study was performed according to the tenets of the Declaration of Helsinki. It was approved by the local ethics committee and authorized by the competent authority. This research has been registered on clinicaltrials.gov (NCT02824133). All patients provided written informed consent.
Patients
The study involved male and female patients aged 18 years or older with an Eastern Cooperative Oncology Group (ECOG) performance status ≤ 2, no clinical deterioration over the previous 2 weeks, and a minimum life expectancy of 12 weeks.
The key inclusion criterion was an HGG (grade 3 or 4 according to the 2016 WHO classification of CNS tumors26) recurring after at least 1 line of standard chemoradiation4 and expressing an FGFR3–TACC3 or FGFR1–TACC1 gene fusion, as confirmed by RT–PCR sequencing. In the case of the first recurrence, it was required to occur more than 3 months from the end of the radiotherapy or outside the irradiated volume to avoid the inclusion of pseudoprogression.
HGG patients were considered for safety and efficacy analyses. Grade 1–2 gliomas with FGFR–TACC gene fusions could also be included in the trial and were considered for the safety analysis but not for efficacy assessment.
Prior treatment with a FGFR inhibitor was an exclusion criterion. Other key exclusion criteria (based on the expected adverse-events, thereafter AEs, of the investigational compound) were a mean QT interval corrected for heart rate ≥ 470 ms, other clinically important abnormalities in cardiac rhythm, relevant retinal pathology, or inadequate bone marrow reserve or organ function (as demonstrated by predefined laboratory values).
FGFR–TACC Gene Fusion Screening and Identification
Patients with IDHwt gliomas were screened for the presence of an FGFR3–TACC3 or FGFR1–TACC1 gene fusion on the initial and/or recurrent tumor sample as previously described.10,12,15 FGFR3 staining was used for prescreening, and positive cases were then submitted to RT–PCR. The presence of a FGFR–TACC fusion was centrally confirmed by RT–PCR in all cases at the Paris Brain Institute, Paris, France.
Treatment
Patients received fexagratinib at a flat dose of 80 mg bis in die on a continuous schedule until disease progression or unacceptable toxicity.
In the case of symptomatic retinal pigment epithelial dystrophy (RPED) confirmed by optical coherence tomography (OCT) scan, the treatment was stopped. If the condition did not improve after 2 weeks, study treatment was discontinued. In the case of resolution, the study treatment was restarted at a lower dose. In case of RPED recurrence, study treatment was discontinued.
In the case of hematologic grade 3–4 AEs, the treatment was stopped and restarted, first at a lower dose and eventually at a full dose. In the case of nonhematologic grades 3–4 AEs, the treatment was stopped until AE resolution. The treatment could be restarted at a lower dose or discontinued as per local clinical practice and the clinical judgment of the investigator.
Any patient experiencing a doubling of phosphate levels from baseline or a corrected calcium:phosphate product > 4.5 mmol/L was put under a low-phosphate diet and phosphate chelation therapy with weekly laboratory assessments until parameters normalized. In case of persistent hyperphosphatemia, the treatment could be stopped until parameters normalization and, if necessary, the doses were reduced.
Potent CYP3A4 or CYP2D6 inducers/enhancers and drugs that may prolong the QT interval were not allowed during fexagratinib treatment.
Patient Assessments
Patients underwent a monthly clinical evaluation. Blood and urine analyses were performed every 2 weeks. Phosphoremia was assessed weekly.
Brain magnetic resonance imaging (MRI) was performed at baseline, then monthly during the first 3 months and every 2 months thereafter. Required sequences included axial T1-weighted pre- and post-Gadolinium injection Spin Echo, axial T2-weighted fast spin echo/ turbo spin echo, axial diffusion with multiple B factors, axial T2-weighted gradient echo, axial fluid-attenuated inversion recovery, and T1-weighted post-Gadolinium 3D turbo spin echo sequences at 1.5 or 3.0 Tesla fields. Efficacy was assessed by each investigator according to Response Assessment in Neuro-Oncology (RANO) criteria.27 A centralized MRI review was performed by 2 board-certified, experienced neuroradiologists (J.S., F.C.).
Due to the expected class effects of FGFR inhibitors, patients underwent an ophthalmologic assessment (including an OCT scan) at baseline, monthly for the first 3 months, and every 2 months thereafter until treatment discontinuation. ECG was performed at baseline, then every 2 months. An echocardiogram (or multigated acquisition scan) to assess left ventricular ejection fraction was conducted at baseline, at 1 month, and at treatment discontinuation.
Endpoints
The primary endpoint of the study was PFS6 in patients with r/r FGFR–TACC + HGG.
Secondary endpoints were:
- Safety and tolerability of fexagratinib in glioma patients (expressed as type, frequency, and severity of AEs according to the revised NCI Common Terminology Criteria v4.0 for Adverse Events, or CTCAEv4.0).
- Overall response rate (ORR, defined as the proportion of patients who had a partial or complete response to therapy) and disease control rate (DCR, post hoc defined as the proportion of patients who had a complete response, partial response, or stable disease under therapy) in r/r HGG patients with measurable disease, as defined by RANO criteria.
- Median progression-free survival (PFS) in r/r HGG patients.
- Median overall survival (OS) in r/r HGG patients.
Ancillary Analyses
Genomic profiling.
—Tumor DNA underwent molecular characterization using a previously reported custom next-generation sequencing (NGS) panel (BrainCap).10
Methylation profiling.
—One microgram of extracted DNA was bisulphite-converted using the EZ-96 DNA Methylation Kit (Zymo Research) according to the manufacturer’s instructions. Three hundred nanograms of bisulfite-converted DNA were then used for methylation profiling using the Infinium MethylationEPIC BeadChip array v1.0 (Illumina) following the manufacturer’s instructions. iDAT files were submitted to the molecularneuropathology.org website (DKFZ) for categorization according to the random forest-based classifier of CNS tumors,28 versions 11b4 and 12.5.
Transcriptome profiling.
—RNA library with ribosomal RNA (rRNA) depletion was performed using the Illumina Stranded Total RNA Prep with Ribo-Zero Plus kit following the manufacturer’s recommendations. The final library was sequenced on a NovaSeq 6000 system (Illumina).
Quality control was performed using fastQC.29 Adapter trimming was done using fastp30 using default parameters excepted for —length_required 50, —cut_mean_quality 25, —n_base_limit 10. Reads were mapped on human genome reference GRCh38 using STAR (v.2.7.2).31 Raw gene counts were obtained with the —quantMode GeneCounts option of STAR using NCBI RefSeq gtf file for transcript annotation.
Differential gene expression analysis between the patients meeting the primary endpoint (progression-free at 6 months, “responders”) and those who did not (“non-responders”) was performed using edgeR.32 After filtering out lowly expressed genes and normalizing counts with a Trimmed Mean of M-values (TMM) approach, differentially expressed genes (DEG) were defined as those with a |logFC| > 1.5 and an adjusted P value < .05. Over-representation analysis (ORA) on Gene Ontology Biological Process terms was performed using clusterProfiler.33 Gene Set Enrichment Analysis34 of 2 gene sets previously reported as significantly differentially expressed (significantly overexpressed, n = 17; significantly underexpressed, n = 15) in breast cancers responding to fexagratinib24 was performed after reduction of the whole gene set to the 2549 gene universe analyzed in ref.24
Samples were classified according to the Verhaak35 and Iavarone36 transcriptomic classifiers. For both methods, we used normalized counts data generated with the procedure described in ref.36 using the EDAseq package.37 In both cases, default parameters were used. For Verhaak classification, we used the ssgsea.GBM.classification R package from ref.35 For Iavarone classification, normalized counts were submitted to the shiny app: https://lucgar88.shinyapps.io/GBMclassifier/.
Tumor purity was estimated using the PUREE,38 ESTIMATE,39 and BayesPrism40 (using Yuan et al.41 as a single-cell GBM reference data for the latter) algorithms.
Statistical Analyses
Quantitative variables were described with median and range, and qualitative variables with frequencies and percentages. PFS was defined as the time from inclusion to tumor progression according to RANO criteria or death due to any cause. OS was defined as the time from inclusion to death. Survival curves were calculated using the Kaplan‒Meier method. Given the small number of cases, no formal statistical comparisons were performed between the groups of responders and nonresponders. Analyses and graphs were performed using R software (R Foundation for Statistical Computing).
Results
Clinical and Demographic Features
From September 2015 to July 2016, 14 patients gave their consent to participate in the study (Supplementary Figure 1). One patient was eventually excluded (no confirmation of FGFR–TACC fusion). Thirteen patients received at least 1 dose of the investigational drug. All had IDH wildtype, FGFR3–TACC3 fusion-positive gliomas. One patient had a histology of grade 3 pleomorphic xanthoastrocytoma (PXA) and was consequently excluded from the efficacy analysis. Twelve patients (ten grade 4 GBMs and two grade 3 astrocytomas) were eligible for the efficacy analysis. Their characteristics are reported in Table 1. The male/female ratio was 1.4, with a median age at inclusion of 61.5 years. The FGFR3–TACC3 fusion was detected on an initial (n = 9) or recurrent (n = 3) tumor. Two-thirds of the patients (8/12) were included in the first tumor relapse.
Baseline Clinical and Demographic Characteristics of Patients in the Efficacy Cohort.
| Individuals, n | 12 |
|---|---|
| Sex, n (%) | |
| Male | 7 (58%) |
| Female | 5 (42%) |
| Age at inclusion (y), median (range) | 61.5 (36–87) |
| 2016 WHO classification, n (%) | |
| Grade III astrocytoma, IDH wildtype | 2 (17%) |
| Grade IV glioblastoma, IDH wildtype | 10 (83%) |
| Number of prior tumor relapses, n (%) | |
| 1 | 8 (67%) |
| >1 | 4 (33%) |
| Previous treatments, n (%) | |
| Radiotherapy | 12 (100%) |
| Temozolomide | 12 (100%) |
| Bevacizumab | 3 (25%) |
| Lomustine | 3 (25%) |
| Othersa | 3 (25%) |
| ECOG performance status, n (%) | |
| 0–1 | 8 (67%) |
| 2 | 4 (33%) |
| Glucocorticoids use, n (%) | |
| Yes | 9 (75%) |
| No | 3 (25%) |
| Tumor dimensionsb (mm), median (range) | 912 (391–4884)c |
| Gene fusion, n (%) | |
| FGFR3–TACC3 | 12 (100%) |
| FGFR1–TACC1 | 0 (0%) |
aIncludes fotemustine, resurgery with carmustine implant, and stereotactic radiotherapy (n = 1 each). bExpressed as the sum of products of the greatest perpendicular diameters of contrast-enhancing lesion. cOne patient with nonmeasurable disease.
Noteworthy, all cases underwent a posteriori histological revision.10 The two grade 3 astrocytomas and the PXA were reclassified as GBM IDHwt according to WHO 2021 classification,2 based on molecular (chromosome 7 gain and chromosome 10 loss, pTERT mutation) and methylation data (Supplementary Material).
Drug Exposure
The median treatment duration in the safety cohort (n = 13) was 2.8 months (range, 1.1–16.9 months). Five patients (38%) continued the treatment for over 3 months, with 31% (4 patients) continuing for more than 6 months. Treatment discontinuation primarily resulted from tumor progression in 54% (7 patients), treatment toxicity in 23% (3 patients), and patient preference in 23% (3 patients).
Efficacy Analysis
Three patients in the efficacy cohort (n = 12) were considered free from tumor progression at 6 months (Figure 1). The PFS6 was 25% (95% CI 5–57%), meeting the predefined threshold for phase II cohort expansion. Nonetheless, the study was not pursued further due to the decision of the supporting company that furnished the investigational compound.
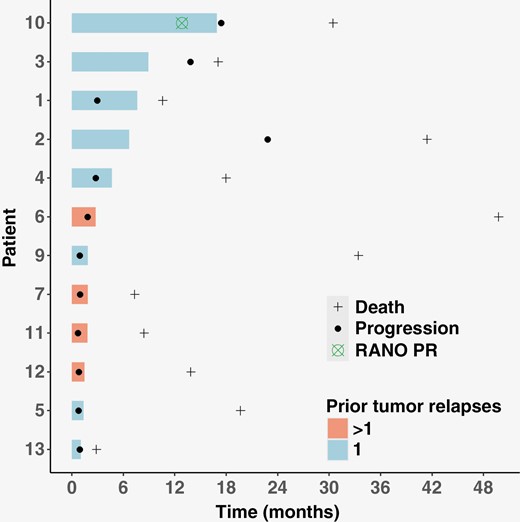
Swimmer plot of the patients in the efficacy cohort. Each bar represents the time under treatment.
All the patients had tumor progression at the time of this analysis. Median PFS was 1.48 months (95% CI 9–67, Figure 2a). The PFS rates at 12 and 18 months were 25% (95% CI 9–67%) and 8% (95% CI 1–54%), respectively.
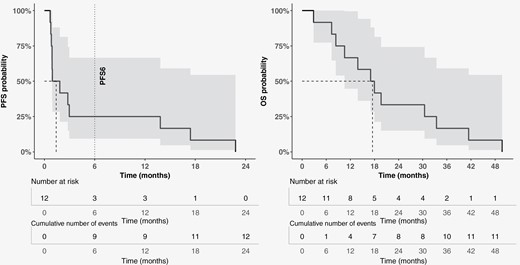
Progression-free survival (panel a) and overall survival (panel b) probabilities in the efficacy cohort, were calculated with the Kaplan–Meier method.
The best responses according to RANO criteria were partial response (PR) in 1 patient (8%), stable disease in 5 (42%), and progressing disease in 6 (50%), leading to an estimated 8% ORR (95% CI 0–39%) and 50% DCR (95% CI 21–79%) (Figure 3). The RANO PR was observed in a patient after 13 months under fexagratinib.
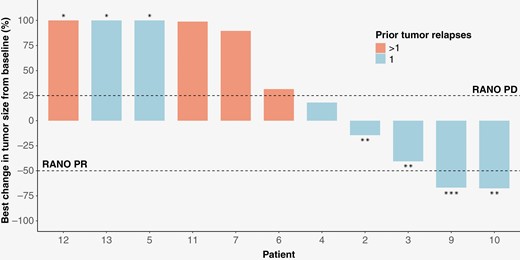
Waterfall plot of the best radiological response for each patient. *Greater than 100%. **These patients are free from progression at 6 months. ***Did not meet the criteria for RANO PR (increasing glucocorticoids).
All patients were deceased at the time of this analysis. The median OS was 17.5 months (Figure 2b). The OS rates at 6, 12, and 24 months were 92% (95% CI 77–100%), 67% (95% CI 45–100%), and 33 (95% CI 15–74%), respectively.
Safety and Tolerability Analysis
AEs were collected for all patients who received at least 1 treatment cycle (n = 13). Overall, grade 1, grade 2, and grade 3 treatment-related AEs occurred in 100% (13/13), 69% (9/13), and 23% (3/13) of patients (Table 2). The most frequent treatment-related AEs included hyperphosphatemia (69%), nail changes/onycholysis (69%), stomatitis (54%), dry skin (46%), and retinal pigment epithelial detachment (46%). Grade 3 treatment-related AEs included lymphopenia, hyperglycaemia, stomatitis, nail changes/onycholysis, and alanine aminotransferase increase (n = 1 each). No grade 4–5 treatment-related AEs were seen. Five patients (38%) interrupted the treatment due to an AE, including 3 definitive discontinuations (23%).
Treatment-Related Adverse Events are Ordered by All-Grade Incidence. Each Patient is Represented by the Maximum Grade of Toxicity Experienced for Each Subcategory. No Grade 4–5 Toxicities Were Seen.
| Adverse Event | Grades 1–2 | Grade 3 | Total (%) |
|---|---|---|---|
| Metabolism disorder | 11 (85%) | 1 (8.3%) | 12 (92%) |
| Hyperphosphatemia | 9 (69%) | 0 (0%) | 9 (69%) |
| Other metabolism disorder | 5 (38%) | 1 (8%) a | 6 (46%) |
| Other disorders | 10 (77%) | 2 (15%) | 12 (92%) |
| Nail changes/onycholysis | 8 (62%) | 1 (8%) | 9 (69%) |
| Stomatitis | 6 (46%) | 1 (8%) | 7 (54%) |
| Dry skin | 6 (46%) | 0 (0%) | 6 (46%) |
| Fatigue | 4 (31%) | 0 (0%) | 4 (31%) |
| Alopecia | 3 (23%) | 0 (0%) | 3 (23%) |
| Infection | 1 (8%) | 0 (0%) | 1 (8%) |
| Other disorder | 7 (53%) | 1 (8%) b | 8 (62%) |
| Eye disorder | 10 (77%) | 0 (0%) | 10 (77%) |
| Retinal detachment | 6 (46%) | 0 (0%) | 6 (46%) |
| Blurred vision | 1 (8%) | 0 (0%) | 1 (%) |
| Other eye disorders | 6 (46%) | 0 (0%) | 6 (46%) |
| Hematologic disorder | 5 (38%) | 1 (8%) | 6 (46%) |
| Thrombopenia | 2 (15%) | 0 (0%) | 2 (15%) |
| Leukopenia | 2 (15%) | 0 (0%) | 2 (15%) |
| Neutropenia | 1 (8%) | 0 (0%) | 1 (8%) |
| Anemia | 1 (8%) | 0 (0%) | 1 (8%) |
| Other hematologic disorder | 3 (23%) | 1 (8%) c | 4 (31%) |
| Renal disorder | 2 (15%) | 0 (0%) | 2 (15%) |
| Proteinuria | 1 (8%) | 0 (0%) | 1 (8%) |
| Other renal disorder | 1 (8%) | 0 (0%) | 1 (8%) |
| Cardiac disorder | 1 (8%) | 0 (0%) | 1 (8%) |
| Other cardiac disorder | 1 (8%) | 0 (0%) | 1 (8%) |
| Total | 13 (100%) | 3 (23%) | 13 (100%) |
aHyperglycemia; bAlanine aminotransferase increase; cLymphopenia.
Exploratory Responders Analysis
We compared the main clinical and prognostic molecular10 characteristics between patients who met the primary endpoint (free from progression at 6 months, thereafter “responders”) and those who did not (“non-responders”)(Table 3). Notably, all responders (100%) were included in the first tumor recurrence, compared to 56% of the nonresponders. However, the limited sample size prevented us from making any definitive statistical conclusions.
Main Clinical, Molecular, Transcriptomic, and Methylation Features in Responder Versus Nonresponder Patients.
| Variable | Responders (n = 3) | Non-responders (n = 9) |
|---|---|---|
| Clinical | ||
| Age at inclusion (years), median (range) | 67 (46–71) | 61 (36–87) |
| Number of prior relapses | ||
| 1 | 3 (100 %) | 5 (56%) |
| >1 | 0 | 4 (44%) |
| ECOG performance status | ||
| 0–1 | 2 (67%) | 6 (67%) |
| 2 | 1 (33%) | 3 (33%) |
| Glucocorticoids use | ||
| Yes | 3 (100%) | 6 (67%) |
| No | 0 (0%) | 3 (33%) |
| Histological | ||
| 2016 WHO classification, n (%) | ||
| Grade III astrocytoma, IDH wildtype | 1 (33%) | 1 (11%) |
| Grade IV glioblastoma, IDH wildtype | 2 (67%) | 8 (89%) |
| Molecular | ||
| MGMT | ||
| Methylated | 1 (33%) | 1 (13%) |
| Unmethylated | 2 (67 %) | 7 (87%) |
| NA | 0 | 1 |
| MDM2 | ||
| Amplified | 0 (0%) | 1 (20%) |
| Normal | 2 (100%) | 5 (80%) |
| NA | 1 | 3 |
| CDK4 | ||
| Amplified | 0 (0%) | 0 (0%) |
| Normal | 2 (100%) | 6 (100%) |
| NA | 1 | 3 |
| Transcriptomic | ||
| Verhaak classification | ||
| Classical | 1 (33%) | 3 (60%) |
| Mesenchymal | 0 | 2 (40%) |
| Proneural | 2 (67%) | 0 |
| NA | 0 | 4 |
| Iavarone classification | ||
| Mitochondrial | 1 (33%) | 3 (60%) |
| Glycolytic/plurimetabolic | 0 | 1 (20%) |
| Proliferative/progenitor | 0 | 1 (20%) |
| Neuronal | 2 (67%) | 0 |
| NA | 0 | 4 |
| Methylation | ||
| DKFZ methylation class, v11b4 | ||
| Glioblastoma, IDH wildtype | 3 (100%) | 5 (83%) |
| No match | 0 | 1 (17%) |
| NA | 0 | 3 |
| DKFZ methylation family, v11b4 | ||
| Glioblastoma, mesenchymal | 3 (100%) | 2 (33%) |
| Glioblastoma, RTK II | 0 | 3 (50%) |
| No match | 0 | 1 (17%) |
| NA | 0 | 3 |
NA = not available.
Ancillary Translational Analysis
Transcriptomic profiling.
—To identify potential predictive biomarkers of response to FGFR inhibition, we performed a transcriptomic analysis on 9 cases (including the grade 3 PXA excluded from the efficacy cohort). According to the Verhaak classification,35 most cases were classical (44%) or mesenchymal (33%). As expected, in the Iavarone classification,36 they were enriched in mitochondrial cases (44%) (Supplementary material). Strikingly, 2 out of 3 responders were proneural (according to Verhaak classification)/ neuronal (Iavarone classification), versus 0/5 nonresponders (Table 3). They were clearly demarcated from other samples after multidimensional scaling (Supplementary Figure 2). We identified the most up and downregulated genes in responders versus nonresponders (Supplementary Figure 3). Over-representation analysis disclosed that the vast majority of upregulated genes were linked to neuronal functions, such as synaptic transmission (Supplementary Figure 4). This finding may be biased by the contamination with normal brain tissue, but the results from dedicated tools38–40 were inconsistent (Supplementary Material).
We then investigated a 32-gene signature previously associated with response to fexagratinib (17 upregulated and 15 downregulated) in breast cancer patients24 (Supplementary Figure 5a). Gene set Enrichment analysis showed that responder cases had a significant enrichment (NES = 1.51, P value = .039) of the 17-gene set previously reported as overexpressed in breast cancers responding to fexagratinib24 (Supplementary Figure 5b, cyan). Consistently, genes significantly downregulated in breast cancers responding to fexagratinib24 tended to be ranked at the bottom of the list, although in a nonsignificant manner (NES = –1.04, P value = .44, Supplementary Figure 5b, red).
Methylation profiling.
—We conducted methylation profiling on 10 cases (8 GBMs, 1 grade 3 glioma, and 1 grade 3 PXA) with available material. All samples were of good quality (P value of signal detection < .01 in >99.9% of CpGs). The predicted methylation class according to the DKFZ classifier,28 version 11 was GBM in all cases, although with a noncontributory score (<0.9) for 3 of them. The methylation subclass was mesenchymal GBM in 6 (all with a score > 0.5), RTKII GBM in 3 (all with a score > 0.5), and no match in 1. Similar results were observed using the DKFZ classifier v12.5 (Supplementary Material). All responders (3/3) were mesenchymal, compared to 2 out of 6 nonresponders.
Discussion
We report here the results of a phase I/II multicentric trial evaluating the efficacy and safety of fexagratinib (previously known as ADZ4547) in patients affected by recurrent IDHwt grade 3 or 4 diffuse gliomas with FGFR–TACC (essentially FGFR3–TACC3) gene fusions. In contrast to other studies published since this trial was designed, we focused here on IDHwt HGGs with FGFR–TACC fusions, excluding cases bearing FGFR activating mutations, which correspond to a different disease affecting selectively midline structures.42 We also excluded isolated FGFR amplification, whose significance is less clear, as oncogene addiction has not been demonstrated. In addition, the 2 grade 3 astrocytomas included in this trial would be classified as grade 4 GBMs according to the current WHO classification,2 therefore representing a very consistent cohort.
Within this population, molecularly homogeneous but heterogenous in terms of previous treatments, the investigational compound demonstrated limited efficacy, with 3—all at first recurrence—out of twelve treated patients (25%) experiencing disease control lasting over 6 months. Despite this outcome meeting the prespecified endpoint for moving forward to the second phase, the company decided to not go any further, considering the limited oncological impact, essentially achieved through temporary stabilizations at the price of significant side effects.
Modest efficacy was observed also in recently published studies involving other anti-FGFR compounds: infigratinib,43 erdafitinib,44 and futibatinib.45 In particular, in a recent subgroup analysis from the RAGNAR trial on a similarly homogeneous cohort of 30 FGFR-altered HGGs (all but 1 with FGFR fusions, 24/30 with FGFR3–TACC3 fusions), erdafitinib showed similar efficacy with a 10% ORR and 57% DCR (versus 8% and 50%, respectively, in our study).44 These modest results could be attributed to the limited brain penetration of these drugs, as shown with infigratinib in a recent phase 0 trial46: fexagratinib has a brain/plasma ratio of <1/10 in mouse brains, with a plasma-to-tumor ratio ranging from 1/10 to 1/4 (Supplementary Table). These pharmacokinetic issues could at least partially explain the decreased efficacy of anti-FGFR agents in FGFR–TACC + gliomas compared to other FGFR–TACC + cancers.45,47 On the other hand, increasing the dosage would expose patients to unacceptable toxicity. At standard doses, we observed substantial side effects (painful onycholysis, RPED, fatigue, and hyperphosphatemia) that led to frequent drug discontinuation (unacceptable toxicity or patient decision in 46%).
The 3 patients free from progression at 6 months were all treated at first recurrence, while none of the 4 patients treated in more advanced stages of the disease responded. Although FGFR3–TACC3 is a relatively stable alteration,15–17 it is likely that the evolutionary pressure of previous treatments favored the emergence of redundant pathways and resistant clones. In the context of an incurable disease, and particularly in the most refractory cases to available therapies (such as those lacking methylation of the MGMT promoter), FGFR inhibitors could be evaluated upfront, in addition to standard treatment in order to target the driver as early as possible. One patient attained a RANO partial response, noteworthy for occurring after over a year of treatment. This delayed response indicates that patients who remain clinically stable with acceptable drug tolerance may benefit from continuous treatment, even when initial tumor reduction is not evident, as it may manifest later while on therapy. Median OS was 17.5 months from inclusion time, which is remarkably higher than expected for a population of recurrent HGGs. This is in line with longer survival already reported for patients with FGFR3–TACC3 + glioblastomas.10,13
To identify potential predictors of response to fexagratinib, we conducted a comprehensive translational genomic, methylation, and transcriptomic profiling of treated patients. The targeted NGS found no EGFR amplification, as expected.10 Amplification events on chromosome 12 involving CDK4 and/or MDM2 oncogenes, previously reported as associated with the FGFR3–TACC3 fusion and marker of improved survival,10 were seen in only 1 case, impeding us to evaluate their impact on the response to FGFR inhibition.
The DKFZ classifier,28 both v11 and v12.5, confidently mapped 9 of the 10 cases with methylation data in the GBM cluster, either RTKII (3 cases) or mesenchymal (6 cases), consistently with the reported methylation profile of FGFR3–TACC3 + GBMs.13,48 Of note, all responders were classified as mesenchymal, whereas most nonresponders were RTKII. The RTKII methylation profile has been associated with the EGFR amplification49 and we can hypothesize that in the context of FGFR3–TACC3 + GBMs, it could represent tumors with redundant receptor tyrosine kinase signaling. Conversely, in this context, the mesenchymal methylation profile may correspond to “purer” FGFR3–TACC3 + GBMs, more prone to respond to FGFR inhibition. In line with this hypothesis, all the cases in the recently suggested subgroup of “outlier” FGFR3–TACC3 + GBMs with prolonged survival were classified as mesenchymal by the DKFZ classifier v11 (ref.50). We acknowledge that the limited sample size restricts our ability to draw definitive conclusions. Additional evidence is required to establish whether the mesenchymal methylation profile could be used to identify FGFR3–TACC3 + GBMs more likely to benefit from FGFR inhibitor treatments.
RNA sequencing analysis detected significant differences in the transcriptome of responding versus nonresponding cases. Responders showed a widespread upregulation of genes involved in neuronal functions, such as synapse formation and neurotransmitter release, with an over-representation of proneural (Verhaak classification) and neuronal (Iavarone classification) profiles. It is unclear whether this could be due to intrinsic transcriptional programs or to a lower tumor content of the analyzed specimen. Tumor purity-inferring algorithms38–40 were inconclusive (Supplementary Material), and the expression profile was maintained after in silico deconvolution and removal of the nontumor content with BayesPrism40 (data not shown). Recently, a gene signature (including genes involved in FGF signaling such as FGF10, FGF22, PTPRC, and MAG) has been associated with response to fexagratinib in estrogen receptor-positive metastatic breast cancer patients who had become resistant to aromatase inhibitors.24 Consistently, GSEA demonstrated a significant enrichment in our responding cases of the genes previously reported as overexpressed, despite the small sample size and the potential purity bias discussed above. Again, genes reported as downregulated in breast cancers responding to fexagratinib tended to be ranked at the bottom of the DEG list in responders. Whether this 32-gene signature could help in identifying gliomas most likely to benefit from FGFR inhibition should be further validated in a larger cohort.
We recently showed that the FGFR3–TACC3 fusion protein activates oxidative phosphorylation (OXPHOS) and mitochondrial biogenesis to fuel cancer growth.36,51 A planned phase II clinical trial (OPTIMUM, NCT04945148) will evaluate the addition of metformin, a widely available oral inhibitor of mitochondrial metabolism, to standard chemoradiation in OXPHOS GBM patients, including FGFR3–TACC3 + GBMs. Associating an OXPHOS inhibitor with FGFR inhibition could be another strategy to exploit this vulnerability.
In conclusion, fexagratinib showed an acceptable safety profile but limited efficacy in recurrent HGGs with FGFR3–TACC3 fusions. Some durable disease controls were seen in patients treated at first tumor recurrence. These results plead in favor of an early use (ideally upfront) of FGFR inhibitors in F3T3 gliomas. We identified putative methylation and transcriptomic biomarkers of benefit from FGFR inhibition in FGFR3–TACC3 gliomas. Future studies are warranted to validate these findings.
Funding
This work was supported by Assistance Publique—Hôpitaux de Paris (Clinical Research and Development Department). This study was conducted with support from AstraZeneca.
Acknowledgments
We are grateful to Badreddine Mohand Oumussa (P3S platform, Sorbonne Université, Paris, France), the technical staff of the OncoNeuroTek biobank, and the iGENSeq platform (Paris Brain Institute, Paris, France) for their support in performing translational analyses.
We thank Jean-Yves Delattre, Veronique Bourg, Emeline Tabouret, and Frederic Dhermain for referring patients, Imène Benyahia, Émilien Bréat, Laura Doctrove, Philippe Gallula, Assitan Kone-Haidara, Merry Mazmanian, from the DRCI and Clinical Research Unit of PSL-CFX (AP-HP) for their help in coordinating and monitoring this study. We thank Marie-Laure Tanguy, Claudine Pardon, Elise Delzant and Caroline Giboin from the Clinical Research Unit of PSL-CFX (AP-HP) for their respective help in statistical design, data management, and statistical analysis. We extend our sincere appreciation to Artak Tovmasyan for his insightful discussion about fexagratinib pharmacokinetics.
TARGET results have been previously presented at the 2023 Society for Neuro-Oncology (SNO) Annual Meeting.52
Conflict of interest statement
A.P. and M.S. declare having received travel support from Astra Zeneca. The other authors have declared no conflict of interest relevant to this paper.
Authorship statement
A.P.: data curation, analysis, and visualization, bioinformatic analyses, writing—original draft and editing. A.L.D.S.: study conceptualization, methodology, patient inclusion, writing—review and editing. J.S.: radiological data curation and analysis, writing—review and editing. F.D.: patient inclusion, writing—review and editing. O.C.: patient inclusion, writing—review and editing. E.C.-J.M.: patient inclusion, writing—review and editing. P.A.: patient inclusion, writing—review and editing. E.L.R.: patient inclusion, writing—review and editing. Y.S.: translational analyses, writing—review and editing. N.R.: data curation, writing—review and editing. A.M.M.Y.: data curation and visualization, statistical analyses, writing—review and editing. C.E.: methodology, statistical analyses, writing—review and editing. F.C.: radiological data curation and analysis, writing—review and editing. Q.L.: bioinformatic analyses, writing—review and editing. D.F.B.: neuropathological analyses, writing—review and editing. D.M.: neuropathological analyses, writing—review and editing. C.F.: ophthalmological assessments, writing—review and editing. K.M.: neuropathological analyses, writing—review and editing. F.B.: neuropathological analyses, writing—review and editing. A.I., K.M.: study conceptualization, writing—review and editing. M.S.: study conceptualization, methodology, patient inclusion, data analysis, writing—original draft and editing.
Data Availability
All the data are available upon reasonable request to the corresponding author and in compliance with the applicable regulations.
