


ABSTRACT
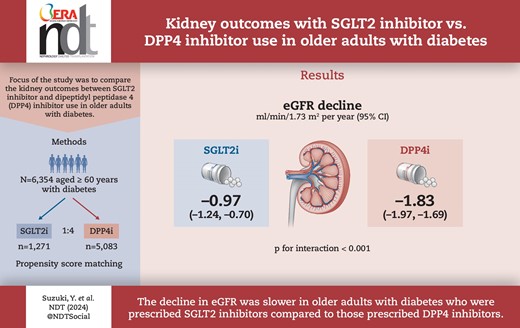
While the kidney-protective effects of sodium–glucose co-transporter 2 (SGLT2) inhibitors have attracted much attention, there are limited real-world clinical data examining the effects of SGLT2 inhibitors on kidney function in older individuals. We aimed to compare the kidney outcomes between SGLT2 inhibitor and dipeptidyl peptidase 4 (DPP4) inhibitor use in older adults with diabetes.
Using a nationwide claims database, we studied 6354 older adults (≥60 years of age) who had diabetes and were newly initiated on SGLT2 inhibitors or DPP4 inhibitors. A 1:4 propensity score matching algorithm was used to compare changes in estimated glomerular filtration rate (eGFR) between SGLT2 inhibitor and DPP4 inhibitor users. The primary outcome was a decrease in the rate of eGFR, which was obtained using a linear mixed-effects model with an unstructured covariance.
Following propensity score matching, 6354 individuals including 1271 SGLT2 inhibitor users and 5083 DPP4 inhibitor users {median age 68 years [interquartile range (IQR) 65–70], male 60.4%, median eGFR 69.0 ml/min/1.73 m2 [IQR 59.1–79.0], median haemoglobin A1c [HbA1c] 6.9% [IQR 6.5–7.4]} were analysed. SGLT2 inhibitor users had a slower eGFR decline than did DPP4 inhibitor users [−0.97 ml/min/1.73 m2/year (95% CI −1.24 to −0.70) versus −1.83 ml/min/1.73 m2/year (95% CI −1.97 to −1.69); P for interaction <.001]. This finding remained consistent across subgroups based on age, sex, body mass index, HbA1c level, renin–angiotensin system inhibitor use and baseline eGFR. Additionally, the risk of a ≥20%, ≥30% and ≥40% decrease in eGFR from baseline was significantly lower in SGLT2 inhibitor users than in DPP4 inhibitor users.
Our analysis, utilizing a nationwide epidemiological dataset, demonstrated that the decrease in eGFR was slower in individuals ≥60 years of age with diabetes who were prescribed SGLT2 inhibitors compared with those prescribed DPP4 inhibitors, suggesting a potential advantage of SGLT2 inhibitors for kidney outcomes even in older individuals with diabetes.
What was known:
Several clinical trials have reported that sodium–glucose co-transporter 2 (SGLT2) inhibitors exert kidney- and cardiovascular-protective effects.
Older individuals are often not included in clinical trials and there is a paucity of real-world clinical data examining the kidney-protective effects of SGLT2 inhibitors in older adults with diabetes.
This study adds:
Using a nationwide health check-up and insurance claims database, including 6354 older individuals (≥60 years of age) with diabetes who were newly prescribed SGLT2 inhibitors or dipeptidyl peptidase 4 (DPP4) inhibitors, we found that SGLT2 inhibitor users exhibited a slower disease progression rate than did DPP4 inhibitor users.
There was no clear difference in the risks of adverse events between SGLT2 inhibitor and DPP4 inhibitor users.
Potential impact:
Our findings suggest a potential advantage of SGLT2 inhibitors for kidney outcomes, specifically in older individuals with diabetes.
INTRODUCTION
Sodium–glucose co-transporter 2 (SGLT2) inhibitors were initially approved as effective glucose-lowering drugs for the treatment of diabetes. Subsequent investigations demonstrated that SGLT2 inhibitors exerted kidney- and cardiovascular-protective effects far beyond their glucose-lowering effects [1–8]. Owing to these unique characteristics, SGLT2 inhibitors are increasingly advocated as the preferred treatment option for individuals with diabetes, particularly those with a high risk of (or with established) chronic kidney disease (CKD), cardiovascular disease or both. However, despite their expanding indications, SGLT2 inhibitor prescription is not uniform across age groups [9–11]. Notably, clinical trials of SGLT2 inhibitor targeting older adults are limited, resulting in a lack of real-world clinical data regarding their efficacy and safety in this population. Preceding studies focusing on the effects of SGLT2 inhibitors in older individuals were predominantly based on secondary analyses of randomized controlled trials (RCTs) or meta-analyses, with limited investigations reflecting actual clinical practice [12–17]. Additionally, various epidemiological studies using real-world databases that have also shown associations between SGLT2 inhibitor use and kidney outcomes primarily included middle-aged populations [7, 8, 18, 19]. Whether the findings of RCTs are applicable to a broader range of individuals with diabetes in clinical settings remains uncertain. Therefore, it is crucial to accumulate clinical evidence regarding the use of SGLT2 inhibitors in older individuals with diabetes using actual clinical data. The aim of this study was to compare kidney outcomes in older individuals with diabetes who were prescribed SGLT2 inhibitors or dipeptidyl peptidase 4 (DPP4) inhibitors in a real-world clinical setting.
MATERIALS AND METHODS
Study population
We conducted a nationwide retrospective cohort study that used data from the DeSC database (DeSC Healthcare, Tokyo, Japan), a large health check-up and administrative claims dataset, between April 2014 and August 2021 [20–22]. The DeSC database contains information on Japanese administrative data from three health insurers: association-/union-administered health insurance for salaried employees working for relatively large companies in Japan, National Health Insurance for unemployed individuals <75 years of age and the Advanced Elderly Medical Service System for older individuals ≥75 years of age. The DeSC database, which encompasses information on individuals across various age groups, including the young, middle-aged and older adults, is acknowledged for its extensive coverage and reliability within the Japanese population. Individual-level inpatient and outpatient administrative data were anonymized and stored in a database. This made it possible to monitor individual participants longitudinally, even when they visited multiple medical facilities throughout the study period. All medical diagnoses were recorded according to International Classification of Diseases, 10th Revision (ICD-10) coding. The DeSC database also contains annual health check-up data such as laboratory data (including serum creatinine), anthropometric measurements and lifestyle questionnaires. In Japan, a regular health check-up system, targeting almost all citizens (typically once a year), is established.
We used a new-user, active comparator design to minimize confounding by indication and unmeasured confounders (Supplementary Fig. S1) [23]. Given the high prescription rate of DPP4 inhibitor for diabetes in Japan, we set individuals having diabetes who were newly prescribed DPP4 inhibitor as the control group in this study [10]. Briefly, when compared with individuals not using antidiabetic medication or using other antidiabetic medication, SGLT2 inhibitor users can be more similar to DPP4 inhibitor users in measured confounders such as age and sex, and, more importantly, in unmeasured confounders such as severity of diabetes and comorbidity status [24]. In other words, using a new-user design and providing an active comparator with similar indications can attenuate differences in baseline characteristics and reduce confounding by indication and unmeasured confounding. We used the data from 11 253 older individuals ≥60 years of age with available data on estimated glomerular filtration rate (eGFR) and diabetes diagnosis (ICD-10 codes E10–E14) who newly initiated SGLT2 inhibitor or DPP4 inhibitor use. Because the main outcome of this study was the change in eGFR over time, individuals in which eGFR could be assessed at least once at a health check-up after the index date were included. A new user was defined as anyone who started SGLT2 inhibitor or DPP4 inhibitor use with no administrative data claims during the previous year. Previous users were excluded by eliminating individuals who had received a prescription for either drug within 1 year prior to the index date (i.e. prescription date of SGLT2 inhibitors or DPP4 inhibitors). Among 11 253 participants, individuals were excluded for the following reasons: prior history of renal replacement therapy (n = 5), prior diagnosis of diabetic ketoacidosis (n = 20), prior diagnosis of severe hypoglycaemia (n = 1), prior diagnosis of urinary tract or genital infection (n = 1582), missing data on cigarette smoking status (n = 1) and missing data on alcohol consumption (n = 415). Finally, 9229 participants were included in the study (Supplementary Fig. S2).
Measurements and definitions
We explored variables associated with SGLT2 inhibitor prescription to determine the candidate variables for the propensity score calculation. We reviewed the health check-up data collected within 12 months before the index date. From the reviewed health check-ups, we obtained data on body mass index (BMI), systolic blood pressure (SBP), diastolic blood pressure (DBP), cigarette smoking (current or non-current/never), alcohol consumption (daily or not daily), laboratory data [haemoglobin A1c (HbA1c), low-density lipoprotein cholesterol (LDL-C), high-density lipoprotein cholesterol (HDL-C), triglycerides and serum creatinine] and proteinuria status. Cigarette smoking and alcohol consumption were assessed using self-reported questionnaires. We calculated the eGFR using the following formula: eGFR = 194 × serum creatinine − 1.094 × age − 0.287 (× 0.739 if female) [25]. Proteinuria status was assessed by dipstick testing. Based on the ICD-10 codes, we obtained data on prior diagnoses of diabetic nephropathy (ICD-10 codes E102, E112, E122, E132 and E142), diabetic retinopathy (ICD-10 codes E103, E113, E123, E133 and E143) and diabetic neuropathy (ICD-10 codes E104, E114, E124, E134 and E144) at the index date (prescription date of SGLT2 inhibitors or DPP4 inhibitors). Information regarding concurrent medications [insulin, glucagon-like peptide-1 receptor agonist, biguanide, sulfonylurea, α-glucosidase inhibitor, thiazolidine, glinide, renin–angiotensin system (RAS) inhibitors, β-blockers, calcium channel blockers, mineralocorticoid receptor antagonists, diuretics and statins] at the index date was retrieved from the administrative claims records. We assessed the electronic Frailty Index (eFI), based on the cumulative deficit model of frailty [26, 27]. The index is measured as the proportion of equally weighted deficits present in an individual. We calculated the eFI to simplify its computation by using the modified ICD-10 list of deficits (Supplementary Material) [28, 29]. Previous epidemiological studies demonstrated that the eFI can be calculated in Japanese administrative claims records and was useful for evaluating individuals’ frailty status [28]. Further, we calculated the number of prescription medications within the past 6 months. Finally, we obtained data on a history of hospitalization in the last year from the administrative claims records.
Propensity score matching
To minimize confounding by indication, we used a 1:4 propensity score matching algorithm to create a matched cohort and compare the advantages of SGLT2 inhibitors and DPP4 inhibitors. A logistic regression model was used to calculate the propensity score for SGLT2 inhibitor treatment. The following covariates were used to estimate the propensity score: age, sex, BMI, SBP, DBP, cigarette smoking, alcohol consumption, diabetic nephropathy, diabetic retinopathy, diabetic neuropathy, concurrent medications (insulin, glucagon-like peptide-1 receptor agonist, biguanide, sulfonylurea, α-glucosidase inhibitor, thiazolidine, glinide, RAS inhibitors, β-blockers, calcium channel blockers, mineralocorticoid receptor antagonists, diuretics, and statins), HbA1c, LDL-C, HDL-C, triglycerides, proteinuria status, eGFR at the index date, eFI score, number of medications, hospitalization in the last year and the year of SGLT2 or DPP4 inhibitor prescription. The 1:4 propensity score matched cohort was created within a maximum calliper width of 0.2 standard deviation (SD) of the logit score.
Outcomes
The primary outcome was set as the change in eGFR following SGLT2 inhibitor or DPP4 inhibitor use initiation. The secondary outcomes were set as a decrease in eGFR ≥20%, ≥30% and ≥40% from the baseline. We obtained information on the risk of adverse events (diabetic ketoacidosis, severe hypoglycaemia and urinary tract or genital infection) after SGLT2 inhibitor or DPP4 inhibitor prescription. Study participants were followed up from the index date until dropped from insurance coverage, death, last date of eGFR measurement (maximum 5 years from the index date) or study end date (August 2021). In this study we adopted a protocol resembling the intention-to-treat analysis in RCTs. Therefore, for instance, individuals classified under the SGLT2 inhibitor group were observed continuously even if a DPP4 inhibitor was added during the course of treatment.
Statistical analysis
Continuous and categorical variables were presented as median [interquartile range (IQR)] and numbers (percentages), respectively. A linear mixed-effects model was applied for repeated measurements with a random intercept and random slope to compare the change in eGFR between the SGLT2 inhibitor and DPP4 inhibitor users. This model included the treatment group (SGLT2 inhibitor or DPP4 inhibitor users), time and the interaction term between the treatment group and time as fixed effects. To assess the difference in eGFR changes between SGLT2 inhibitor and DPP4 inhibitor users, we examined the interaction between the treatment group and time using the Wald test. We also conducted subgroup analyses based on median age (≥69 and <69 years), sex (male and female), median BMI (≥24.5 and <24.5 kg/m2), HbA1c (≥7.5 and <7.5%), the use of RAS inhibitor (with and without), proteinuria negative (negative and trace) and positive (1+, 2+ and 3+) and eGFR (≥60 and <60 ml/min/1.73 m2). When performing subgroup analyses, eligible participants (n = 9229) were divided into subgroups according to clinical background and then propensity score matching was performed again. We were successful in creating balanced cohorts in each subgroup.
Subsequently, we estimated the hazard ratios (HRs) and 95% confidence intervals (CIs) of a ≥20%, ≥30% and ≥40% decrease in eGFR of SGLT2 inhibitor users versus DPP4 inhibitor users using a Cox proportional hazards regression model. The risk of adverse events was compared between SGLT2 inhibitor users and DPP4 inhibitor users using a Cox proportional hazards regression model.
We performed three sensitivity analyses. First, we analysed changes in eGFR among individuals who used SGLT2 inhibitor or DPP4 inhibitor for >6 months. Second, we used a linear mixed-effects model only for individuals with a prior diagnosis of type 2 diabetes (ICD-10 code E11). Third, we examined the changes in eGFR in individuals with a follow-up period ≥365 days. All statistical analyses were performed using Stata version 18 (StataCorp, College Station, TX, USA). All significance tests were performed with two-tailed analysis and P < .05 was considered statistically significant.
RESULTS
Basic characteristics
The baseline characteristics before and after propensity score matching are listed in Table 1. The distribution of specific SGLT2 inhibitors and DPP4 inhibitors are shown in Supplementary Tables S1 and S2. After 1:4 propensity score matching, the SGLT2 inhibitor and DDP4 inhibitor user groups comprised 1271 and 5083 individuals, respectively. All the basic characteristics were well balanced after propensity score matching. The median age of SGLT2 inhibitor and DPP4 inhibitor users was 68 years (IQR 65–70) and 68 years (IQR 65–70), respectively. Among the SGLT2 inhibitor and DPP4 inhibitor users, 762 (60.0%) and 3074 (60.5%) were men, respectively. The median eGFR was 69.0 ml/min/1.73 m2 (IQR 59.7–79.9) and 69.0 ml/min/1.73 m2 (IQR 58.9–78.8) in SGLT2 inhibitor and DPP4 inhibitor users, respectively.
Baseline characteristics.
| Before propensity score matching | After 1:4 propensity score matching | |||||
|---|---|---|---|---|---|---|
| Characteristics | DPP4 inhibitors (n = 7941) | SGLT2 inhibitors (n = 1288) | SMD | DPP4 inhibitors (n = 5083) | SGLT2 inhibitors (n = 1271) | SMD |
| Age (years) | 69 (66–71) | 68 (65–70) | −0.262 | 68 (65–70) | 68 (65–70) | 0.028 |
| Male, n (%) | 4614 (58.1) | 773 (60.0) | 0.039 | 3074 (60.5) | 762 (60.0) | −0.011 |
| BMI (kg/m2) | 24.2 (22.1–26.5) | 26.3 (24.1–28.9) | 0.594 | 26.2 (23.8–29) | 26.3 (24–28.8) | −0.01 |
| SBP (mmHg) | 133 (124–144) | 133 (124–143) | −0.012 | 133 (124–143) | 133 (124–143) | −0.01 |
| DBP (mmHg) | 76 (69–83) | 77 (70–84) | 0.085 | 77 (70–84) | 77 (70–84) | −0.013 |
| Cigarette smoker, n (%) | 1142 (14.4) | 173 (13.4) | −0.027 | 727 (14.3) | 173 (13.6) | −0.02 |
| Alcohol consumption, n (%) | 2074 (26.1) | 325 (25.2) | −0.02 | 1353 (26.6) | 322 (25.3) | −0.029 |
| eFI score (points) | 0.16 (0.09–0.22) | 0.19 (0.12–0.25) | 0.144 | 0.19 (0.12–0.25) | 0.16 (0.12–0.25) | −0.006 |
| Medications (n) | 9 (6–15) | 10 (7–16) | 0.094 | 10 (6–16) | 10 (7–15) | −0.026 |
| Hospitalization in the last year, n (%) | 818 (10.3) | 129 (10.0) | −0.009 | 483 (9.5) | 127 (10.0) | 0.017 |
| Comorbidities, n (%) | ||||||
| Diabetic nephropathy | 707 (8.9) | 172 (13.4) | 0.142 | 618 (12.2) | 164 (12.9) | 0.023 |
| Diabetic retinopathy (%) | 1305 (16.4) | 252 (19.6) | 0.082 | 972 (19.1) | 239 (18.8) | −0.008 |
| Diabetic neuropathy | 204 (2.6) | 36 (2.8) | 0.014 | 114 (2.2) | 30 (2.4) | 0.008 |
| Medications, n (%) | ||||||
| Insulin | 516 (6.5) | 117 (9.1) | 0.097 | 459 (9.0) | 108 (8.5) | −0.019 |
| GLP1-RA | 21 (0.3) | 54 (4.2) | 0.268 | 118 (2.3) | 37 (2.9) | 0.037 |
| Biguanide | 1583 (19.9) | 335 (26.0) | 0.145 | 1276 (25.1) | 322 (25.3) | 0.005 |
| Sulfonylurea | 1000 (12.6) | 158 (12.3) | −0.01 | 603 (11.9) | 154 (12.1) | 0.008 |
| α-GI | 883 (11.1) | 148 (11.5) | 0.012 | 587 (11.5) | 142 (11.2) | −0.012 |
| Thiazolidine | 472 (5.9) | 117 (9.1) | 0.119 | 439 (8.6) | 116 (9.1) | 0.017 |
| Glinides | 311 (3.9) | 55 (4.3) | 0.018 | 198 (3.9) | 51 (4.0) | 0.006 |
| RAS inhibitor | 3293 (41.5) | 671 (52.1) | 0.214 | 2677 (52.7) | 657 (51.7) | −0.019 |
| Beta blocker | 774 (9.7) | 197 (15.3) | 0.168 | 764 (15.0) | 193 (15.2) | 0.004 |
| Calcium channel blocker | 3042 (38.3) | 515 (40.0) | 0.034 | 2050 (40.3) | 505 (39.7) | −0.012 |
| Mineralocorticoid receptor antagonist | 127 (1.6) | 37 (2.9) | 0.086 | 160 (3.1) | 35 (2.8) | −0.023 |
| Diuretic | 722 (9.1) | 192 (14.9) | 0.18 | 735 (14.5) | 183 (14.4) | −0.002 |
| Statin | 3472 (43.7) | 669 (51.9) | 0.165 | 2648 (52.1) | 660 (51.9) | −0.003 |
| Laboratory data | ||||||
| HbA1c, % | 6.9 (6.5–7.4) | 6.9 (6.4–7.4) | 0.016 | 6.9 (6.5–7.4) | 6.9 (6.4–7.4) | 0.006 |
| LDL-C, mg/dL | 118 (99–140) | 115 (94–136) | −0.121 | 115 (96–136) | 115 (94–136) | −0.024 |
| HDL-C, mg/dL | 55 (46–65) | 52 (45–63) | −0.174 | 53 (45–62) | 52 (45–63) | −0.002 |
| Triglycerides, mg/dL | 122 (87–175) | 136 (93–193) | 0.132 | 131 (93–189) | 136 (93–193) | −0.008 |
| eGFR, ml/min per 1.73 m2 | 70.2 (60.7–80.6) | 69.0 (59.5–79.8) | −0.088 | 69.0 (58.9–78.8) | 69.0 (59.7–79.9) | 0.011 |
| Proteinuria, n (%) | ||||||
| Negative | 6069 (76.4) | 934 (72.5) | 0.092 | 3700 (72.8) | 924 (72.7) | −0.001 |
| Trace | 963 (12.1) | 178 (13.8) | 696 (13.7) | 175 (13.8) | ||
| 1+ | 587 (7.4) | 105 (8.2) | 416 (8.2) | 102 (8.0) | ||
| 2+ | 239 (3.0) | 52 (4.0) | 178 (3.5) | 51 (4.0) | ||
| 3+ | 83 (1.0) | 19 (1.5) | 93 (1.8) | 19 (1.5) | ||
Values are presented as median (IQR) unless stated otherwise.
SMD: standardized mean difference; eFI:electronic frailty index; GLP1-RA: glucagon-like peptide-1 receptor agonist; α-GI: α-glucosidase inhibitor.
eGFR change between and SGLT2 inhibitor and DPP4 inhibitor use
The mean follow-up period was 604 ± 329 days. SGLT2 inhibitor users showed a slower decrease in eGFR than did the DPP4 inhibitor users (Fig. 1). The mean annual change in eGFR was −0.97 ml/min/1.73 m2/year (95% CI −1.24 to −0.70) in SGLT2 inhibitor users and −1.83 ml/min/1.73 m2/year (95% CI −1.97 to −1.69) in DPP4 inhibitor users (P for interaction < .001) (Fig. 2). This finding remained consistent in the subgroups based on age, sex, BMI, HbA1c, RAS inhibitor use and eGFR (Fig. 3). Among the positive proteinuria group, the mean annual change in eGFR was −1.95 ml/min/1.73 m2/year (95% CI −2.81 to −1.09) in SGLT2 inhibitor users and −2.40 ml/min/1.73 m2/year (95% CI −2.78 to −2.02) in DPP4 inhibitor users; however, no significant interaction between the treatment group and time was observed (P = .3518).
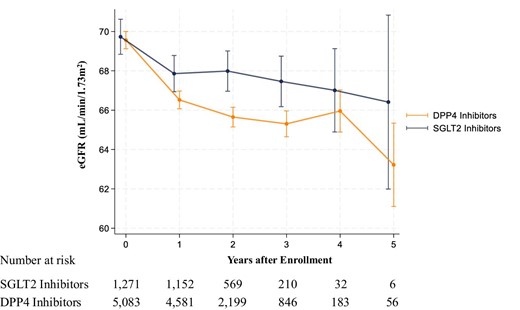
Change in eGFR among SGLT2 inhibitor and DPP4 inhibitor users. We used a linear mixed-effects model to compare changes in eGFR between SGLT2 inhibitor and DPP4 inhibitor users. The model included the treatment group (SGLT2 inhibitor or DPP4 inhibitor users), time and the interaction term between the treatment group and time as fixed effects. Error bars represent 95% CIs.
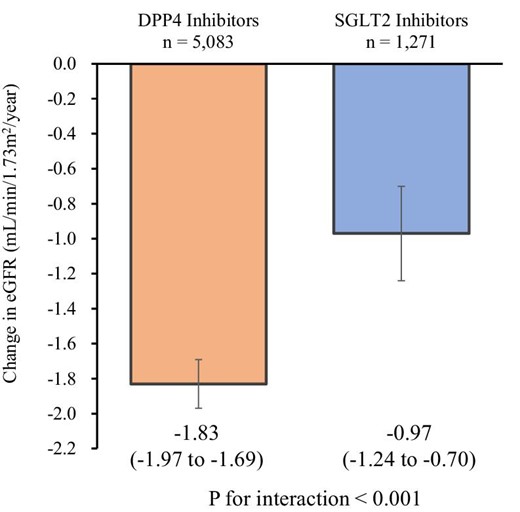
The annual change in eGFR among SGLT2 inhibitor and DPP4 inhibitor users. We used a linear mixed-effects model to compare the annual changes in eGFR between SGLT2 inhibitor and DPP4 inhibitor users. The model included the treatment group (SGLT2 inhibitor or DPP4 inhibitor users), time and the interaction term between the treatment group and time as fixed effects. Error bars represent 95% CIs.
![Subgroup analysis. Subgroup analysis was performed based on median age (≥69 and <69 years), sex (male and female), median BMI (≥24.5 and <24.5 kg/m2), HbA1c (≥7.5 and <7.5%), the use of RAS inhibitors (with and without), proteinuria [negative (negative and trace) and positive (1+, 2+ and 3+)] and eGFR (≥60 and <60 ml/min/1.73 m2). Error bars represent 95% CIs.](https://oup.silverchair-cdn.com/oup/backfile/Content_public/Journal/ndt/40/3/10.1093_ndt_gfae158/1/m_gfae158fig3.jpeg?Expires=1747855957&Signature=XcPxl9-QojmquVvN1U5eNDZuGjljeRaas16Xg3IwnSCdy9czSbEFNVGVb6-~f5TWwrQLpmkXxTs~FSarJWQGyJ3qzHKdQ5fQw3WjQ4VhdMBewCU1JnQpUxy72oy7bKEpwa16kOYBRj6AERCusPIXf9b8iRdOCOreMSdg~RYNTXkI5ZDGVSgoHx0UsEPMCORdFS2DW5RUZ6PP-i2~Syk~sCPEQ-btNf1W4GWdXsD6TGIScgD1x0YXHKZfhbOAeST1AlrZ~UIWbx9z2MYl-ePcVnOet3bZ8XRAb0cGG7G-lUZEsAOk9WVxH7anJGzmeSkbblKRyJAF237tFLKtRinclg__&Key-Pair-Id=APKAIE5G5CRDK6RD3PGA)
Subgroup analysis. Subgroup analysis was performed based on median age (≥69 and <69 years), sex (male and female), median BMI (≥24.5 and <24.5 kg/m2), HbA1c (≥7.5 and <7.5%), the use of RAS inhibitors (with and without), proteinuria [negative (negative and trace) and positive (1+, 2+ and 3+)] and eGFR (≥60 and <60 ml/min/1.73 m2). Error bars represent 95% CIs.
Secondary outcomes
The associations between SGLT2 inhibitor use and secondary outcomes are presented in Table 2. The risk of a ≥20%, ≥30% and ≥40% decrease in eGFR was lower in SGLT2 inhibitor users than in DPP4 inhibitor users [HR 0.78 (95% CI 0.64–0.96), HR 0.64 (95% CI 0.43–0.97) and HR 0.46 (95% CI 0.24–0.88), respectively]. We observed no significant increase in the risk of adverse events among SGLT2 inhibitor users. For example, the HR of a urinary tract or genital infection in SGLT2 inhibitor users was 0.87 (95% CI 0.71–1.08) compared with that in DPP4 inhibitor users.
Secondary outcomes and adverse events.
| Outcomes/events | n | Events, n (%) | Incidence, median (IQR) | HR (95% CI) | P-value |
|---|---|---|---|---|---|
| Secondary outcomes | |||||
| eGFR ≥20% decline | |||||
| DPP4 inhibitors | 5083 | 585 (11.5) | 721.2 (665.1–782.1) | 1 [Reference] | 0.016 |
| SGLT2 inhibitors | 1271 | 114 (9.0) | 562.4 (468.0–675.7) | 0.78 (0.64 to 0.96) | |
| eGFR ≥30% decline | |||||
| DPP4 inhibitors | 5083 | 165 (3.2) | 197.8 (169.8–230.4) | 1 [Reference] | 0.037 |
| SGLT2 inhibitors | 1271 | 26 (2.0) | 126.1 (85.9–185.3) | 0.64 (0.43 to 0.97) | |
| eGFR ≥40% decline | |||||
| DPP4 inhibitors | 5083 | 90 (1.8) | 107.2 (87.2–131.8) | 1 [Reference] | 0.019 |
| SGLT2 inhibitors | 1271 | 10 (0.8) | 48.4 (26.0–89.9) | 0.46 (0.24 to 0.88) | |
| Adverse events | |||||
| Diabetic ketoacidosis | |||||
| DPP4 inhibitors | 5083 | 2 (0.04) | 1.5 (0.4–5.9) | 1 [Reference] | 0.051 |
| SGLT2 inhibitors | 1271 | 3 (0.2) | 8.8 (2.8–27.4) | 5.95 (0.99 to 35.61) | |
| Severe hypoglycaemia | |||||
| DPP4 inhibitors | 5083 | 0 (0.0) | 0 | 1 [Reference] | – |
| SGLT2 inhibitors | 1271 | 1 (0.1) | 2.9 (0.4–20.9) | Not estimable | |
| Urinary tract or genital infection | |||||
| DPP4 inhibitors | 5083 | 487 (9.6) | 380.7 (348.3–416.0) | 1 [Reference] | 0.203 |
| SGLT2 inhibitors | 1271 | 107 (8.4) | 331.5 (274.3–400.6) | 0.87 (0.71 to 1.08) |
We used a Cox proportional hazards regression analysis. The incidence rate was per 10 000 person-years.
Sensitivity analyses
First, we analysed 1086 SGLT2 inhibitor users and 4345 DPP4 inhibitor users who had sustained SGLT2 inhibitor or DPP4 inhibitor use for >6 months. SGLT2 inhibitor users showed a slower decrease in eGFR compared with DPP4 inhibitor users (P < .001) (Supplementary Fig. S3). Second, we identified 794 SGLT2 inhibitor users and 3177 DPP4 inhibitor users with a prior diagnosis of type 2 diabetes. SGLT2 inhibitor users had a slower eGFR decrease compared with DPP4 inhibitor users (Supplementary Fig. S4). Third, the main findings remained consistent, even in individuals with a follow-up period ≥365 days (Supplementary Fig. S5).
DISCUSSION
Using a nationwide health check-up and insurance claims database that included ≈6400 individuals ≥60 years of age with diabetes who were newly prescribed either SGLT2 inhibitors or DPP4 inhibitors, we compared the change in eGFR between the two groups following propensity score matching. SGLT2 inhibitor use was associated with better kidney outcomes than DPP4 inhibitor use. There was no clear difference in the risk of adverse events between the two groups. To the best of our knowledge, this is the first study to demonstrate the potential benefits of SGLT2 inhibitors on kidney outcomes in older individuals with diabetes using a large-scale real-world dataset.
SGLT2 inhibitors have revolutionized the management strategy for people with diabetes, because they offer kidney-protective effects beyond their glucose-lowering capabilities, as demonstrated by RCTs. Accordingly, the American Diabetes Association recommends the use of SGLT2 inhibitors for individuals with type 2 diabetes and CKD [30]. The prevalence of diabetes is increasing in older individuals. These older individuals with diabetes frequently present with multiple comorbidities, placing them at a high risk of kidney function decline [31]. Therefore, preventing kidney function deterioration in older individuals with diabetes poses a major clinical challenge. In this circumstance, we analysed a nationwide real-world database and found the decrease in eGFR was slower in individuals who were prescribed SGLT2 inhibitors compared with those prescribed DPP4 inhibitors among individuals ≥60 years of age with diabetes.
If SGLT2 inhibitors demonstrate a clear preventive effect on kidney function decline in older adults with diabetes, their clinical significance would undoubtedly be profound. Post hoc analyses of the EMPA-REG OUTCOME trial (NCT01131676), a landmark trial demonstrating the advantage of SGLT2 inhibitor use [32], revealed that empagliflozin lowered the risk of cardiovascular events and kidney outcomes, regardless of age. Monteiro et al. [33] categorized individuals enrolled in the EMPA-REG OUTCOME trial by baseline age (<65, 65–74 and ≥75 years). They reported that the HRs of empagliflozin versus the placebo for incident or worsening nephropathy (defined as progression to macroalbuminuria, doubling of serum creatinine accompanied by eGFR ≤45 ml/min/1.73 m2, initiation of renal placement therapy or death due to renal disease and components of incident or worsening nephropathy) were 0.61 (95% CI 0.51–0.73) in people <65 years of age, 0.65 (95% CI 0.52–0.81) in those 65–74 years of age and 0.54 (95% CI 0.37–0.79) in those ≥75 years of age and found no interaction between baseline age and the effect of empagliflozin (P = .733). A VERTIS CV (NCT01986881) analysis, another RCT based on ertugliflozin, confirmed the kidney-protective effects of ertugliflozin and showed that the overall pattern of changes in eGFR with ertugliflozin versus placebo during the observational period was consistent across age subgroups (<65 years versus ≥65 years and <75 years versus ≥75 years) [13].
Our findings were generally consistent with those of previous studies. However, our study has the following novelties. First, our study focused on examining the association between SGLT2 inhibitors and kidney outcomes in older individuals with diabetes, utilizing a comprehensive nationwide real-world dataset. To our knowledge, this constitutes the largest epidemiological investigation conducted in this specific domain. While RCTs are considered the gold standard in medical research, it is imperative to acknowledge their experimental nature, which involves employing various inclusion and exclusion criteria. Conversely, older individuals often present with a wider array of comorbidities and clinical profiles compared with their younger counterparts. Hence it is crucial to assess the efficacy of SGLT2 inhibitors in older populations using real-world data that accurately reflect clinical practices.
Second, in this study we employed the latest pharmaco-epidemiological methods (utilizing a new-user design) to compare the kidney outcomes of SGLT2 inhibitors and DPP4 inhibitors, as outlined in the Methods section, particularly in Supplementary Fig. S1. Additionally, conducting a range of sensitivity analyses made possible by the large sample size of our database provided further confirmation of our primary findings, thus reinforcing the reliability of our results. For instance, even in the subgroup with lower BMI, we observed the kidney-protective effects of SGLT2 inhibitors surpassing those of DPP4 inhibitors. Given the significant proportion of older individuals with diabetes who do not have obesity, the clinical relevance of SGLT2 inhibitors in such patients has garnered attention. This analysis yields novel insights into the practical application of SGLT2 inhibitors in clinical practice. Furthermore, our study observed a potential advantage of SGLT2 inhibitors over DPP4 inhibitors concerning kidney outcomes in individuals with negative proteinuria [34], highlighting the kidney function–preserving effects of SGLT2 inhibitors in older adults with diabetes at an earlier stage without overt albuminuria.
Third, when considering medication use, both efficacy and safety hold equal importance, particularly among older individuals. Our study found no significant disparity in the risk of adverse events, such as ketoacidosis, severe hypoglycaemia and urinary tract or genital infections, between users of SGLT2 inhibitors and DPP4 inhibitors. Many older individuals persist in using medications with known hypoglycaemic risks, such as insulin and sulfonylureas. Prior to commencing SGLT2 inhibitors or DPP4 inhibitors, 6.9% and 12.5% of the study participants, respectively, had been using insulin and sulfonylureas. Demonstrating the efficacy and safety of SGLT2 inhibitors in older individuals would justify their use in older individuals with diabetes.
Our study presents some limitations. Inherent limitations are primarily associated with the use of the DeSC database, as previously discussed [35–37]. Our investigation was observational and retrospective, which complicated completely ruling out the possibility of unmeasured residual confounding, despite employing rigorous statistical techniques such as propensity score matching and a variety of sensitivity analyses. In this study, adjustments were made for as many clinical background factors as possible. However, due to incomplete information in our dataset, adjustments could not be made for some important factors (such as drug dosage and duration of diabetes). Additionally, since this study focused on Japanese individuals with diabetes, concerns regarding generalizability also exist. The follow-up duration was also relatively short, with a mean observation period of 1.6 years after propensity score matching, which made it impractical to analyse clinical outcomes such as end-stage kidney disease or kidney-related mortality. Given the limited observation period and the substantial proportion of study participants with preserved eGFR at the initial health check-ups, we focused on comparing the rate of decrease of eGFR between SGLT2 inhibitor and DPP4 inhibitor use as a primary outcome based on the latest statement in this field [38]. This approach allowed us to potentially identify differences in kidney outcomes between the two drugs. However, it is essential to acknowledge that this analysis of the rate of decrease in eGFR does not account for the competing risk of mortality. The number of adverse events is limited and the possibility of insufficient statistical power should be acknowledged. Our study included only individuals with diabetes in which eGFR could be assessed at two or more health checkups and therefore the possibility of selection bias cannot be ruled out. Finally, physical frailty and sarcopenia are important factors when evaluating outcomes in older individuals with diabetes. Unfortunately, information regarding these factors except baseline eFI scores was unavailable for the present dataset. Future research that could answer the questions regarding the effect in older individuals with physical frailty or sarcopenia may be essential to a better understanding of the effectiveness and tolerability of SGLT2 inhibitors on kidney function in older individuals.
CONCLUSION
Our large-scale real-world dataset analysis demonstrated that older individuals with diabetes who were newly prescribed SGLT2 inhibitors had more favourable kidney outcomes than did those who were newly prescribed DPP4 inhibitors. These findings suggest a potential advantage of SGLT2 inhibitors for kidney outcomes, even in older individuals with diabetes. At the same time, careful discussion is required regarding the clinical significance of the degree of kidney function decline inhibition demonstrated by this study in older people. Furthermore, in older individuals, along with the benefits of treatment, consideration of treatment-related adverse events is necessary. In this study, although there was no clear difference in the risk of events such as severe hypoglycaemia, diabetic ketoacidosis and urinary tract or genital infection between the groups treated with SGLT2 inhibitor and DPP4 inhibitor, the limited number of events precludes us from drawing conclusions solely based on this study alone. Accumulation of data and vigorous discussion on both the benefit and risk perspectives are required to assess the clinical meaning of administering SGLT2 inhibitors to older individuals with diabetes.
ACKNOWLEDGEMENTS
This study was approved by the Ethics Committee of the University of Tokyo (approval number 2021010NI) and conducted in accordance with the Declaration of Helsinki. The requirement for informed consent was waived, as all data included in the DeSC database were anonymized and de-identified. The DeSC database is accessible to individuals who acquire the dataset from DeSC Healthcare (https://desc-hc.co.jp/en).
FUNDING
This work was supported by grants from the Ministry of Health, Labour and Welfare, Japan (23AA2003) and the Ministry of Education, Culture, Sports, Science and Technology, Japan (20H03907, 21H03159, 21K08123 and 22K21133). The funding sources played no role in the current study.
AUTHORS’ CONTRIBUTIONS
H.K., Y.S., A.O., T.K., N.T., H.M. and I.K. were responsible for the conception and design. Y.S., A.O., K.F. and H.Y. were responsible for the analysis of data. H.K., Y.S., A.O., J.K., N.T., H.M., A.N., K.N. and I.K. were responsible for the interpretation of data. H.K., Y.S., A.O., T.K., J.K., N.T., H.M. and H.Y. were responsible for drafting of the manuscript. N.T., H.M., A.N., K.N., H.Y., M.N. and I.K. were responsible for critical revision for important intellectual content. All authors approved the submitted manuscript.
DATA AVAILABILITY STATEMENT
Anonymized data are publicly available for purchase from DeSC Healthcare.
CONFLICT OF INTEREST STATEMENT
H.K. and K.F received research funding and scholarship funds from Medtronic Japan, Boston Scientific Japan, Biotronik Japan, Simplex Quantum and Fukuda Denshi. I.K. received remuneration for a lecture from AstraZeneca, MSD, Otsuka Pharmaceutical, Ono Pharmaceutical, Daiichi Sankyo, Mitsubishi Tanabe Pharma, Nippon Boehringer Ingelheim, Bayer Yakuhin, Novo Nordisk Pharma and Pfizer Japan; trust research/joint research funds from Ono Pharmaceutical and scholarship funds from Idorsia Pharmaceuticals Japan, MSD, Ono Pharmaceutical, Sanofi, Daiichi Sankyo, Dainippon Sumitomo Pharma, Takeda Pharmaceutical, Mitsubishi Tanabe Pharma, Teijin Pharma and Toa Eiyo. A.N. received research funding from Bayer Yakuhin, Daiichi Sankyo, Nippon Boehringer Ingelheim and Taisho Pharmaceutical and a participated in speakers bureaus for Daiichi Sankyo, Nippon Boehringer Ingelheim, Novartis Pharma, Mochida Pharmaceutical, AstraZeneca, Mitsubishi Tanabe Pharma and Otsuka Pharmaceutical.


Comments