


Abstract
Kidney transplant recipients (KTR) are prone to develop post-transplant diabetes (PTD). Iron plays a role in glucose homeostasis and patients with iron overload have a high prevalence of diabetes. Since iron overload can also occur in KTR, we investigated whether levels of ferritin are associated with incident PTD in KTR.
This is a prospective observational cohort study of adult KTR ≥1 year after transplantation of the Transplantlines Insulin Resistance and Inflammation Biobank and Cohort study. Cox regression analyses were applied to study the association of serum ferritin with incident PTD (fasting plasma glucose ≥126 mg/dL, or nonfasting plasma glucose ≥200 mg/dL combined with diabetes symptoms, or use of glucose-lowering medication). Models were adjusted for age, sex, body mass index, C-reactive protein (CRP), diabetes risk factors, transplantation factors, and immunosuppressive drugs. To explore potential clinical cut-offs of ferritin levels from which the risk of PTD might increase, categories of ferritin (<100, 100-300, 300-500, and >500 µg/L) were used in subsequent analysis.
We included 399 KTR (age 51 [IQR, 41-59 years], 54% males, and at a median of 6.1 [3.0-12.1] years after transplantation) without diabetes at baseline. During a median follow-up of 9.7 [7.6-10.3] years, 45 KTR (11%) developed PTD. In multivariable Cox regression analyses, serum ferritin levels were significantly associated with incident PTD independent of adjustment for potential confounders (Table 1, hazard ratio (HR) per 50 µg/L, 1.12; 95% CI 1.05-1.18; P = 0.0002). Furthermore, in analysis with ferritin categories, we identified that KTR with ferritin >500 µg/L (n = 38) had a significantly higher chance of PTD compared to KTR with ferritin between 100-300 µg /L (Fig. 1, HR, 3.66; 95% CI 1.37-9.77; P = 0.01). KTR with ferritin levels <100 and between 300-500 µg/L had a similar risk of PTD compared to KTR with ferritin levels between 100-300 µg/L.
Ferritin levels are associated with PTD in KTR, independent of other known diabetes risk factors, including inflammation. KTR with ferritin levels above 500 µg/L appear particularly prone to develop PTD. Further investigation should determine the underlying mechanisms and consequences of these findings with respect to target goals of ferritin levels after kidney transplantation.
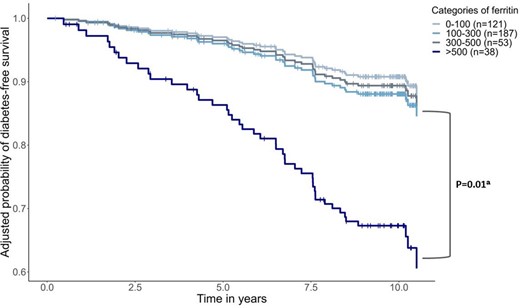
Post-transplant diabetes per ferritin category.
The adjusted probability of post-transplantation diabetes-free survival per ferritin category is plotted based on a Cox regression model adjusted for age, sex, body mass index, C-reactive protein, diabetes risk factors, transplantation factors, and immunosuppressive drugs. aWald statistic value. The vertical lines show censoring due to death or loss of follow-up.
Association of ferritin with post-transplant diabetes.
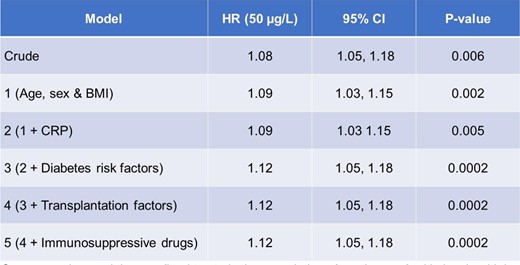
Cox regression models were fitted to study the association of continuous ferritin levels with incident post-transplant diabetes. The hazard ratio is shown for a ferritin increase of 50 µg/L. Model 1 was adjusted for age, sex, and body mass index. Model 2: Model 1 + CRP. Model 3: Model 2 + diabetes risk factors (alcohol use, smoking behavior, family history of diabetes, total cholesterol, systolic blood pressure, and glycated hemoglobin). Model 4: Model 3 + transplantation factors (acute rejection, cytomegalovirus infection after transplantation, 24-hour protein excretion, and estimated glomerular filtration rate). Model 5: Model 4 + immunosuppressive drugs (use of calcineurin inhibitors and daily dose of prednisolone). HR: Hazard ratio. BMI: body mass index. CRP: C-reactive protein.
Association of ferritin with post-transplant diabetes.
Cox regression models were fitted to study the association of continuous ferritin levels with incident post-transplant diabetes. The hazard ratio is shown for a ferritin increase of 50 µg/L. Model 1 was adjusted for age, sex, and body mass index. Model 2: Model 1 + CRP. Model 3: Model 2 + diabetes risk factors (alcohol use, smoking behavior, family history of diabetes, total cholesterol, systolic blood pressure, and glycated hemoglobin). Model 4: Model 3 + transplantation factors (acute rejection, cytomegalovirus infection after transplantation, 24-hour protein excretion, and estimated glomerular filtration rate). Model 5: Model 4 + immunosuppressive drugs (use of calcineurin inhibitors and daily dose of prednisolone). HR: Hazard ratio. BMI: body mass index. CRP: C-reactive protein.


Comments