


Abstract
There is data suggesting estimated glomerular filtration rate using Cystatin-C (eGFRCystatin-C) is superior to the creatinine-based (eGFRCreat) method when assessing associations between renal function and mortality (Lees et al. 2019). Given cystatin-C is derived from all nucleated cells and creatinine from skeletal muscle, there remains a need to understand how controlling for multimorbidity, inflammation and estimates of muscle mass will affect the association between mortality and these different measures of renal function.
An observational study was conducted using the UK Biobank cohort. Adults were recruited between 2007-2010 at 22 UK centres. MM was estimated using bioimpedance defined whole body fat-free mass (BI-FFM: Tanita BC418). The primary outcome was all-cause mortality (ACM—data from NHS Information Centre [England / Wales] and NHS Central Registry [Scotland]). Follow up was defined as the period between the first visit date to either date of death / the latest date for central registry downloads (December 2021). Estimated GFRCreat or eGFRCystatin-C were calculated using the CKD-EPI 2009 equation without ethnicity correction. Albuminuria was defined as a urine albumin / creatinine ratio of >3 mg/mmol. Participants were excluded if they were on dialysis, died from SARS-CoV-2 infection or withdrew consent. Sequences of regressions analyses (SoRA), a graphical Markov modelling technique which assesses complex direct and indirect pathways of association between blocks of variables which are ordered a-priori to reflect postulated directions of association, were constructed for both eGFRCreat and eGFRCystatin-C.
There were 500,589 participants eligible for analysis (272,623 females / 227,966 males). There were 10,299 and 21,319 participants with eGFRCreat and eGFRCystatin-C < 60 ml/min/1.73 m2 respectively, and 25,308 with a urine albumin/creatinine ratio > 3 mg/mmol. There were 33,755 deaths over a median follow up period of 12.58 (IQR 11.85-13.30) yrs. Higher eGFRCreat was associated with higher odds of ACM in men (OR 1.012, 95% CI 1.004-1.020) and women (OR 1.010, 95% CI 1.001-1.018) in the presence of an interaction with weight in both sexes. Higher eGFRCystatin-C was associated with lower odds of ACM in men (OR 0.978, 95% CI 0.968-0.988) and women (Fig. 1: OR 0.986, 95% CI 0.984-0.987). In men there was an interaction between eGFRCystatin-C and weight observed but no such interaction was observed in women. Interaction plots showed that weight had less influence on the association between ACM and renal function in the eGFRCystatin-C compared to the eGFRCreat sub-models.
Higher eGFRCreat is associated with higher odds of ACM when controlling for FFM and weight, whereas higher eGFRCystatin-C is associated with lower odds of ACM. This suggests eGFRCystatin-C is more resilient to the effects of variable body composition when compared with eGFRCreat, providing a potential explanation for the stronger association between eGFRCystatin-C and mortality in patients with long term conditions including in chronic kidney disease (CKD). In this model, eGFRCreat should be viewed as a FFM surrogate.
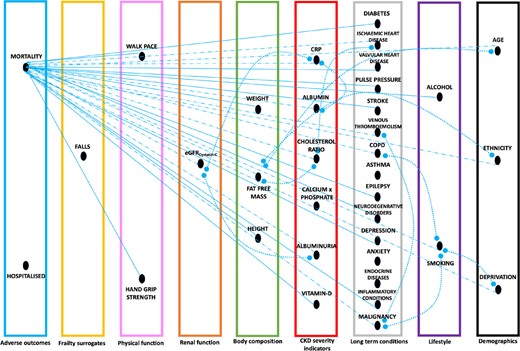
Factors directly associated with mortality using sequences of regressions analyses (SoRA) in females using the eGFRCystalin-C submodel. Mortality in this model is seen as a response viariable to variables to the right on the graph. Direct associations without interaction are depicted as straight lines (continuous line) with the arrow pointing towards mortality. Direct associations with interactions present are depicted as straight lines (dotted-hyphenated line) with the arrow pointing towards mortality. Interaction terms within the final model are depicted as curved lines (dotted), adjoining the two variables involved in the interaction term.


Comments