


ABSTRACT
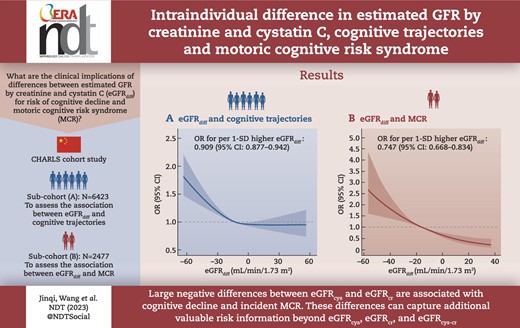
Intraindividual differences between estimated glomerular filtration rate (eGFR) based on cystatin C (eGFRcys) and creatinine (eGFRcr) can convey important clinical information regarding health status. However, the clinical implications of these differences (eGFRdiff) for risk of cognitive decline and motoric cognitive risk (MCR) syndrome remains unclear. We aimed to investigate the longitudinal associations of eGFRdiff with cognitive trajectories and incident MCR.
Based on the China Health and Retirement Longitudinal Study, we identified two study subcohorts: one for cognitive trajectory follow-up (6423 participants, 2011–2018) and another for incident MCR follow-up (2477 participants, 2011–2015). The eGFRdiff was defined as eGFRcys − eGFRcr. Adjusted ordinal and binary logistic regression models were separately used to assess the associations of eGFRdiff with cognitive trajectories and incident MCR. We also performed discordance analyses for eGFRdiff versus eGFRcys, eGFRcr or eGFR based on both creatinine and cystatin C (eGFRcys-cr).
In the first subcohort, four distinct 7-year cognitive trajectories were identified. Each 1 standard deviation (SD) higher eGFRdiff (value for eGFRcys − eGFRcr) was associated with a lower risk of poorer cognitive trajectories {odds ratio 0.909 [95% confidence interval (CI) 0.877–0.942]}. In the second subcohort, 121 participants developed incident MCR after a 4-year follow-up. Each 1-SD higher eGFRdiff (value for eGFRcys − eGFRcr) was linked with a 25.3% (95% CI 16.6–33.2) decreased risk for MCR. The above associations persisted in individuals with normal kidney function. Additionally, the risk for cognitive decline and incident MCR was more strongly associated with eGFRcys than eGFRcr and eGFRcys-cr. For the discordance analyses, the ‘discordantly high eGFRdiff/low eGFR’ group but not the ‘discordantly low eGFRdiff/high eGFR’ exhibited a significantly lower risk of poorer cognitive trajectories and MCR compared with the concordant group.
A large negative difference between eGFRcys and eGFRcr (eGFRcys < eGFRcr) was associated with a higher risk of cognitive decline and incident MCR. The eGFRdiff could capture additional valuable risk information beyond eGFRcys, eGFRcr and eGFRcys-cr.
What was known:
Intraindividual differences between estimated glomerular filtration rate (eGFR) based on cystatin C (eGFRcys) and creatinine (eGFRcr) have been linked to multiple adverse outcomes. However, the clinical implications of these differences (eGFRdiff) for the risk of cognitive decline and motoric cognitive risk (MCR) syndrome, a pre-dementia syndrome, remain unclear.
This study adds:
We provided the first evidence that compared with participants who have similar eGFRcys and eGFRcr, those with large negative values of eGFRdiff (eGFRcys < eGFRcr) had a higher risk of poorer cognitive trajectories and incident MCR; the risk for cognitive decline and incident MCR was more strongly associated with eGFRcys than eGFRcr and eGFRcys-cr and the eGFRdiff could convey additional valuable risk information on cognitive decline and MCR beyond eGFRcys, eGFRcr and eGFRcys-cr alone.
Potential impact:
Our findings highlight that eGFRdiff can serve as a more reliable indicator to identify the risk for cognitive decline and MCR beyond eGFRcys, eGFRcr and eGFRcys-cr. In clinical practice, monitoring the intraindividual eGFRdiff may optimize the risk assessment and clinical management of cognitive impairment and MCR to prevent dementia at an early stage.
INTRODUCTION
Due to the aging population, cognitive impairment and dementia have become a serious global public health concern that leads to a reduced quality of life and substantial economic burden [1–4]. The prevalence of mild cognitive impairment and dementia is estimated to be 15.5% and 6.0%, respectively, among adults ≥60 years of age in China [5]. Motoric cognitive risk (MCR) syndrome is considered a pre-dementia syndrome with subjective cognitive complaints and objective slow gait speed [6, 7]. Strong links have been established between MCR and multiple adverse outcomes, such as dementia, falls and disability, as well as all-cause mortality [6, 8–11]. Given that there is no effective disease-modifying treatment for dementia and cognitive impairment [2, 3], early identification of potential risk factors or prodromal biomarkers of cognitive decline and pre-dementia syndromes is crucial to prevent or delay the incidence of dementia and promote healthy aging.
Impaired kidney function, as quantified by estimated glomerular filtration rate (eGFR), has been previously viewed as a potential risk factor for dementia and cognitive impairment [12, 13]. However, several studies have yielded inconsistent results, showing no associations between eGFR and dementia or cognitive decline [14–16]. This inconsistency may be attributable to the different methods used in the estimation of GFR. A previous study suggested that lower cystatin C–based eGFR (eGFRcys), but not eGFR based on creatinine (eGFRcr) or a combination of cystatin C and creatinine (eGFRcys-cr), was significantly associated with dementia [17]. As for the reasons, creatinine is more affected by non-kidney factors, in particular by muscle mass, physical activity and diet, which may lead to overestimation or underestimation of kidney function and confound the relationship between eGFR containing creatinine information and cognitive function [18–20]. Compared with creatinine, cystatin C is not only less influenced by non-kidney factors, but is also unaffected by race or genetic ancestry [18]. When the levels of serum cystatin C and creatinine are disproportionately affected by non-kidney factors, there may be a considerable discrepancy between eGFRcys and eGFRcr measured in the same individual [19].
Although the eGFR equation including both cystatin C and creatinine has been developed to balance the non-kidney determinants and had greater precision and accuracy than either marker alone [21, 22], the differences between eGFRcys and eGFRcr (eGFRdiff, defined as eGFRcys − eGFRcr) has been ignored [23]. This may mask important clinical information about an individual's health status provided by these differences. For instance, recent studies demonstrated that eGFRdiff can serve as a biomarker reflecting muscle mass [24] and frailty status [23, 25–27]. Additionally, prior studies also found that lower negative eGFRdiff was associated with a higher risk of all-cause mortality, physical function decline, injurious falls, kidney failure, heart failure and other cardiovascular diseases [18–20, 23, 25]. However, it remains unclear whether eGFRdiff is related to the cognitive function and MCR. Considering that eGFRdiff could capture information about the risk for multiple adverse outcomes related to aging to a certain extent [23, 28], we hypothesized that eGFRdiff would predict the aging trajectory of cognitive function and incident MCR. Finally, whether and to what extent eGFR calculated by different markers affects dynamic cognitive trajectories and the risk of MCR is also an open question.
Thus, based on nationally representative data from the China Health and Retirement Longitudinal Study (CHARLS), we conducted this study among middle-aged and older adults to identify distinct 7-year cognitive trajectories and investigate the association between the baseline eGFRdiff and cognitive trajectories; evaluate the relationship between eGFRdiff and 4-year risk of developing MCR; further determine the independent associations of eGFRcys, eGFRcr and eGFRcys-cr with study outcomes; and perform discordance analyses to explore whether eGFRdiff is superior to these eGFR indicators in identifying individuals at increased risk of poor cognitive trajectories and MCR.
MATERIALS AND METHODS
Study population
CHARLS is an ongoing nationwide cohort study conducted among Chinese adults ≥45 years of age. The baseline survey was carried out between June 2011 and March 2012. A total of 17 707 participants from 150 county-level units distributed in 28 provinces of China were recruited at baseline through multistage probability sampling and the subsequent three follow-up visits were carried out (wave 2 in 2013, wave 3 in 2015 and wave 4 in 2018). Details about the data have been previously described elsewhere [29, 30]. The protocols of CHARLS were approved by the Biomedical Ethics Review Committee of Peking University (IRB00001052-11015). All participants provided written informed consent. We identified two subcohorts from CHARLS.
The first subcohort was constructed to explore the longitudinal association of baseline eGFRdiff and other kidney function measures based on creatinine and cystatin C with 7-year cognitive trajectories. Participants were excluded if they had missing data on gender, age, cognitive function, serum cystatin C and creatinine; had prior diagnoses of memory-related disease (Alzheimer's disease, brain atrophy, Parkinson's disease); or were lost to follow-up from waves 2 to 4. A total of 6423 participants were enrolled for the analyses (Supplementary Fig. S1).
The second subcohort was constructed to follow-up for incident MCR. Considering the availability of data required for the assessment of MCR, the data from 2011 to 2015 were used. We excluded those with an unavailable follow-up survey in 2015; missing information about gender, age, assessments of MCR, serum cystatin C and creatinine, a history of memory-related disease or physical disability; or who were diagnosed with MCR at baseline. Ultimately, a total of 2477 participants were included (Supplementary Fig. S2).
The timeline of the study is presented in Supplementary Fig. S3.
Assessment of exposure
The detailed process of blood sample collection, transportation, storage and analysis is described in a previous study [30]. The particle-enhanced turbidimetric assay method was used to measure serum cystatin C, and creatinine concentration was measured using a rate-blanked and compensated Jaffe creatinine method [30].
eGFRcys, eGFRcr and eGFRcys-cr were calculated using the 2012 Chronic Kidney Disease Epidemiology Collaboration (CKD-EPI) equation [22] and 2021 race-free equations [31] were used in the sensitivity analysis. The eGFRdiff was defined as eGFRcys − eGFRcr, with positive values indicating a higher eGFRcys than eGFRcr and negative values indicating a higher eGFRcr than eGFRcys. The study population was divided into three categories based on a cut-off value of 15 ml/min/1.73 m2: negative group (eGFRdiff <−15 ml/min/1.73 m2, with eGFRcys < eGFRcr), midrange group (eGFRdiff between −15 and +15 ml/min/1.73 m2, with eGFRcys similar to eGFRcr) and positive group (eGFRdiff >+15 ml/min/1.73 m2, with eGFRcys > eGFRcr). These cut-off values were chosen to be consistent with previous studies [18, 19, 23, 26, 32] and 15 ml/min/1.73 m2 can represent a clinically meaningful difference in eGFR-determined CKD stages [18, 19].
Assessment of cognitive function
Cognitive performance was evaluated by two measures: episodic memory and executive function [3, 33]. In the episodic memory test, participants were instructed to recall 10 Chinese words just read to them (immediate recall) and 5 min later (delayed recall). We counted the number of words correctly recalled and the episodic memory score was the average value of the immediate and delayed recall scores, ranging from 0 to 10. In the executive function test, participants were shown a picture and asked to redraw it. The score was 1 if the participants succeeded. They also were required to subtract 7 from 100 serially five times and identify the date (year, season, month, week, day). Answers to these questions were summed into the executive function score, ranging from 0 to 11. The global cognitive score was determined as the sum of the episodic memory score and executive function score, ranging from 0 to 21.
Assessment of MCR
MCR is defined as the presence of cognitive complaints and slow gait without dementia or mobility disability [8]. In CHARLS, subjective cognitive complaints were identified if participants answered ‘fair’ or ‘poor’ (versus ‘excellent’, ‘very good’ or ‘good’) to a self-reported question about memory loss: ‘How would you rate your memory at the present time?’ [34]. For gait speed, each participant was asked to walk 2.5-m at their regular pace twice (there and back) and the average of the values was used. Slow gait was defined as ≤1.0 standard deviation (SD) for age- (≤75, >75 years) and sex-appropriate mean values of walking speed in this cohort [7, 34].
Covariates
Several potentially confounding covariates were considered in our analyses and obtained through structured questionnaires, blood tests and physical examinations. Specifically, sociodemographic characteristics included age, gender (male, female), marital status (married, other), residence (rural, urban) and education level (no formal education, junior high school or below, high school or above). Health-related factors included smoking status (non-smoker, former smoker, current smoker), drinking status (drinking more than once per month, drinking once or less than once per month, no drinking). Depressive symptoms were assessed via the 10-item Center for Epidemiological Studies Depression Scale (CES-D-10) and a cut-off score ≥10 indicated the presence of depressive symptoms [35]. Body mass index (BMI) was calculated as weight (kg)/height2 (m2). Restriction on activities of daily living (ADL) was defined as having difficulty in any of the five ADL tasks (bathing, dressing, eating, getting into/out of bed and toileting) [33]. Information on blood urea nitrogen (BUN), fasting blood glucose (FBG), glycated haemoglobin (HbA1c), high-sensitivity C-reactive protein (hs-CRP) and total cholesterol was obtained through metabolic examination. Information on the medication history of hypertension, diabetes and kidney disease was collected via self-reports. Systolic blood pressure (SBP) and diastolic blood pressure (DBP) were measured three times for each participant and the mean value of these measurements was utilized for further analysis. The diagnosis of hypertension was established if participants exhibited an SBP/DBP ≥140/90 mmHg, were taking anti-hypertensive medication or had a self-reported physician diagnosis [36]. Diabetes was identified in individuals with an FBG level ≥7.0 mmol/l, an HbA1c ≥6.5%, the use of any glucose-lowering treatment or a self-reported physician diagnosis [37]. Stroke, kidney diseases, heart diseases, chronic lung diseases and cancer were ascertained by self-reported physician diagnosis. Muscle strength was evaluated based on handgrip strength, and grip strength was normalized to body weight, calculated as grip strength (kg)/body weight (kg) [38]. Finally, physical activity was evaluated among a randomly selected subsample of the study participants (2799 were available in subcohort 1, 1051 were available in sub-cohort 2) and was divided into four categories: ‘none’, ‘mild’, ‘moderate’ and ‘vigorous’, according to previous studies [3, 39].
Statistical analysis
Based on multiple repeated measurements (including baseline and three follow-up visits) of the cognitive scores, trajectories of global cognitive function were plotted over a 7-year follow-up time using group-based trajectory modelling (GBTM). Group-based multitrajectory modelling (GBMTM) was used to determine the jointly longitudinal changes in episodic memory and executive function across four visits. GBTM and GBMTM can identify clusters of individuals following similar change patterns through multiple visits using uni- and multivariables, respectively [3]. Varied models were fitted and we then selected the optimal number of distinct groups and trajectory shape parameters (e.g. linear, quadratic and cubic) based on Bayesian information criteria, Akaike's information criterion, average posterior probabilities of each trajectory group (≥0.70), odds of correct classification for all groups (≥5), adequate sample size in each trajectory group (>5% of the sample) and a degree of clinical interpretation [3, 40]. The best trajectories of cognition were the main outcomes in the first subcohort.
Baseline characteristics were expressed as mean (SD), median [interquartile range (IQR)] or number (percentage). Differences among groups (according to eGFRdiff categories, cognitive trajectories or incident MCR status) were compared using the chi-squared test or Fisher's exact test for categorical variables and one-way analysis of variance or Kruskal–Wallis test for continuous variables, as appropriate.
In subcohort 1, ordinal logistic regression models were used to assess the associations between baseline eGFRdiff (considered as both continuous and categorical variables) and 7-year cognitive trajectories. In subcohort 2, we used binary logistic regression models to assess longitudinal associations between eGFRdiff (considered as both continuous and categorical variables) and incident MCR over 4 years. Remarkably, among the 95 participants in the positive eGFRdiff group, there were no incidents of MCR events. Consequently, we combined the positive group and midrange group into a reference group for subsequent analysis of categorized eGFRdiff (negative group, with eGFRdiff <−15 ml/min/1.73 m2 versus the reference group, with eGFRdiff ≥−15 ml/min/1.73 m2), aiming to obtain robust results. The odds ratio (OR) and 95% confidence interval (CI) were obtained. We progressively adjusted the models for potential confounding factors. The final multivariable model was adjusted for age, gender, marital status, education level, residence, smoking status, drinking status, depressive symptoms, BMI, restriction on ADL, hypertension, diabetes, stroke, heart diseases, chronic lung diseases, cancer, total cholesterol, hs-CRP, medication history of kidney disease and hypertension, baseline global cognitive scores and normalized handgrip strength. The models were further adjusted for physical exercise in the subpopulations who underwent physical activity assessments. We also adjusted for eGFRcr to explore if the observed associations were independent of the most common measure of kidney function in current clinical practice. Then, the dose–response relationships of eGFRdiff with cognitive trajectories and MCR were evaluated using restricted cubic splines (RCSs) with three knots (at the 10th, 50th and 90th percentiles). Subsequently we explored whether the associations between eGFRdiff and study outcomes persisted among participants with normal kidney function (eGFR ≥60 ml/min/1.73 m2) or without self-reported kidney diseases.
Additionally, to gain a greater understanding of the association of eGFRdiff with cognition and MCR, we individually modelled the associations of baseline eGFRcys, eGFRcr an eGFRcys-cr with future cognitive trajectories and incident MCR. Next, we compared the associations of eGFR based on cystatin C versus creatinine with outcomes by including both eGFR values in the same multivariable-adjusted model. To further elucidate whether eGFRdiff could provide more accurate insights into the risk of cognitive decline and MCR than eGFRcys, eGFRcr or eGFRcys-cr alone, we performed discordance analysis using two approaches, as previously described [41, 42]. First, we defined discordance by the percentile distance between eGFRdiff and eGFR. Participants were classified into three groups: concordant (eGFRdiff percentile − eGFR percentile within ±15 percentile units), discordantly high eGFRdiff (eGFRdiff percentile > eGFR percentile by 15 percentile units) and discordantly low eGFRdiff (eGFRdiff percentile < eGFR percentile by 15 percentile units). Second, participants were divided into four groups with a focus on low levels (individuals with the 20% lowest levels) to assess the robustness of the results: both eGFRdiff and eGFR >20th percentile, eGFRdiff >20th percentile but eGFR ≤20th percentile, eGFRdiff ≤20th percentile but eGFR >20th percentile and both eGFRdiff and eGFR ≤20th percentile. The associations between eGFRdiff with eGFR concordant/discordant groups and cognitive trajectories and MCR were also estimated using the same models described above.
In the above analyses, an inverse probability weighting method was used to address potential selection bias [43]. A multivariable logistic regression model was created to obtain the probability of being included in the two subcohorts and model covariates were the same as those used in the primary analysis. The inverse of this probability was then used to create an analytical weight for each included participant. Absolute standardized mean differences were applied to verify the covariate balance between the included and excluded samples, using a Love plot selected for visualization [44].
Several sensitivity analyses were conducted to validate the study findings. First, we repeated our primary analysis based on the original unweighted samples. Second, we used the 2021 CKD-EPI race-free equations to recalculate eGFRs. Third, we repeated our analysis after excluding those with a history of CKD medication. Fourth, the generalized estimating equation (GEE) models were used to examine the longitudinal association between eGFRdiff and follow-up cognitive scores. Fifth, we investigated the associations of changes in eGFRdiff with cognitive trajectories and risk of developing MCR utilizing creatinine and cystatin C data collected at baseline in 2011 and a follow-up survey in 2015. Changes in eGFRdiff were calculated as the eGFRdiff values in 2015 minus those in 2011. The models were additionally adjusted for baseline eGFRdiff. Finally, we reassessed the relationship between eGFRdiff and study outcomes, adjusting for BUN, self-reported kidney diseases, CKD determined through eGFRcys or CKD determined through eGFRcys-cr instead of eGFRcr.
GBTM techniques were implemented using the Proc Traj in Stata version 15.1 (StataCorp, College Station, TX, USA). Other statistical analyses were performed with R version 4.1.0 (R Foundation for Statistical Computing, Vienna, Austria). A two-sided P-value <0.05 was considered statistically significant.
RESULTS
Estimated cognitive trajectories
The procedures for choosing the optimal group number and shape parameter for the final global cognitive trajectory model are presented in Supplementary Tables S1 and S2. We determined four clusters to reflect the heterogeneous pattern of longitudinal change in global cognitive function over 7 years (Fig. 1): group 1, ‘low-declining’ [n = 854 (13.30%)]; group 2, ‘moderate low-declining’ [n = 1382 (21.52%)]; group 3, ‘moderate high-stable’ [n = 2117 (32.96%)]; and group 4, ‘high-stable’ [n = 2070 (32.23%)]. The four groups showed a trend of increasingly better cognitive trajectories. Additionally, we also determined four groups using GBMTM that plotted the longitudinal joint changes in episodic memory and executive function based on the same criteria and procedure (Supplementary Fig. S4). Further details are shown in Supplementary Tables S3 and S4.
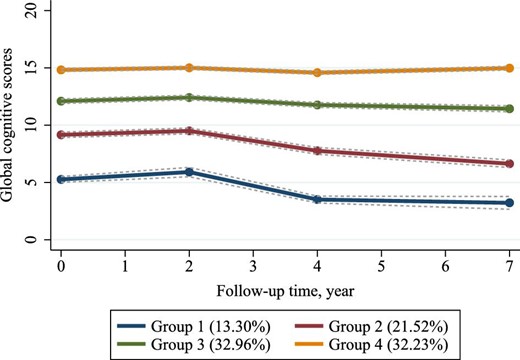
Trajectories of global cognitive function from 2011 to 2018 among 6423 participants. Descriptions of the four trajectory groups are as follows: group 1, ‘low-declining’ (13.30%); group 2, ‘moderate low-declining’ (21.52%); group 3, ‘moderate high-stable’ (32.96%); group 4, ‘high-stable’ (32.23%).
Baseline characteristics
The distribution of baseline characteristics is shown in Table 1. Supplementary Tables S5 and S6 show the detailed characteristics according to eGFRdiff groups. Among 6423 participants included in the first subcohort, the median age was 58.00 years (IQR 51.00–66.00) and 3025 (47.1%) were men. A total of 3175 (49.4%) participants had an eGFRdiff between −15 and 15 ml/min/1.73 m2 (midrange group, with eGFRcys similar to eGFRcr), 2915 (45.4%) participants had an eGFRdiff <−15 ml/min/1.73 m2 (negative group, with eGFRcys < eGFRcr) and 333 (5.2%) participants had an eGFRdiff of ≥15 ml/min/1.73 m2 (positive group, with eGFRcys > eGFRcr). Among 2477 participants included in the second subcohort, the median age was 65.00 years (IQR 61.00–71.00), 1243 (50.2%) were men and 121 (4.9%) developed incident MCR after 4 years of follow-up. A total of 1092 (44.1%) participants had a midrange eGFRdiff, 1290 (52.1%) had a negative eGFRdiff and 95 (3.8%) had a positive eGFRdiff. Compared with the other two eGFRdiff groups, participants in the negative eGFRdiff group tended to be older, experiencing depression, unmarried, male, smokers and from rural areas. Additionally, they had higher hs-CRP levels and lower educational levels, along with poorer cognitive performance. The characteristics of the population according to cognitive trajectory groups and incident MCR are presented in Supplementary Tables S7 and S8. Those who had worse cognitive trajectories or developed MCR were more likely to have lower eGFRdiff, eGFRcys, eGFRcr and eGFRcys-cr values than those with better cognitive performance or who did not develop MCR.
Baseline characteristics of the study population in two subcohorts.
| Characteristics | Subcohort 1 | Subcohort 2 |
|---|---|---|
| Participants, n | 6423 | 2477 |
| Age (years), median (IQR) | 58.00 (51.00–66.00) | 65.00 (61.00–71.00) |
| Male, n (%) | 3025 (47.1) | 1243 (50.2) |
| Married, n (%) | 5414 (84.3) | 1983 (80.1) |
| Rural residence, n (%) | 5114 (79.6) | 1993 (80.5) |
| Education level, n (%) | ||
| No formal education | 2875 (44.8) | 1348 (54.4) |
| Junior high school or below | 2797 (43.5) | 946 (38.2) |
| High school or above | 751 (11.7) | 183 (7.4) |
| Smoking status, n (%) | ||
| Non-smoker | 3915 (61.0) | 1432 (57.8) |
| Former smoker | 548 (8.5) | 235 (9.5) |
| Current smoker | 1960 (30.5) | 810 (32.7) |
| Drinking status, n (%) | ||
| > once a month | 1630 (25.4) | 639 (25.8) |
| ≤ once a month | 488 (7.6) | 158 (6.4) |
| None | 4305 (67.0) | 1680 (67.8) |
| Depressive symptoms, n (%) | 2378 (37.0) | 922 (37.2) |
| Restriction on ADL, n (%) | 291 (4.5) | 126 (5.1) |
| BMI (kg/m2), median (IQR) | 23.20 (20.85–25.92) | 22.80 (20.45–25.23) |
| Normalized grip strength, median (IQR) | 0.53 (0.43–0.65) | 0.52 (0.42–0.63) |
| Total cholesterol (mg/dl), median (IQR) | 190.21 (167.01–215.72) | 191.37 (166.62–216.50) |
| hs-CRP (mg/l), median (IQR) | 1.03 (0.55–2.12) | 1.11 (0.59–2.34) |
| Diabetes, n (%) | 1112 (17.3) | 463 (18.7) |
| Hypertension, n (%) | 2656 (41.4) | 1183 (47.8) |
| Stroke, n (%) | 120 (1.9) | 42 (1.7) |
| Heart-related diseases, n (%) | 835 (13.0) | 354 (14.3) |
| Chronic lung diseases, n (%) | 784 (12.2) | 359 (14.5) |
| Cancer, n (%) | 55 (0.9) | 21 (0.8) |
| Self-reported kidney diseases, n (%) | 424 (6.6) | 127 (5.1) |
| Use of antihypertensive agents, n (%) | 1282 (20.0) | 561 (22.6) |
| Medication history of kidney disease, n (%) | 217 (3.4) | 74 (3.0) |
| Global cognitive scores, median (IQR) | 12.00 (9.00–14.50) | 11.50 (8.00–14.00) |
| Serum cystatin C (mg/l), median (IQR) | 0.96 (0.85–1.11) | 1.03 (0.91–1.18) |
| Serum creatinine (mg/dl), median (IQR) | 0.76 (0.66–0.88) | 0.78 (0.67–0.92) |
| eGFRcys (ml/min/1.73 m2), median (IQR) | 79.34 (65.41–94.86) | 70.87 (57.89–84.4) |
| eGFRcr (ml/min/1.73 m2), median (IQR) | 94.54 (83.82, 102.48) | 89.30 (78.06, 95.88) |
| eGFRcys-cr (mL/min/1.73 m2), median (IQR) | 86.74 (74.89, 98.14) | 79.11 (68.11, 89.65) |
| eGFRdiff (ml/min/1.73 m2), median (IQR) | −13.24 (−23.56, −2.08) | −15.85 (−25.85, −5.04) |
| BUN (mg/dl), median (IQR) | 15.15 (12.55, 18.07) | 15.74 (13.08, 18.85) |
| Physical activity, n (%)a | ||
| None | 324 (11.6) | 129 (12.3) |
| Mild | 685 (24.5) | 285 (27.1) |
| Moderate | 855 (30.5) | 339 (32.3) |
| Vigorous | 935 (33.4) | 298 (28.4) |
| Outcome variables | ||
| Cognitive trajectories, n (%) | ||
| High-stable | 2070 (32.2) | – |
| Moderate high-stable | 2117 (33.0) | – |
| Moderate low-declining | 1382 (21.5) | – |
| Low-declining | 854 (13.3) | – |
| Incident MCR, n (%) | – | 121 (4.9) |
Assessed among 2799 participants in the first subcohort and 1051 participants in the second subcohort.
After inverse probability weighting to eliminate selection bias, the differences between included and excluded subjects were clearly smaller compared with the differences between the original unweighted samples (Fig. 2).
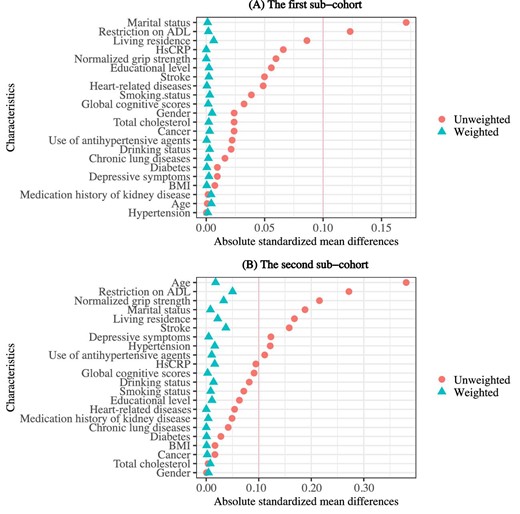
Differences in characteristics between included and excluded participants in two subcohorts. Love plots display the absolute standardized mean differences based on the original unweighted and inverse probability–weighted samples. (A) The Love plot for the first subcohort. (B) The Love plot for the second subcohort.
Association of eGFRdiff and eGFR with 7-year cognitive trajectories
The results of the adjusted ordinal logistic regression analyses are reported in Table 2. In model 1, each 1-SD higher eGFRdiff was associated with a lower risk of poorer global cognitive trajectories [OR 0.894 (95% CI 0.867–0.922)]. The association remained significant with adjustment for eGFRcr [OR 0.894 (95% CI 0.866–0.923)]. When considering eGFRdiff as a categorical variable, participants in the negative eGFRdiff group (eGFRcys < eGFRcr) had a higher risk of cognitive decline compared with the midrange group [OR 1.216 (95% CI 1.144–1.293)], whereas positive eGFRdiff (eGFRcys > eGFRcr) was correlated with reduced risk [OR 0.858 (95% CI 0.745–0.988)]. The above associations still hold after progressive adjustment for baseline cognitive scores (model 2), muscle strength (model 3) and physical activity (model 3 + physical activity, among 2799 participants, as shown in Supplementary Table S9), but the positive eGFRdiff was no longer significantly associated with global cognitive trajectories. A non-linear dose–response relationship between eGFRdiff and risk of poor cognitive trajectories was detected using the RCS model (for non-linearity, P = 0.001) (Fig. 3A). In addition, among those with normal eGFR (eGFRcys/eGFRcr/eGFRcys-cr ≥60 ml/min/1.73 m2) or without self-reported kidney diseases, eGFRdiff remained strongly and significantly associated with trajectories of cognition (Supplementary Table S10).
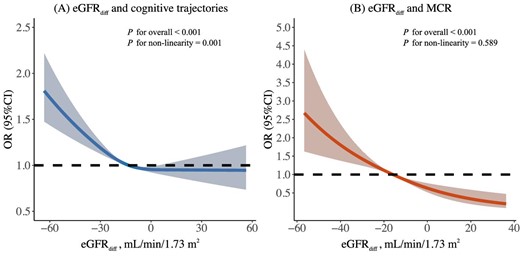
Dose–response relationship of eGFRdiff with poorer cognitive trajectories and MCR syndrome. The curve was estimated by a restricted cubic spline function with three knots (at the 10th, 50th and 90th percentiles). Model was adjusted for age, gender, marital status, education level, residence, smoking status, drinking status, depressive symptoms, BMI, restriction on ADL, hypertension, diabetes, stroke, heart disease, chronic lung disease, cancer, total cholesterol, hs-CRP, use of antihypertensive agents, medication history of kidney disease, global cognitive scores at baseline in 2011, muscle strength assessed by grip strength (normalized by body weight) and eGFRcr.
Longitudinal associations between eGFRdiff, other kidney function measures and global cognitive trajectories based on inverse probability–weighted samples.
| Model 1 | Model 2 | Model 3 | ||||
|---|---|---|---|---|---|---|
| Associations | OR (95% CI) | P-value | OR (95% CI) | P-value | OR (95% CI) | P-value |
| Difference between eGFRcys and eGFRcr | ||||||
| Continuous eGRFdiff (ml/min/1.73 m2) | ||||||
| Per SD increase | 0.894 (0.867–0.922) | <0.001 | 0.904 (0.872–0.937) | <0.001 | 0.909 (0.877–0.942) | <0.001 |
| Per SD increase (adjusted for eGFRcr) | 0.894 (0.866–0.923) | <0.001 | 0.885 (0.852–0.919) | <0.001 | 0.889 (0.856–0.923) | <0.001 |
| Categorical eGRFdiff (ml/min/1.73 m2) | ||||||
| Midrange (eGFRdiff −15–15) | Reference | Reference | Reference | |||
| Negative (eGFRdiff <−15) | 1.216 (1.144–1.293) | <0.001 | 1.216 (1.133–1.305) | <0.001 | 1.204 (1.121–1.292) | <0.001 |
| Positive (eGFRdiff ≥15) | 0.858 (0.745–0.988) | 0.035 | 0.933 (0.792–1.099) | 0.411 | 0.928 (0.787–1.093) | 0.373 |
| Cystatin C and creatinine-based kidney function measures | ||||||
| Continuous serum cystatin C (mg/l) | ||||||
| Per SD increase | 1.074 (1.040–1.110) | <0.001 | 1.121 (1.080–1.163) | <0.001 | 1.114 (1.074–1.156) | <0.001 |
| Per SD increase (adjusted for creatinine) | 1.120 (1.079–1.164) | <0.001 | 1.145 (1.099–1.194) | <0.001 | 1.138 (1.093–1.187) | <0.001 |
| Continuous eGFRcys (ml/min/1.73 m2) | ||||||
| Per SD increase | 0.913 (0.881–0.945) | <0.001 | 0.872 (0.837–0.908) | <0.001 | 0.874 (0.840–0.910) | <0.001 |
| Per SD increase (adjusted for eGFRcr) | 0.873 (0.840–0.908) | <0.001 | 0.862 (0.824–0.902) | <0.001 | 0.868 (0.829–0.908) | <0.001 |
| Continuous serum creatinine (mg/dl) | ||||||
| Per SD increase | 0.946 (0.911–0.983) | 0.004 | 1.007 (0.965–1.051) | 0.749 | 1.024 (0.985–1.065) | 0.235 |
| Per SD increase (adjusted for cystatin C) | 0.896 (0.859–0.934) | <0.001 | 0.942 (0.898–0.988) | 0.013 | 0.956 (0.914–1.001) | 0.054 |
| Continuous eGFRcr (ml/min/1.73 m2) | ||||||
| Per SD increase | 1.067 (1.030–1.106) | <0.001 | 0.975 (0.935–1.016) | 0.228 | 0.969 (0.930–1.010) | 0.141 |
| Per SD increase (adjusted for eGFRcys) | 1.102 (1.060–1.146) | <0.001 | 1.024 (0.978–1.072) | 0.310 | 1.017 (0.972–1.065) | 0.466 |
| Continuous eGRFcys-cr (ml/min/1.73 m2) | ||||||
| Per SD increase | 0.979 (0.944–1.015) | 0.240 | 0.897 (0.86–0.935) | <0.001 | 0.896 (0.859–0.934) | <0.001 |
| Per SD increase (adjusted for eGFRcr) | 0.854 (0.809–0.901) | <0.001 | 0.819 (0.769–0.871) | <0.001 | 0.824 (0.774–0.878) | <0.001 |
| Per SD increase (adjusted for eGFRcys) | 1.333 (1.216–1.462) | <0.001 | 1.052 (0.945–1.171) | 0.356 | 1.035 (0.930–1.153) | 0.527 |
Model 1: adjusted for age, gender, marital status, education level, residence, smoking status, drinking status, depressive symptoms, BMI, restriction on ADL, hypertension, diabetes, stroke, heart disease, chronic lung disease, cancer, total cholesterol, hs-CRP, use of antihypertensive agents and medication history of kidney disease. Model 2: further adjusted for global cognitive scores at baseline in 2011. Model 3: further adjusted for muscle strength assessed by grip strength (normalized by body weight).
Significant values in bold.
For three GFR estimates (Table 2), higher eGFRcys [OR 0.874 (95% CI 0.840–0.910)] and eGFRcys-cr [OR 0.896 (95% CI 0.859–0.934)] rather than eGFRcr [OR 0.969 (95% CI 0.930–1.010)] were significantly associated with a lower risk of global cognitive decline after full adjustment for covariates. We also observed significant associations of higher levels of serum cystatin C [OR 1.114 (95% CI 1.074–1.156)], but not creatinine [OR 1.024 (95% CI 0.985–1.065)], with worse global cognitive trajectories. The above associations remained after additional adjustment for eGFRcr or serum creatinine. Notably, when we further adjusted for eGFRcys instead of eGFRcr, eGFRcys-cr was no longer associated with global cognitive trajectories.
Finally, consistent results were obtained when using joint progression trajectories of episodic memory and executive function as outcome variables (Supplementary Table S11).
Association of eGFRdiff and eGFR with 4-year MCR onset risk
In the fully multivariable-adjusted model (model 3), each 1-SD higher eGFRdiff was associated with a 25.3% (95% CI 16.6–33.2) decreased risk of MCR (Table 3). The association remained robust after inclusion of eGFRcr in all adjusted models [OR 0.651 (95% CI 0.574–0.736)]. Compared with those with eGFRdiff ≥−15 ml/min/1.73 m2, participants in the negative eGFRdiff group, with eGFRdiff <−15 ml/min/1.73 m2, had a 1.412-fold (95% CI 1.151–1.739) greater risk of incident MCR. These findings still held after additional adjustment for physical activity among 1051 participants with physical activity assessments (Supplementary Table S9). The spline function for eGFRdiff confirmed a linear dose–response relationship between eGFRdiff and the risk of developing MCR (for non-linearity, P = 0.589) (Fig. 3B). There was still a significant association between eGFRdiff and MCR among participants without self-reported kidney diseases or with normal eGFR assessed by serum cystatin C, creatinine or their combination (Supplementary Table S10).
Longitudinal associations between eGFRdiff, other kidney function measures and MCR syndrome based on inverse probability–weighted samples.
| Model 1 | Model 2 | Model 3 | ||||
|---|---|---|---|---|---|---|
| Associations | OR (95% CI) | P-value | OR (95% CI) | P-value | OR (95% CI) | P-value |
| Difference between eGFRcys and eGFRcr | ||||||
| Continuous eGRFdiff, mL/min/1.73 m2 | ||||||
| Per SD increase | 0.724 (0.649–0.808) | <0.001 | 0.728 (0.652–0.813) | <0.001 | 0.747 (0.668–0.834) | <0.001 |
| Per SD increase (adjusted for eGFRcr) | 0.636 (0.563–0.718) | <0.001 | 0.641 (0.566–0.724) | <0.001 | 0.651 (0.574–0.736) | <0.001 |
| Categorical eGRFdiff (ml/min/1.73 m2) | ||||||
| Reference (eGFRdiff ≥−15) | Reference | Reference | Reference | |||
| Negative (eGFRdiff <−15) | 1.485 (1.213–1.824) | <0.001 | 1.464 (1.196–1.799) | <0.001 | 1.412 (1.151–1.739) | 0.001 |
| Cystatin C and creatinine-based kidney function measures | ||||||
| Continuous serum cystatin C (mg/l) | ||||||
| Per SD increase | 1.477 (1.365–1.597) | <0.001 | 1.471 (1.359–1.592) | <0.001 | 1.480 (1.365–1.604) | <0.001 |
| Per SD increase (adjusted for creatinine) | 1.574 (1.419–1.744) | <0.001 | 1.569 (1.414–1.740) | <0.001 | 1.559 (1.402–1.731) | <0.001 |
| Continuous eGFRcys (ml/min/1.73 m2) | ||||||
| Per SD increase | 0.603 (0.533–0.682) | <0.001 | 0.606 (0.534–0.685) | <0.001 | 0.603 (0.531–0.684) | <0.001 |
| Per SD increase (adjusted for eGFRcr) | 0.580 (0.500–0.671) | <0.001 | 0.585 (0.504–0.678) | <0.001 | 0.596 (0.513–0.692) | <0.001 |
| Continuous serum creatinine (mg/dl) | ||||||
| Per SD increase | 1.242 (1.135–1.356) | <0.001 | 1.240 (1.132–1.353) | <0.001 | 1.262 (1.152–1.379) | <0.001 |
| Per SD increase (adjusted for cystatin C) | 0.898 (0.800–1.006) | 0.066 | 0.896 (0.797–1.006) | 0.065 | 0.916 (0.814–1.030) | 0.144 |
| Continuous eGFRcr (ml/min/1.73 m2) | ||||||
| Per SD increase | 0.822 (0.743–0.912) | <0.001 | 0.819 (0.739–0.909) | <0.001 | 0.799 (0.720–0.888) | <0.001 |
| Per SD increase (adjusted for eGFRcys) | 1.062 (0.941–1.200) | 0.331 | 1.055 (0.933–1.194) | 0.395 | 1.019 (0.901–1.153) | 0.766 |
| Continuous eGRFcys-cr (ml/min/1.73 m2) | ||||||
| Per SD increase | 0.664 (0.593–0.743) | <0.001 | 0.664 (0.592–0.744) | <0.001 | 0.654 (0.582–0.734) | <0.001 |
| Per SD increase (adjusted for eGFRcr) | 0.499 (0.411–0.605) | <0.001 | 0.504 (0.414–0.613) | <0.001 | 0.516 (0.423–0.629) | <0.001 |
| Per SD increase (adjusted for eGFRcys) | 1.171 (0.839–1.636) | 0.355 | 1.150 (0.816–1.624) | 0.427 | 1.047 (0.738–1.489) | 0.796 |
Model 1: adjusted for age, gender, marital status, education level, residence, smoking status, drinking status, depressive symptoms, BMI, restriction on ADL, hypertension, diabetes, stroke, heart disease, chronic lung disease, cancer, total cholesterol, hs-CRP, use of antihypertensive agents and medication history of kidney disease. Model 2: further adjusted for global cognitive scores at baseline in 2011. Model 3: further adjusted for muscle strength assessed by grip strength (normalized by body weight).
Significant values in bold.
In addition, higher serum cystatin C and creatinine and lower eGFRcys, eGFRcr and eGFRcys-cr were all associated with elevated MCR risk when modelled individually in multivariable-adjusted models. However, when eGFRcys and eGFRcr or cystatin C and creatinine were both included in the same multivariable-adjusted model, only eGFRcys [OR 0.596 (95% CI 0.513–0.692)] and cystatin C [OR 1.559 (95% CI 1.402–1.731)] were significantly correlated with incident MCR (Table 3). We did not observe a significant association between eGFRcys-cr and MCR after adjusting for eGFRcys rather than eGFRcr in our multivariable models.
Discordance analysis of eGFRdiff and eGFR
As displayed in Fig. 4, compared with the concordant group, the discordantly high eGFRdiff had a significant decreased risk of poorer cognitive trajectories [OR for discordant eGFRdiff/eGFRcys 0.853 (95% CI 0.752–0.968); OR for discordant eGFRdiff/eGFRcr 0.861 (95% CI 0.781–0.950); OR for discordant eGFRdiff/eGFRcys-cr 0.778 (95% CI 0.693–0.873)] and discordantly low eGFRdiff had the opposite association, i.e. an increased risk. Analogously, we also found that discordantly high eGFRdiff was associated with a decreased risk of developing MCR [OR for discordant eGFRdiff/eGFRcys 0.485 (95% CI 0.335–0.696); OR for discordant eGFRdiff/eGFRcr 0.651 (95% CI 0.485–0.872); OR for discordant eGFRdiff/eGFRcys-cr 0.526 (95% CI 0.377–0.731)]. However, we did not observe a significant association between discordantly low eGFRdiff and incident MCR.
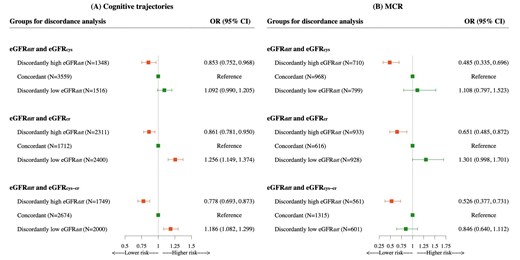
Associations of discordance between eGFRdiff and eGFRcys, eGFRcr or eGFRcys-cr with cognitive trajectories and MCR syndrome based on the percentile distance between eGFRdiff and eGFR. In this discordance analysis, individuals were divided into three groups according to the percentile distance between eGFRdiff and eGFRcys, eGFRcr or eGFRcys-cr. ORs and 95% CIs were from ordinal and binary logistics regression with multivariable adjustment for age, gender, marital status, education level, residence, smoking status, drinking status, depressive symptoms, BMI, restriction on ADL, hypertension, diabetes, stroke, heart disease, chronic lung disease, cancer, total cholesterol, hs-CRP, medication history of hypertension, kidney disease, global cognitive scores at baseline in 2011, grip strength (normalized by body weight) and eGFRcr. Orange means statistically significant, green means not statistically significant.
We redefined discordance and divided the population into four groups to assess the robustness of our findings. Compared with individuals with both eGFRdiff and eGFR (eGFRcys/eGFRcr/eGFRcys-cr) >20th percentile, those with ‘only eGFRdiff ≤20th percentile’, but not ‘only eGFR ≤20th percentile’ had significantly higher risks of a decline in cognitive function and MCR (Supplementary Figure S5).
Sensitivity analyses
Our findings were not substantially changed after conducting the primary analysis using the original unweighted samples (Supplementary Tables S12 and S13). The results from our analyses were also unaffected by re-estimating the GFR values using the 2021 CKD-EPI race-free equations (Supplementary Tables S14 and S15) or excluding participants with a history of CKD medication (Supplementary Tables S16 and S17). Moreover, the associations of eGFRdiff and other kidney function measures with cognitive function based on GEE models are shown in Supplementary Tables S18 and S19. Each 1-SD eGFRdiff increment was significantly associated with an increase in global cognitive scores [β = 0.134 (95% CI 0.068–0.200)]. In addition, we also assessed the associations of changes in eGFRdiff with cognitive trajectories and MCR. Subcohort 1 and subcohort 2 included 4539 and 2093 participants, respectively, who had available eGFRdiff data in 2011 and 2015, and we calculated the 4-year change in eGFRdiff for analysis. As shown in Supplementary Table S20, we found that greater increases in eGFRdiff during the follow-up period were associated with a reduced risk of cognitive decline [OR 0.913 (95% CI 0.866–0.963)] and incident MCR [OR 0.815 (95% CI 0.698–0.950)]. Finally, adjusting for BUN, self-reported kidney diseases, CKD based on eGFRcys or eGFRcys-cr rather than eGFRcr in our multivariable models revealed that eGFRdiff remained independently associated with cognitive trajectories and incident MCR (Supplementary Table S21).
DISCUSSION
Based on a nationally representative longitudinal cohort study, our findings revealed for the first time a significant association of intraindividual eGFRdiff with future cognitive trajectories and MCR. Higher eGFRdiff (value for eGFRcys − eGFRcr) was strongly associated with a lower risk of poorer cognitive trajectories and incident MCR, independent of demographics and clinical factors including kidney function measures, even in individuals with normal kidney function. Furthermore, we found that eGFRcys appeared to provide more information regarding the risk for cognitive decline and MCR than eGFRcr. Finally, discordance analyses indicated that those with discordantly low eGFRdiff/high eGFR but not high eGFRdiff/low eGFR had a higher risk of worse cognitive trajectories and MCR. The eGFRdiff could serve as the more reliable indicator to identify the risk for cognitive decline and pre-dementia symptoms.
Impaired kidney function has been increasingly recognized as a potential risk factor for cognitive dysfunction and dementia [12, 17, 45]. Our study examined the long-term dynamic trajectories of cognitive performance rather than relying on dichotomized cognition status, and also considered MCR, a pre-dementia syndrome. We added the first prospective evidence concerning the association of kidney function measures using cystatin C, creatinine or their combination with cognitive trajectories and incident MCR. Additionally, we also tested the associations of kidney diseases determined via self-report and BUN with the study outcomes. We found that individuals who self-reported kidney diseases exhibited a higher risk of cognitive decline [OR 1.290 (95% CI 1.060–1.572)] and MCR [OR 4.114 (95% CI 2.116–7.675)]. Higher BUN levels were also significantly associated with an increased risk of MCR [OR 1.041 (95% CI 1.004–1.079)]. Kidney dysfunction can contribute to cognitive decline and MCR through various mechanisms, such as uraemic toxin accumulation, increased oxidative stress, uraemia-related neuroinflammation, compromised blood–brain barrier and neurotransmitter dysregulation, which may exert direct detrimental effects on the central nervous system [46, 47]. Impaired kidney function may also potentially influence neurodegenerative changes by affecting beta-amyloid clearance [47]. Notably, both our study and previous research demonstrated a stronger link between eGFRcys and cognitive-related outcomes compared with eGFRcr and eGFRcys-cr [17]. This could be attributed to non-kidney factors, such as muscle mass and diet, that confound their association, and these factors may have a tight bond with cognitive function. The differential influence of non-kidney factors on the levels of cystatin C and creatinine is commonly observed as large differences between eGFRcys and eGFRcr within the same individual [19]. Nevertheless, the clinical information carried by these differences has been mostly overlooked in prior studies. Thus our study provided the first evidence that intraindividual eGFRdiff is associated with the future trajectory of cognition and risk of MCR, and these associations were independent of kidney function measurements based on cystatin C, creatinine or their combination, as well as self-reported kidney disease and BUN. We also confirmed that eGFR can still convey risk information for cognitive decline and MCR, even in individuals with normal kidney function. Our study underscores the clinical value of eGFRdiff beyond routine kidney function measurements.
There are several plausible biologic mechanisms to explain the observed associations. On the one hand, the influence exerted by some non-GFR factors on creatinine levels appears to be more significant than that on cystatin C levels [48], with muscle mass being a particularly notable factor. Individuals with lower muscle mass may exhibit reduced levels of serum creatinine, leading to a possible overestimation of eGFRcr and subsequent lower eGFRdiff. Thus the lower negative eGFRdiff could indicate potential sarcopenia [25], and sarcopenia was proposed as a risk factor for cognitive impairment [49]. However, our results remained robust after additional adjustment for muscle strength in our analyses. Additionally, physical activity, nutritional factors and health status also influence creatinine production, whereas the impact on cystatin C is comparatively negligible, leading to a large eGFRdiff. These non-kidney factors may all influence cognitive function. On the other hand, some non-kidney factors may originate from cystatin C, such as diabetes, obesity and inflammation [48]. Nevertheless, the magnitude of the associations between these factors and serum cystatin C levels is weaker than that between non-kidney factors and serum creatinine [18, 19, 48]. In our study, we confirmed that these associations are independent of diabetes, BMI and hs-CRP. Besides non-kidney determinants, shrunken pore syndrome (SPS), characterized by a low eGFRcys:eGFRcr ratio can also be a possible explanation [28, 50]. SPS has been reported to be related to the accumulation of atherosclerosis-promoting proteins, such as pro-inflammatory cytokines, and increased mortality [20, 50, 51]. The SPS theory explains to some extent the links between eGFRdiff and some vascular system dysfunction-related diseases, as supported by several studies reporting associations between eGFRdiff and adverse cardiovascular outcomes [19, 20]. Vascular system dysfunction is regarded as a well-established risk factor for cognitive impairment. Thus we inferred that SPS may negatively impact vascular function by promoting atherosclerosis, potentially resulting in cognitive decline and MCR. Finally, based on baseline characteristics (Supplementary Tables S5 and S6), individuals with negative eGFRdiff tended to be older. Aging is considered the primary cause of cognitive decline and MCR [52, 53], which may also be a plausible explanation for these associations. Nevertheless, all multivariate models were adjusted for age, effectively controlling for its influence. This indicates that adjustment for age does not affect the clinical value of eGFRdiff in assessing the risks.
There is growing acknowledgement that substantial differences between eGFRcys and eGFRcr can convey risk information for various adverse clinical outcomes. Previous studies have established that higher eGFRdiff was associated with a lower risk of frailty, injurious falls, cardiovascular diseases, end-stage kidney disease and mortality, and the associations remained significant across categories of eGFR [18–20, 23, 25]. Our study similarly demonstrated that eGFRdiff can inform individuals with normal kidney function about their risk for cognitive decline and incident MCR. We further performed discordance analysis and highlighted that the eGFRdiff can embed more important clinical insights related to cognitive function over eGFR based on cystatin C, creatinine or their combination. With the growing utilization of cystatin C in clinical settings, clinicians can simultaneously obtain both cystatin C and creatinine levels. Our study sheds light on optimizing the utilization of these markers to improve clinical practice. Despite the fact that using the combination of cystatin C and creatinine is more accurate than either marker alone for estimating GFR [21, 22], relying solely on eGFRcys-cr may be insufficient in capturing the complete risk information for cognitive impairment and MCR. Evaluating intraindividual eGFRdiff should continue to be strongly emphasized in clinical practice.
Strengths and limitations
To our knowledge, this is the first study to comprehensively reveal the longitudinal associations of eGFRdiff and kidney function measures based on creatinine or cystatin C with long-term cognitive trajectories and incident MCR, and we conducted multiple sensitivity analyses to confirm the robustness of our results. Our findings underscore the potential clinical value of eGFRdiff over eGFRcys, eGFRcr and eGFRcys-cr alone, which may optimize the risk assessment and clinical management of cognitive impairment and MCR. However, several limitations also exist in our research. First, our study included only a Chinese population. This might restrict the generalization to other races and ethnicities. However, we applied race-free equations to re-estimate eGFR to verify our conclusion. Second, although we adjusted for several potential confounders, other unmeasured or residual confounders may still affect our findings. Furthermore, we used a relatively simple and limited assessment tool for cognitive function, which lacked the cut-off values of cognitive impairment, but the moderate–high validity of this test was reported compared with the Mini-Mental State Examination and the Clinical Dementia Rating Scale [54]. Finally, we included measurements of kidney function using cystatin C, creatinine, calculated eGFR, BUN and self-reported kidney disease. However, we did not collect data on albuminuria or other CKD-related indicators. This limitation could potentially affect a more accurate assessment of CKD.
CONCLUSIONS
This longitudinal study indicated that intraindividual differences between eGFRcys and eGFRcr were associated with long-term cognitive trajectories and incident MCR among middle-aged and older adults. The eGFRdiff could convey additional valuable information regarding the risk of cognitive decline and MCR beyond eGFRcys, eGFRcr or eGFRcys-cr, which should be considered in clinical translation. Monitoring eGFRdiff may provide significant clinical utility for the early prevention of cognitive impairment and MCR, thus promoting healthy aging.
ACKNOWLEDGEMENTS
The National School of Development at Peking University provided the data in the China Health and Retirement Longitudinal Survey. We thank the staff of the China Health and Retirement Longitudinal Study team for their invaluable contributions.
FUNDING
Our work was funded by the National Natural Science Foundation of China (82073668 and 81872708 to L.T.). The funder had no role in the design and conduct of the study; in the collection, analysis and interpretation of the data; or in the preparation, review or approval of the manuscript. Each participant included in this study signed a written informed consent form before taking the survey. Ethical approval for all the CHARLS waves was granted from the Institutional Review Board (IRB) at Peking University. The IRB approval number for the main household survey, including anthropometrics, is IRB00001052-11015.
AUTHORS’ CONTRIBUTIONS
J.W., X.G. and L.T. contributed to the study conception and design. J.W., Z.W., Z.H. and Z.X. contributed to the data collection. J.W., Y.L., R.J. and X.Z. contributed to the data analysis and interpretation. J.W., Y.L., and L.T. contributed to manuscript writing and reviewing. X.G. and L.T. contributed to study supervision.
DATA AVAILABILITY STATEMENT
The data that support the findings of this study are available in China Health and Retirement Longitudinal Study (http://charls.pku.edu.cn/). Materials are available upon request to the corresponding author.
CONFLICT OF INTEREST STATEMENT
The authors declare that they have no competing interests.


Comments