


ABSTRACT
Dysregulated energy metabolism is a recently discovered key feature of autosomal dominant polycystic kidney disease (ADPKD). Cystic cells depend on glucose and are poorly able to use other energy sources such as ketone bodies. Raising ketone body concentration reduced disease progression in animal models of polycystic kidney diseases. Therefore, we hypothesized that higher endogenous plasma beta-hydroxybutyrate (BHB) concentrations are associated with reduced disease progression in patients with ADPKD.
We analyzed data from 670 patients with ADPKD participating in the Developing Intervention Strategies to Halt Progression of ADPKD (DIPAK) cohort, a multi-center prospective observational cohort study. BHB was measured at baseline using nuclear magnetic resonance spectroscopy. Participants were excluded if they had type 2 diabetes, were using disease-modifying drugs (e.g. tolvaptan, somatostatin analogs), were not fasting or had missing BHB levels, leaving 521 participants for the analyses. Linear regression analyses were used to study cross-sectional associations and linear mixed-effect modeling for longitudinal associations.
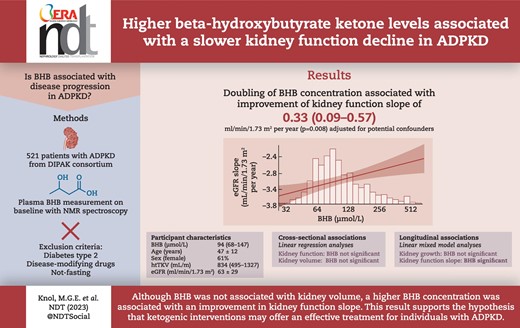
Of the participants, 61% were female, with an age of 47.3 ± 11.8 years, a height-adjusted total kidney volume (htTKV) of 834 [interquartile range (IQR) 495–1327] mL/m and an estimated glomerular filtration rate (eGFR) of 63.3 ± 28.9 mL/min/1.73 m2. The median concentration of BHB was 94 (IQR 68–147) µmol/L. Cross-sectionally, BHB was associated neither with eGFR nor with htTKV. Longitudinally, BHB was positively associated with eGFR slope {B = 0.35 mL/min/1.73 m2 [95% confidence interval (CI) 0.09 to 0.61], P = .007}, but not with kidney growth. After adjustment for potential confounders, every doubling in BHB concentration was associated with an improvement in the annual rate of eGFR by 0.33 mL/min/1.73 m2 (95% CI 0.09 to 0.57, P = .008).
These observational analyses support the hypothesis that interventions that raise BHB concentration could reduce the rate of kidney function decline in patients with ADPKD.
 Watch the video of this contribution at
 What was known:
- •
Autosomal dominant polycystic kidney disease (ADPKD) is characterized by a dysregulated metabolism. Intervening in this dysregulated metabolism by ketogenic interventions reduced the rate of disease progression in PKD animal models. The concentration of beta-hydroxybutyrate (BHB), a ketone body, increases during ketogenic interventions.
This study adds:
- •
The is the first large-scale epidemiological study investigating the association of BHB with kidney function decline in patients with ADPKD.
- •
It shows that even mildly elevated levels of BHB are associated with less kidney function decline in patients with ADPKD.
Potential impact:
- •
Emerging animal data show that ketogenic interventions are protective in ADPKD. This observational study in a large cohort of patients with ADPKD suggests that even a small increase in BHB may already have a positive effect on disease progression. These data warrant intervention trials.
INTRODUCTION
Autosomal dominant polycystic kidney disease (ADPKD) is the most common genetic kidney disease, characterized by cyst growth in both kidneys. The progressive cyst growth leads to kidney function decline, and in most patients to end-stage kidney disease around the age of 60 years [1]. It is estimated that approximately 10% of all patients requiring dialysis or kidney transplantation have ADPKD as an underlying disease [2]. Currently, there is only one treatment option for reducing disease progression, tolvaptan, a vasopressin V2 receptor antagonist [3]. However, there is important residual disease progression when using this drug and tolvaptan use can lead to aquaretic side-effects such as polyuria, limiting its feasibility for many patients. Therefore, exploring other mechanisms that may be involved with disease progression is vital because of the potential to develop novel ways to treat ADPKD.
It was recently discovered that ADPKD cells have dysregulated glucose metabolism, suggesting that these cells mainly depend on glucose and aerobic glycolysis [4]. Therefore, they inefficiently use other energy metabolites, such as ketone bodies. Ketone bodies are formed by the liver when low glucose levels stimulate glucagon secretion and reduce insulin secretion, such as during fasting, a ketogenic diet or long-lasting exercise [5]. Increasing ketogenesis is thought to reduce disease progression by lowering glucose availability, which could reduce cyst growth, and by influencing signaling pathways. In experimental studies, ketogenic interventions successfully reduced disease progression in polycystic kidney disease animal models, possibly by lowering glucose availability in renal tubular cells and by reducing mammalian target of rapamycin (mTOR) signaling [6, 7]. mTOR is an important energy-sensing protein known to be upregulated in ADPKD and to stimulate cyst proliferation [8].
A ketogenic state enables the influx of free fatty acids into the liver, where the three main ketone bodies are synthesized: beta-hydroxybutyrate (BHB), acetoacetate and acetone [5]. BHB can suppress oxidative stress, diminish fibrosis and reduce inflammation, which could contribute to reducing disease progression in ADPKD [9–12]. BHB is the most abundant and stable ketone body and can be measured reliably using nuclear magnetic resonance (NMR) spectroscopy [13].
This study aims to investigate the association of BHB with disease severity and progression in a prospective cohort of patients with ADPKD, as it is unknown whether the findings in experimental studies have clinical relevance. We hypothesize that higher plasma BHB concentration is associated with less disease progression.
MATERIALS AND METHODS
Study design and study population
Data from the Developing Intervention Strategies to Halt Progression of ADPKD (DIPAK) observational cohort study was used for the current study. The DIPAK study was designed to investigate disease course in an unselected ADPKD patient population. Data were collected at four University Medical Centers in The Netherlands, in Groningen, Leiden, Nijmegen and Rotterdam. The cohort currently comprises 670 patients with ADPKD, with a current median follow-up of 4 years. Inclusion criteria were having ADPKD according to the modified Ravine criteria [14], age ≥18 years, and an estimated glomerular filtration rate (eGFR) ≥15 mL/min/1.73 m2.
For the present study participants with missing BHB levels (n = 38), who were not fasting or had unknown fasting status (n = 36), and subjects with extremely high or low BHB values [more than three times the standard deviation (SD) above or below the mean log-transformed variable, n = 4] were excluded. Moreover, patients were excluded who during follow-up started disease-modifying drugs (e.g. somatostatin analogs or vasopressin V2 receptor antagonists, n = 56), or who developed type 2 diabetes [hemoglobin A1c (HbA1c) >53 mmol/mol or fasting glucose >7 mmol/L, n = 15], because this may affect the rate of disease progression. In total, 521 participants were used for the current analyses.
The DIPAK observational study was approved by the Institutional Review Board of the University Medical Center Groningen (METC: 2013/040). It was conducted in adherence with the International Conference on Harmonization Good Clinical Practice guidelines. Written informed consent was obtained from all participants.
Measurements
Before each study visit, patients were fasted from midnight onward. Blood and 24-h urine samples were collected during the visit for immediate, routine biochemistry and PKD mutation analysis and biobanked for later analyses. In addition, blood pressure, body weight and height were measured. Copeptin was measured as a surrogate for vasopressin using a sandwich immunoassay (Thermo Fisher Scientific, Berlin, Germany). Glucagon was measured using a sandwich enzyme-linked immunosorbent assay (ELISA; Mercodia A/S, Uppsala, Sweden), which was previously described in detail [15]. Serum creatinine was measured using an isotope dilution mass spectrometry traceable enzymatic method. The estimated glomerular filtration rate (eGFR) was calculated using the 2009 creatinine-based Chronic Kidney Disease Epidemiology Collaboration equation [16]. Details for the leucine measurement are reported elsewhere [17]. Body mass index (BMI) was calculated by dividing body weight in kilograms by squared body height in meters. Magnetic resonance imaging (MRI) was performed at baseline and every 3 years to assess total kidney volume (TKV), using a standardized protocol. Of the 521 included patients, there were 491 MRIs at baseline, 337 MRIs at Year 3 and 116 MRIs at Year 6 available for TKV measurement. TKV was measured by trained reviewers blinded to the patient's identity using semi-automated segmentation and a validated deep-learning approach [18, 19]. The height-adjusted TKV (htTKV) was calculated by dividing the TKV by height in meters. Patients were classified using the Mayo Clinic Classification based on their age-indexed htTKV value, as previously described [20]. Salt intake was calculated as 24-h sodium excretion, and protein intake was estimated by the method of Maroni et al. [21] by the following formula: protein intake = [urea excretion (mmol) × 0.028 + 0.031 × body weight (kg)] × 6.25.
BHB measurement
Plasma BHB was measured using a Vantera Clinical Analyzer (Labcorp), a fully automated, high-throughput, 400 MHz proton (1H) NMR spectroscopy platform [22]. The NMR-based assay quantifies BHB with a mean inter-assay coefficient of variation (%CV) of 5.8 and a mean intra-assay %CV of 5.2. The long-term stability of BHB after 6 years is good (<1.5% bias) [13].
Statistical analyses
We used R studio version 4.0.5 (Vienna, Austria) for the statistical analyses. A two-sided P-value <.05 was considered statistically significant.
We used the mean ± SD for normally distributed quantitative variables, the median and interquartile range (IQR) for non-normally distributed quantitative variables, and frequencies and percentages for categorical variables. All non-normally distributed variables were log2 transformed to meet the assumptions for linear regression and linear mixed model analyses. Extreme outliers were defined as three times above or below the SD of the (log-transformed) variable and were removed from the analyses [23]. In case of missing data, cases were removed listwise.
The baseline characteristics were stratified for sex-adjusted quartiles of BHB because BHB concentration is slightly elevated in women compared with men [24]. Group differences were determined using the one-way ANOVA for normally distributed variables, the Kruskal–Wallis test for non-normally distributed variables and the Chi-Square test for categorical variables.
To investigate what influences the plasma BHB concentration in the ADPKD population and could therefore be a possible confounder during subsequent analyses, we performed univariable linear regression analyses with variables of interest based on literature: sex, age, alcohol use, glucagon, glucose, copeptin, HbA1c, use of beta-blockers, systolic blood pressure (SBP) and BMI [5, 13, 24–31]. For continuous variables, the presence of non-linear relationships with BHB concentration was investigated by adding the squared variable to the regression analysis. In the next model, these associations were adjusted for age and sex. Subsequently, the stepwise backward model included all variables associated with BHB with a P-value of <.1 after adjustment for sex and age. Then the variables were excluded stepwise when the P-value was >.05. The variables sex and age remained in the final stepwise backward analysis, regardless of significance.
We examined whether BHB was cross-sectionally associated with kidney function and volume, both crude and after adjustment for potential confounders. We adjusted for confounders that are known to influence disease progression or can influence the BHB concentration [1, 27, 31]. eGFR and htTKV were the dependent variables, and BHB was the independent variable (crude model). Next, we adjusted for potential confounders: sex, age (Model 1); Model 1 plus plasma copeptin (Model 2); Model 2 plus SBP and PKD mutations (Model 3). The standard assumptions of linear regression (linearity, homoscedasticity and normal distribution of residuals) were evaluated for every model.
We investigated whether BHB was associated with kidney function over time and kidney growth using linear mixed-effects models for the longitudinal analyses. All participants included had at least two available eGFR and htTKV values. Slope and intercept were allowed to vary randomly with an unstructured covariance structure. Random effects were time and participants. Fixed effects were BHB levels, time and the interaction of BHB with time. We adjusted for the same potential confounders as in the cross-sectional analyses by adding the variables and their interaction with time. The added covariates were measured at baseline. For htTKV, the annual percentage growth in htTKV can be calculated by taking the antilog of the estimated derived.
We assessed the univariable associations between independent variables of interest and each of the dependent variables (eGFR baseline, htTKV baseline, eGFR slope and htTKV growth; Supplementary data, Table S1). Most variables were univariably significantly associated with the dependent variables. If they were not significantly associated, they were still added to the model because of literature evidence of influencing disease progression [1, 27, 31]. A correlation matrix and plot were made, which showed no multicollinearity (Supplementary data, Fig. S1).
Subgroup analyses were performed to study the association between BHB and eGFR slope to assess the robustness across different subgroups. The estimate of BHB was calculated using linear mixed-effects models in the different subgroups. The P for interaction was calculated by adding to the model an interaction term between the subgroup, BHB and time. The associations were adjusted for potential confounders, sex, age, copeptin, SBP and PKD mutations.
RESULTS
Baseline characteristics
Baseline characteristics of the overall cohort of 521 patients with ADPKD and according to sex-stratified quartiles of baseline BHB are shown in Table 1. Women had higher BHB levels than men [101 (IQR 72–161) µmol/L versus 87 (IQR 65–131) µmol/L, P = .004]. The median BHB concentration was 94 (IQR 68–147) µmol/L, and the mean eGFR was 63.3 ± 28.9 mL/min/1.73 m2. The mean age of the participants was 47.3 ± 11.8 years, and 61.0% were female. Most baseline characteristics—age, BMI, genetic mutation, blood pressure, eGFR, htTKV, glucose, HbA1c and glucagon—were not significantly different between the quartiles of BHB (all P > .05). There were significant differences between the quartiles in plasma leucine (P = .03) and plasma copeptin (P = .03). Copeptin had a U-shaped trend across the quartiles, with the second quartile having the lowest level [6.4 (IQR 4.0–11.9) pmol/L] and the fourth quartile having the highest level [9.0 (IQR 4.4–22.0) pmol/L].
Baseline characteristics of the total cohort and according to sex-stratified quartiles of baseline BHB (µmol/L).
| Sex-stratified quartiles of baseline BHB (µmol/L) | ||||||
|---|---|---|---|---|---|---|
| M <65.0 | M 65.0–87.0 | M 87.0–131.0 | M >131.0 | |||
| Total | F <72.0 | F 72.0–101.0 | F 101.0–161.0 | F >161.0 | P-value | |
| Total (n) | 521 | 134 | 129 | 131 | 127 | |
| BHB (µmol/L) | 94 (68–147) | 58 (49–64) | 82 (77–87) | 114 (103–131) | 213 (180–316) | <.001 |
| Female [n (%)] | 318 (61.0) | 77 (60.6) | 79 (62.2) | 81 (60.0) | 81 (61.4) | .9 |
| Age (years) | 47.3 ± 11.8 | 47.2 ± 11.2 | 45.9 ± 11.7 | 47.6 ± 11.5 | 48.6 ± 12.7 | .33 |
| Height (cm) | 175 ± 12.5 | 176 ± 9.9 | 175 ± 18.1 | 175 ± 9.8 | 176 ± 10.2 | .67 |
| Weight (kg) | 80.8 ± 16.7 | 81.6 ± 17.2 | 80.3 ± 17.3 | 82.3 ± 17.8 | 78.8 ± 15.2 | .37 |
| BMI (kg/m2) | 26.1 ± 4.6 | 26.1 ± 4.3 | 26.1 ± 4.2 | 26.9 ± 5.4 | 25.5 ± 4.4 | .13 |
| Genetic mutation [n (%)] | .21 | |||||
| PKD1 T | 205 (39.3) | 55 (41.0) | 53 (41.1) | 46 (35.1) | 51 (40.2) | |
| PKD1 NT | 140 (26.9) | 35 (26.1) | 43 (33.3) | 35 (26.7) | 27 (21.3) | |
| PKD2 | 131 (25.1) | 35 (26.1) | 24 (18.6) | 33 (25.2) | 39 (30.7) | |
| Missing/other | 45 (8.6) | 9 (6.7) | 9 (7.0) | 17 (13.0) | 11 (8.5) | |
| Blood pressure (mmHg) | ||||||
| Systolic | 130 ± 13.4 | 129 ± 12.7 | 132 ± 14.6 | 129 ± 12.2 | 129 ± 14.1 | .42 |
| Diastolic | 79.6 ± 8.7 | 79.0 ± 8.6 | 80.6 ± 9.8 | 80.1 ± 8.4 | 78.9 ± 8.0 | .33 |
| Antihypertensive use [n (%)] | 378 (72.6) | 93 (69.4) | 94 (72.9) | 100 (76.3) | 91 (71.7) | .65 |
| Beta-blockers [n (%)] | 106 (20.4) | 26 (19.5) | 31 (24.0) | 25 (19.1) | 24 (18.9) | .70 |
| Albuminuria (mg/24 h) | 30 (14–69) | 30 (14–65) | 27 (12–70) | 36 (17–76) | 28 (14–70) | .63 |
| Creatinine (µmol/L) | 107 (77–149) | 110 (81–152) | 98 (74–132) | 106 (78–147) | 113 (78–159) | .13 |
| eGFR (mL/min/1.73 m2) | 63.3 ± 28.9 | 61.2 ± 28.4 | 68.2 ± 29.0 | 63.5 ± 28.4 | 60.5 ± 29.6 | .13 |
| CKD stage baseline [n (%)] | .22 | |||||
| Stage 1 + 2 | 251 (48.3) | 57 (43.2) | 72 (55.8) | 66 (51.9) | 54 (42.5) | |
| Stage 3A + B | 205 (39.4) | 56 (42.4) | 45 (34.9) | 51 (38.9) | 53 (41.7) | |
| Stage 4 + 5 | 63 (12.1) | 19 (14.4) | 12 (9.3) | 12 (9.2) | 20 (15.7) | |
| Copeptin (pmol/L) | 7.9 (4.4–15.6) | 7.6 (3.6–14.7) | 6.4 (4.0–11.9) | 8.9 (4.9–19.0) | 9.0 (4.4–22.0) | .03 |
| htTKV (mL/m) | 834 (495–1327) | 828 (517–1322) | 803 (494–1232) | 995 (483–1509) | 782 (479–1259) | .41 |
| Mayo Risk Classification [n (%)] | .39 | |||||
| Low risk | 148 (28.5) | 36 (26.9) | 37 (28.7) | 32 (25.4) | 44 (34.1) | |
| Medium risk | 182 (35.0) | 51 (38.1) | 51 (39.5) | 43 (33.1) | 38 (29.5) | |
| High risk | 158 (30.4) | 37 (27.6) | 36 (27.9) | 47 (36.2) | 38 (29.5) | |
| Unknown | 32 (6.2) | 10 (7.5) | 5 (3.9) | 7 (5.4) | 5 (4.1) | |
| Glucose (mmol/L) | 5.2 ± 0.5 | 5.2 ± 0.5 | 5.2 ± 0.6 | 5.2 ± 0.6 | 5.1 ± 0.6 | .34 |
| HbA1c (mmol/mol) | 36.1 ± 3.7 | 36.3 ± 3.2 | 36.0 ± 3.9 | 36.3 ± 3.8 | 35.7 ± 4.1 | .51 |
| Glucagon (pmol/L) | 5.0 (3.4–7.3) | 4.8 (3.4–6.7) | 4.6 (3.0–6.6) | 5.0 (3.5–7.9) | 5.6 (3.7–8.1) | .12 |
| Leucine (µmol/L) | 133 ± 29 | 127 ± 26 | 137 ± 32 | 136 ± 29 | 131 ± 29 | .03 |
| Alcohol use (yes) [n (%)] | 410 (83.5) | 97 (78.9) | 105 (85.4) | 102 (81.0) | 106 (83.5) | .14 |
Normally distributed data are presented as mean ± SD, non-normally distributed as median (IQR) and categorical variables are presented as frequencies and percentages. P-values for differences between groups were tested with one-way ANOVA for normally distributed data, Kruskal–Wallis test for non-normally distributed data and Pearson Chi-Square for categorical data.
Distribution of Mayo Risk Classification: low risk (class 1A, 1B and 2); medium risk (class 1C); and high risk (class 1D and 1E).
M, male; F, female; PKD, polycystic kidney disease; T, truncating; NT, non-truncating; CKD, chronic kidney disease.
Determinants of BHB concentration
In univariable analyses, sex and glucose were significantly associated with BHB concentration (Table 2). Sex, glucagon, glucose, copeptin and HbA1c were associated with BHB concentration after adjustment for sex and age. In the stepwise backward analysis, sex {B = 1.205 [95% confidence interval (CI) 1.074–1.352], P = .001}, age [B = 1.005 (95% CI 1.001–1.009), P = .03] and glucagon [B = 1.020 (95% CI 1.005–1.035), P = .01] remained linearly associated with BHB, whereas glucose was nonlinearly significantly associated with BHB (P = .02). The relationship between BHB and glucose is depicted in Supplementary data, Fig. S2.
Associations of possible determinants of baseline log2(BHB) concentration.
| Univariable analyses | Sex and age-adjusted | Stepwise backward analysis | ||||
|---|---|---|---|---|---|---|
| B (95% CI) | P-value | B (95% CI) | P-value | B (95% CI) | P-value | |
| Sex (female) | 1.153 (1.037–1.281) | .008 | 1.169 (1.051–1.299) | .004 | 1.205 (1.074–1.352) | .001 |
| Age (years) | 1.003 (0.999–1.008) | .13 | 1.004 (1.000–1.009) | .06 | 1.005 (1.001–1.009) | .03 |
| Alcohol use (ref: no) | 1.103 (0.957–1.270) | .17 | 1.142 (0.990–1.317) | .07 | ||
| Glucagon (pmol/L) | 1.011 (0.997–1.025) | .12 | 1.019 (1.004–1.034) | .01 | 1.020 (1.005–1.035) | .01 |
| Glucose (mmol/L) | 0.199 (0.059–0.676) | .01 | 0.207 (0.061–0.696) | .01 | 0.221 (0.064–0.755) | .02 |
| Glucose2 | 1.154 (1.030–1.293) | .01 | 1.151 (1.028–1.288) | .01 | 1.143 (1.019–1.281) | .02 |
| Log2(copeptin) | 1.036 (0.994–1.080) | .09 | 1.064 (1.016–1.114) | .008 | ||
| HbA1c (mmol/mol) | 0.988 (0.975–1.002) | .09 | 0.984 (0.970–0.999) | .03 | ||
| Beta-blockers (yes) | 0.923 (0.812–1.049) | .22 | 0.893 (0.784–1.017) | .09 | ||
| SBP (mmHg) | 0.998 (0.994–1.002) | .26 | 0.998 (0.994–1.002) | .25 | ||
| BMI (kg/m2) | 0.993 (0.982–1.004) | .22 | 0.993 (0.982–1.004) | .23 | ||
Estimates, CI and P-values were calculated using linear regression analysis. The dependent variable is log2(BHB). Independent variables are sex, age, alcohol use, glucagon, glucose, copeptin, HbA1c, beta-blockers, SBP and BMI. The estimates are back-log transformed, for the categorical variables indicating the fold change in BHB for the specified category compared with the reference category. For the continuous variables, the estimate represents the fold-change per one-unit increase in the continuous variable. When the independent variable is log2-transformed, a doubling (one unit increase) of the independent variable corresponds to the fold change according to the estimate.
B, estimate.
Cross-sectional analyses
Multivariable linear regression analyses were used to assess the cross-sectional associations of BHB with eGFR and htTKV (Table 3). BHB was not associated with eGFR at baseline [B = –1.07 (95% CI –3.95 to 1.81), P = .47]. After additional adjustment for potential confounders sex, age and copeptin, the association of BHB with eGFR was close to significance [B = 1.52 (95% CI –0.21 to 3.24), P = .08]. Nevertheless, in the final model, after additional adjustment for SBP and PKD mutations, BHB remained not significantly associated with eGFR [B = 1.29 (95% CI –0.38 to 2.96), P = .13].
Cross-sectional associations of BHB with eGFR and htTKV on baseline using linear regression analyses.
| Crude | Model 1 | Model 2 | Model 3 | |||||
|---|---|---|---|---|---|---|---|---|
| Variables | B (95% CI) | P-value | B (95% CI) | P-value | B (95% CI) | P-value | B (95% CI) | P-value |
| eGFR | R2 = 0.001; N = 520 | R2 = 0.46; N = 520 | R2 = 0.66; N = 513 | R2 = 0.68; N = 513 | ||||
| Log2(BHB) | –1.07 (–3.95 to 1.81) | .47 | –0.01 (–2.14 to 2.13) | .9 | 1.52 (–0.21 to 3.24) | .08 | 1.29 (–0.38 to 2.96) | .13 |
| Sex (female) | 6.08 (2.26 to 9.89) | .002 | –5.12 (–8.44 to –1.8) | .003 | –4.39 (–7.63 to –1.14) | .008 | ||
| Age (years) | –1.62 (–1.78 to –1.46) | <.001 | –1.36 (–1.49 to –1.23) | <.001 | –1.52 (–1.66 to –1.38) | <.001 | ||
| Log2(copeptin) | –11.54 (–12.87 to –10.21) | <.001 | –10.90 (–12.20 to –9.59) | <.001 | ||||
| SBP | 0.04 (–0.07 to 0.14) | .52 | ||||||
| PKD2 (ref)a | ||||||||
| PKD1 NT | –6.00 (–10.07 to –1.94) | .004 | ||||||
| PKD1 T | –10.48 (–14.43 to –6.53) | <.001 | ||||||
| Other/missing | 4.46 (–1.43 to 10.34) | .31 | ||||||
| htTKV | R2 = 0.002; N = 489 | R2 = 0.15; N = 489 | R2 = 0.26; N = 482 | R2 = 0.29; N = 482 | ||||
| Log2(BHB) | 0.961 (0.895 to 1.032) | .27 | 0.977 (0.915 to 1.044) | .50 | 0.950 (0.893 to 1.011) | .11 | 0.952 (0.895 to 1.012) | .12 |
| Sex (female) | 0.671 (0.596 to 0.755) | <.001 | 0.822 (0.728 to 0.927) | <.001 | 0.818 (0.726 to 0.922) | <.001 | ||
| Age (years) | 1.013 (1.008 to 1.018) | <.001 | 1.009 (1.004 to 1.013) | <.001 | 1.010 (1.005 to 1.015) | <.001 | ||
| Log2(copeptin) | 1.229 (1.171 to 1.291) | <.001 | 1.219 (1.161 to 1.280) | <.001 | ||||
| SBP | 1.003 (0.999 to 1.007) | .14 | ||||||
| PKD2 (ref)a | ||||||||
| PKD1 NT | 0.989 (0.852 to 1.148) | .9 | ||||||
| PKD1 T | 1.146 (0.989 to 1.327) | .07 | ||||||
| Other/missing | 0.781 (0.635 to 0.959) | .02 | ||||||
Estimates and P-values were calculated using multivariable regression analyses. The dependent variables are eGFR (mL/min/1.73m2) and log2(htTKV) (mL/m) at baseline. The independent variables are baseline log2(BHB) (crude), adjusted for sex, age (Model 1), additionally adjusted for log2(copeptin) (Model 2) and additionally adjusted for SBP and PKD mutations (Model 3). The estimates for dependent variable htTKV are back-log transformed. For categorical variables, estimates show fold changes compared with the reference category. For continuous variables, the estimate indicates the fold change per one-unit increase. When the independent variable is log2-transformed, a doubling (one unit increase) of the independent variable corresponds to the fold change according to the estimate.
aPKD mutation was used as dummy variable with PKD2 as reference group.
B, estimate; N, number; PKD, polycystic kidney disease; NT, non-truncating; T, truncating.
BHB did not associate with htTKV at baseline [B = 0.961 (95% CI 0.895 to 1.032), P = .27]. Also, after adjustment for potential confounders and known determinants of disease progression, BHB remained not associated with htTKV [B = 0.952 (95% CI 0.895 to 1.012), P = .12].
As a sensitivity analysis, participants with type 2 diabetes were added to the cross-sectional analysis (n = 15). The association between BHB and eGFR at baseline did not change after adding these participants [crude, B = –1.23 (–4.09 to 1.64), P = .40; and Model 3, B = 1.47 (–0.20 to 3.14), P = .08]. Similar results were obtained for the association with htTKV in the final model including participants with type 2 diabetes [B = 0.952 (95% CI 0.985 to 1.012), P = .11].
Longitudinal analyses
Linear mixed model analyses were used to assess longitudinal associations. A total of 489 participants with at least two eGFR measurements were included in these analyses. The median follow-up time was 3.95 (IQR 2.99–6.00) years. The median change in eGFR was –2.97 (95% CI –3.18 to –2.76) mL/min/1.73 m2 per year. BHB was positively associated with the eGFR slope [B = 0.35 (95% CI 0.09 to 0.61), P = .005] (Table 4). The model estimated that each doubling of BHB was associated with an improvement in the rate of eGFR decline by 0.35 mL/min/1.73 m2 per year. In all subsequent multivariable models, BHB remained positively associated with eGFR. After adding copeptin, the association became stronger [B = 0.40 (95% CI 0.15 to 0.65), P = .002]. In the final model, after adjustment for sex, age, copeptin, SBP and PKD mutations, each doubling in BHB concentration was associated with an improvement in the eGFR slope of 0.33 (95% CI 0.09 to 0.57, P = .008) mL/min/1.73 m2 per year. To assess whether the association between BHB and the eGFR slope was independent of the htTKV, we added the htTKV on baseline to the final model. BHB remained significantly associated with the eGFR slope after this additional adjustment [B = 0.29 (95% CI 0.05 to 0.53), P = .02].
Longitudinal associations of BHB between eGFR/year and htTKV/year using linear mixed model analyses.
| Crude | Model 1 | Model 2 | Model 3 | |||||
|---|---|---|---|---|---|---|---|---|
| Variables | Est. (95% CI) | P-value | Est. (95% CI) | P-value | Est. (95% CI) | P-value | Est. (95% CI) | P-value |
| eGFR slope | R2 = 0.04, N = 489 | R2 = 0.43, N = 489 | R2 = 0.63, N = 482 | R2 = 0.67, N = 482 | ||||
| Log2(BHB) | 0.35 (0.09 to 0.61) | .007 | 0.30 (0.05 to 0.56) | .02 | 0.40 (0.15 to 0.65) | .002 | 0.33 (0.09 to 0.57) | .008 |
| Sex (female) | 0.59 (0.14 to 1.04) | .005 | –0.01 (–0.48 to 0.45) | .9 | –0.04 (–0.49 to 0.41) | .85 | ||
| Age (years) | 0.00 (–0.02 to 0.02) | .9 | 0.02 (0.00 to 0.04) | .048 | 0.01 (–0.01 to 0.03) | .45 | ||
| Log2(copeptin) | –0.65 (–0.85 to –0.45) | <.001 | –0.57 (–0.77 to –0.38) | <.001 | ||||
| SBP | –0.03 (–0.05 to –0.02) | <.001 | ||||||
| PKD2 (ref)* | ||||||||
| PKD1 NT | –0.89 (–1.45 to –0.32) | 0.002 | ||||||
| PKD1 T | –1.19 (–1.75 to –0.63) | <.001 | ||||||
| Other/missing | 0.06 (–0.74 to 0.85) | .9 | ||||||
| htTKV growth/year | R2 = 0.03, N = 348 | R2 = 0.16, N = 348 | R2 = 0.22, N = 344 | R2 = 0.26, N = 344 | ||||
| Log2(BHB) | 1.000 (0.995 to 1.005) | .9 | 1.001 (0.997 to 1.006) | .55 | 1.001 (0.996 to 1.006) | .74 | 1.001 (0.996 to 1.006) | .67 |
| Sex (female) | 0.983 (0.974 to 0.991) | <.001 | 0.987 (0.978 to 0.996) | .004 | 0.988 (0.979 to 0.996) | .006 | ||
| Age (years) | 1.000 (0.9995 to 1.00) | .48 | 1.000 (0.999 to 1.000) | .12 | 1.000 (0.999 to 1.000) | .20 | ||
| Log2(copeptin) | 1.006 (1.002 to 1.010) | .002 | 1.006 (1.002 to 1.01) | .003 | ||||
| SBP | 1.000 (1.000 to 1.001) | .13 | ||||||
| PKD2 (ref)* | ||||||||
| PKD1 NT | 0.997 (0.986 to 1.008) | .63 | ||||||
| PKD1 T | 1.001 (0.990 to 1.012) | .89 | ||||||
| Other/missing | 0.975 (0.960 to 0.989) | .001 | ||||||
The estimates and P-values were calculated using linear mixed model analyses. The estimates are the variables and their interaction with time which is the effect of the variables on eGFR slope (mL/min/1.73 m2 per year) (top part of the table) or htTKV growth per year (bottom part of the table).
The independent variables are baseline log2(BHB) (crude), adjusted for sex, age (Model 1), additionally adjusted for log2(copeptin) (Model 2) and additionally adjusted for SBP and PKD mutations (Model 3). The estimates for dependent variable htTKV growth are back-log transformed. For categorical variables, estimates show fold changes compared with the reference category. For continuous variables, the estimate indicates the fold change per one-unit increase. When the independent variable is log2-transformed, a doubling (one unit increase) of the independent variable corresponds to the fold change according to the estimate. The fold change can be calculated to percentage difference = (fold change – 1)*100%.
*PKD mutation was used as dummy variable with PKD2 as reference group.
Est., estimate; PKD, polycystic kidney disease; NT, non-truncating; T, truncating.
A total of 348 participants had at least two available TKV measurements. The median growth rate of htTKV was 4.84 (95% CI 4.42 to 5.23) % per year. BHB was not associated with a change in htTKV over time [B = 1.000 (95% CI 0.995 to 1.005), P = .9] (Table 4). BHB remained not significantly associated with htTKV over time in all multivariable models. The relation between BHB and eGFR slope and htTKV growth is shown in Fig. 1.
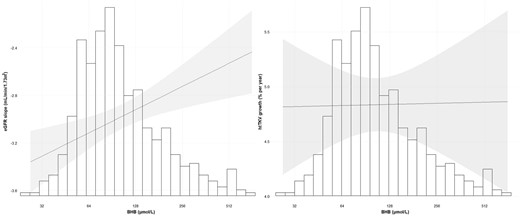
The distribution of BHB (µmol/L) and the association of BHB with the eGFR slope (left panel) and htTKV growth (right panel). The line estimates the influence of BHB on the eGFR slope and htTKV growth adjusted for sex, age, copeptin, SBP and PKD mutations. The shaded area is the 95% CI of the estimate. The x-axes represent the back-log transformed BHB values and its corresponding histogram. The y-axis on the left panel represents the eGFR slope (mL/min/1.73 m2) and on the right panel the htTKV growth (% per year).
As sensitivity analyses, participants with type 2 diabetes (n = 15) were added to the longitudinal analysis. The results remained essentially similar: each doubling in BHB concentration remained associated with an improvement in eGFR slope by 0.34 (95% CI 0.10 to 0.57, P = .006) mL/min/1.73 m2 per year in the final model, whereas the association of BHB with htTKV over time remained not significant [final model, B = 1.001 (95% CI 0.996 to 1.006), P = .75]. In addition, the association between BHB and the eGFR slope remained significant after additional adjustment for the BHB determinants age, sex, glucagon and glucose [B = 0.33 (95% CI 0.08 to 0.58), P = .01]. Since glucose was nonlinearly significantly associated with BHB, and is an easier to measure biomarker, we assessed the association of glucose in quartiles and continuously on the eGFR slope. Glucose in quartiles and continuously was not significantly associated with the eGFR slope crude, nor after adjustment for sex, age, copeptin, SBP and PKD mutations (P > .50). To assess the effect of dietary intake of salt and proteins, we additionally adjusted for these potential confounders in the final model. BHB remained significantly associated with the eGFR slope [B = 0.28 (95% CI 0.05 to 0.51), P = .02]. The robustness of the association between BHB and eGFR slope across different subgroups was assessed as shown in Supplementary data, Table S2. The BHB estimate remained positively associated with an improvement in eGFR across the different subgroups: sex, age, baseline eGFR, baseline htTKV and copeptin. Although not all estimates were significant due to loss of power, the overall trend was a positive association between BHB and eGFR slope across the subgroups. There were no significant interactions between the subgroups and BHB. To assess if the inclusion of the outliers altered the results, these participants (n = 4) were added to the analyses. BHB remained positively significantly associated with the eGFR slope [B = 0.27 (95% CI 0.05 to 0.50), P = .02].
DISCUSSION
In the present study, we found that in a general ADPKD population cohort, higher concentrations of the ketone body BHB were associated with less kidney function decline. While we did not observe an association between BHB and changes in htTKV over time, the favorable relationship between BHB and the eGFR slope holds great promise. The finding that BHB is associated with eGFR but not htTKV is noteworthy, since this study was predicated on animal and in vitro data that predicted that ketogenesis would inhibit kidney cyst (and hence volume) growth. Instead, we appear to have found a biomarker of GFR decline that is independent of cyst growth. Hypothetically, this could be because the possible protective effect of BHB on kidney function might be an ADPKD-independent effect, since in other preclinical studies raising BHB concentration ameliorated the rate of kidney disease progression [11, 32, 33]. These results provide support for the hypothesis that ketogenic interventions may offer an effective treatment approach for individuals with ADPKD.
The positive effect of BHB on the eGFR slope is in line with data from preclinical studies, where ketogenic interventions successfully reduced disease progression [6, 7]. Only a few clinical studies are available on the effect of ketogenic interventions in ADPKD, including a retrospective case series study and two interventional studies. The retrospective study included 131 patients with ADPKD who followed either a ketogenic diet, time-restricted feeding or caloric restriction [34]. The results indicated an increase in eGFR of 3.6 mL/min/1.73 m2 after a median treatment duration of 6 months. However, the eGFR data were self-reported and not collected in a standardized manner, limiting their reliability [34]. Recently, two ketogenic intervention trials were conducted in patients with ADPKD (NCT04680780 and NCT04472624). The RESET-PKD trial was a pilot study that demonstrated that 90% of the participants could reach an effective level of ketogenesis (defined as a BHB >0.8 mmol/L) [35]. The second trial, the KETO-ADPKD study, included 63 patients and lasted 3 months. Preliminary results showed a significant increase in eGFR and a close to significant reduction in htTKV among participants on the ketogenic diet compared with the control group [36]. These interventional studies indicate that reaching an adequate level of ketogenesis is feasible and might positively impact disease progression in patients with ADPKD, even after a short treatment period. Nevertheless, additional research is needed to confirm the potential protective effects of ketogenic interventions in ADPKD during a longer treatment period. In addition to the previous investigations, our study demonstrates that mildly elevated BHB concentrations, even in a non-ketogenic range, are associated with an improvement of the eGFR slope by 0.33 mL/min/1.73 m2 per year after adjustment for potential confounders and known determinants of disease progression.
The alleged protective effects of BHB have been attributed to several factors. ADPKD cells have a dysregulated metabolism, shifting from oxidative phosphorylation to aerobic glycolysis, similar to the Warburg effect in cancer cells [4]. This alteration makes the cells dependent on glucose for growth and survival, and it leads to changes in multiple energy sensors in the cell, such as the upregulation of mTOR and the downregulation of AMP-activated kinase (AMPK) [37–39]. These alterations are known to influence disease progression in ADPKD negatively. Ketogenic interventions have been shown to reduce mTOR and increase AMPK signaling in ADPKD [6]. Besides changing the signaling of these energy sensors, BHB can reduce inflammation, oxidative stress and fibrosis by blocking the inflammasome and modulating gene expression via histone deacetylases [9, 10].
Interestingly, our data indicate that there might be a relation between the vasopressin axis and ketogenesis. Copeptin, a surrogate marker of vasopressin, is known to be increased in ADPKD and to influence disease progression negatively [40]. Vasopressin may also have an impact on ketogenesis and glucagon concentration [31, 41, 42]. Preclinical studies in rats showed mixed effects: low vasopressin reduced ketone bodies, and high vasopressin increased glucagon, stimulating ketogenesis [31, 41]. This phenomenon was also observed in healthy volunteers, in whom a vasopressin infusion did not change BHB levels, while glucagon levels were increased [43]. In the present study, copeptin was associated with higher BHB levels, adjusted for age and sex, but this association lost significance in the stepwise backward analysis, whereas glucagon stayed positively associated. Therefore, how strong the effect of vasopressin on ketogenesis is remains to be elucidated. Of note, it may be clinically relevant when vasopressin would influence ketogenesis in patients with ADPKD. Vasopressin concentration is known to be elevated in this population and, according to the literature, may have a negative impact on ketogenesis. At the same time, we also show that increased ketone body levels are associated with better kidney function outcome. These findings may thus suggest a novel mechanism by which vasopressin could work deleteriously in ADPKD.
The strengths of the study are the well-phenotyped and large cohort of patients with ADPKD, the sensitive and specific measurement of BHB, and the serial measurements of eGFR and htTKV as measures of disease severity and progression. Limitations are, firstly, that BHB was only measured at baseline. Therefore, we do not know the levels of BHB during follow-up and whether changes in BHB influenced the eGFR slope over time. Secondly, no patients had BHB levels in the ketogenic range (>800 µmol/L). We therefore cannot determine the effect of being in a ketogenic state on disease progression in ADPKD. Nevertheless, our findings show that even mildly increased levels of BHB at baseline are associated with an improvement in the eGFR slope. The association of doubling the BHB concentration with an improvement of the kidney function of 0.33 mL/min/1.73 m2 per year would imply an improvement of around 3–4 mL/min/1.73 m2 after 10 years of follow-up. Potentially, during a ketogenic diet, the BHB levels could increase 4- to 8-fold, which could translate to an improvement of eGFR around 9–12 mL/min/1.73m2 after 10 years of follow-up, which would be clinically significant. Lastly, as in all observational studies, we cannot infer causality from our results, and there might be residual confounding.
In conclusion, this study is the first to find that higher plasma ketone body beta-hydroxybutyrate concentrations are associated with less kidney function decline in a large observational cohort of patients with ADPKD. Our observational data support the hypothesis that raising beta-hydroxybutyrate levels by diet or drugs could reduce the rate of disease progression in patients with ADPKD.
ACKNOWLEDGEMENTS
Collaborating authors of the DIPAK consortium: J.P.H. Drenth (Department of Gastroenterology and Hepatology, Radboud University Medical Center, Nijmegen, The Netherlands); J.W. de Fijter (Department of Nephrology, Leiden University Medical Center, Leiden, The Netherlands); D.J.M. Peters (Department of Human Genetics, Leiden University Medical Center, Leiden, The Netherlands); M. Salih (Department of Nephrology, Erasmus Medical Center, Rotterdam, The Netherlands); E.J. Hoorn (Department of Nephrology, Erasmus Medical Center, Rotterdam, The Netherlands); T. Nijenhuis (Department of Nephrology, Radboud University Medical Center, Nijmegen, The Netherlands); E. Meijer (Department of Nephrology, University Medical Center Groningen, Groningen, The Netherlands).
FUNDING
The DIPAK Consortium is an interuniversity collaboration in The Netherlands that was established to study ADPKD and to develop rational treatment strategies for this disease. It is sponsored by grants from the Dutch Kidney Foundation (CP10.12 and CP15.01) and Dutch government (LSHM15018). In addition, unrestricted grants were obtained from Ipsen and Otsuka Pharmaceuticals. Neither party had any role in the design of the study, analysis and interpretation of data, or writing of the manuscript.
AUTHORS’ CONTRIBUTIONS
M.G.E.K., R.T.G. and M.D.A.v.G. contributed to the research idea and study design. All DIPAK collaborators, S.J.L.B. and M.A.C. contributed to the data acquisition. M.G.E.K., T.B., P.G., R.T.G. and M.D.A.v.G. contributed to data analysis/interpretation. M.G.E.K., T.B. and P.G. contributed to the statistical analysis. R.T.G. and M.D.A.v.G. provided supervision and mentorship. Each author contributed important intellectual content during manuscript drafting or revision and accepts accountability for the overall work.
DATA AVAILABILITY STATEMENT
Data cannot be shared for legal reasons. Participating subjects signed in their informed consent form that their data will only be used by investigators of the DIPAK Consortium and will not be handed to third parties. However, external investigators can submit a research proposal to the DIPAK Steering Committee. If this body agrees with the proposal, the proposed analyses will be carried out by the epidemiologists working for the consortium. The results will be sent to these investigators and may be used for publication.
CONFLICT OF INTEREST STATEMENT
R.T.G. received grants for research from Galapagos, Ipsen, Otsuka and Sanofi-Genzyme. All financial benefits are paid to the employing institution. R.T.G. holds the rights for the orphan medical product designation for lanreotide to halt disease progression in ADPKD. M.A.C. is an employee of Labcorp. The results presented in this article have not been published previously in whole or part, except in abstract format.
REFERENCES
Author notes
Members of the DIPAK Consortium are listed in the Acknowledgements.


Comments