


ABSTRACT
Statins are recommended in kidney transplant recipients (KTRs)—a population with a high risk of major cardiovascular (CV) events. However, the literature data on the effectiveness of statins in KTRs are sparse and inconclusive. The present study's objective was to evaluate the association between statin exposure and atherosclerotic CV events in KTRs and the biochemical effectiveness of statins on the lipid profile.
A total of 318 consecutive KTRs managed at a single center between 2006 and 2019 were retrospectively included. Those exposed to statins after transplantation were incident users. In all users, statins were indicated for primary CV prevention. Lipid profiles, the occurrence of any atherosclerotic CV events (stroke, myocardial infarction, other atherosclerotic CV events and atherosclerotic CV deaths) were documented comprehensively. We applied Cox models that included statin exposure as a time-dependent covariate fitted with time-varying inverse probability treatment weighting (IPTW) to assess the effectiveness of statins on atherosclerotic CV events and on all CV events. We built linear mixed models to assess the biochemical effectiveness of statins.
During a median (interquartile range) follow-up period of 6.0 (3.9–10.0) years, 27 atherosclerotic CV events occurred in 26 patients. In the Cox models fitted with time-varying IPTW, exposure to statins was not associated with a decrease in atherosclerotic CV events; the hazard ratio was 1.16 (95% confidence interval 0.53–2.53) (P = .700). In the linear mixed models, statin exposure was associated with significant decrease over time in triglyceride and low-density lipoprotein cholesterol concentrations (P < .001). These results were consistent when stratified for the intensity of statin therapy.
Even though the lipid profile improved, statin exposure was not associated with a decrease in CV events in this real-life, single-center, retrospective, long-term follow-up study of a KTR cohort. Larger, controlled studies are needed to confirm or refute these results.
What was known:
Kidney transplant recipients (KTRs) have an elevated prevalence of cardiovascular (CV) events due to the elevated incidence of CV risk factors like diabetes mellitus, hypertension and dyslipidemia, which lead to greater morbidity and mortality rates.
There are few literature data on the effectiveness of statins in CV event prevention in KTRs.
This study adds:
In a single-center, retrospective cohort study of KTRs, exposure to statins indicated for primary CV prevention was not associated with a decrease in atherosclerotic CV events.
Statin exposure—especially when intense—improved the lipid profile.
Potential impact:
Currently recommended therapeutic targets for low-density lipoprotein cholesterol or triglycerides in KTRs may be questionable.
INTRODUCTION
Kidney transplantation is the treatment of choice in end-stage chronic kidney disease (CKD); compared with dialysis, transplantation is associated with longer life expectancy [1–3]. Nevertheless, kidney transplant recipients (KTRs) are exposed to complications in general and cardiovascular (CV) complications in particular. The mortality rate is higher among KTRs than the general population, due to the elevated incidence of CV risk factors like diabetes mellitus, hypertension and dyslipidemia [4].
Studies of the ability of treatment with statins to prevent CV events in CKD patients have given conflicting results. The AURORA (A study to evaluate the Use of Rosuvastatin in subjects On Regular haemodialysis: an Assessment of survival and cardiovascular events) study group failed to show [...] for 3.8 years [5]. In a double-blind, randomized study of 9270 CKD patients (including predialysis and hemodialysis patients), the Study of Heart and Renal Disease (SHARP) investigators assessed the impact of simvastatin plus ezetimibe on reductions in low-density lipoprotein cholesterol (LDL-c) concentrations and major atherosclerotic events. During a median follow-up period of 4.9 years, the use of simvastatin 20 mg plus ezetimibe 10 mg daily was associated with a reduction in LDL-c concentrations and in the incidence of major atherosclerotic events {rate ratio (RR) 0.83 [95% confidence interval (CI) 0.74–0.94]; log-rank test: P = .0021} [6].
There are few literature data on the effectiveness of statins in CV event prevention in KTRs. A multicenter randomized placebo-controlled trial failed to show a significant reduction in major CV events in KTRs treated with fluvastatin, compared with the placebo group [7]. A meta-analysis of randomized controlled trials did not give a clear verdict [8]. Recently, the results of a long-term cohort study using the United States Renal Data System (USRDS) showed that statin exposure in KTRs significantly reduced all-cause mortality; however, the study did not include specific data on atherosclerotic CV events [9]. Furthermore, the guidelines issued by the Kidney Disease Outcomes Quality Initiative indicate that statins are essentially as effective in KTRs as they are in the general population [10]. Short follow-up periods might limit the results of randomized controlled trials, particularly if the time interval to onset of the outcome of interest is long.
Nevertheless, the Kidney Disease: Improving Global Outcomes (KDIGO) guidelines state that KTRs should have a complete lipid profile 2–3 months after transplantation, 2–3 months after a change in treatment or the appearance of other conditions known to induce dyslipidemias, and then at least annually thereafter. The KDIGO guidelines also state that dyslipidemia should be treated—preferably with statins—as a function of triglyceride and LDL-c thresholds [11].
In the general population, statins are generally well tolerated and rarely cause serious adverse drug reactions (ADRs) [12]. However, many patients report statin-associated muscle symptoms, which can worsen quality of life and treatment adherence. Although patients with CKD are prone to the development of ADRs [13], data on the safety of statins in KTRs are scarce.
The objectives of the present long-term, retrospective, longitudinal cohort of KTRs were to (i) assess the association between statin exposure (indicated for primary CV prevention) and atherosclerotic CV events, (ii) evaluate the biochemical effectiveness of statins with regard to the lipid profile and (iii) describe any statin-related ADRs.
MATERIALS AND METHODS
Study design and participants
We performed a retrospective, longitudinal study of a cohort of adult patients (aged 18 years and over) who underwent kidney transplantation at Amiens University Medical Center (Amiens, France) between 1 January 2006 and 13 February 2019. The study end date was 31 October 2021, or (for KTRs having resumed dialysis) the dialysis resumption date. On the transplantation day, the patients underwent an extensive laboratory workup, including a lipid profile [serum triglycerides, high-density lipoprotein cholesterol (HDL-c) and LDL-c]. The routine post-transplantation follow-up was standardized: extensive clinical check-ups were performed 1 month and 4 months after transplantation and then annually. Each check-up included a lipid profile, and all medical events (including CV events) having occurred since the previous check-up were documented exhaustively. The patients could consult their usual nephrologist between scheduled study visits, if needed.
Inclusion criteria and the end of follow-up
KTRs were included if they had at least 1 year of dialysis-free follow-up after kidney transplantation. Since the present study focused on KTRs with a functioning graft, resumption of dialysis in the year following transplantation was an exclusion criterion. In order to avoid issues in the statistical analyses, a patient having undergone kidney transplantation several times during the study period could not be included several times; only the first transplantation was considered if it had happened more than a year before dialysis resumption. If the first transplantation did not meet these inclusion criteria, the next one that did was considered. Furthermore, patients who had undergone kidney transplantation several times (including one or more transplantation prior to the study period and one or more transplantation during the study period) could be included. To avoid prevalent-user bias, prevalent statin users (defined as those having been prescribed a statin in the year preceding transplantation) were not included in the analysis [14].
Collected data
All data were collected by three investigators (B.B., C.N. and A.N.) from the patients’ electronic health records.
The time-fixed variables recorded at baseline included: age at transplantation, sex, any history of CV events before transplantation, ethnic group, the etiology of CKD, any previous transplantations, time on hemodialysis before transplantation, preemptive transplantation, immunologic risk factors, donor-specific antibodies (DSAs) at transplantation, crossmatching results, induction therapy and serum homocysteine.
The time-varying variables recorded each year during the follow-up (from the transplantation date to the end date) included: body mass index (BMI), sedentary lifestyle, alcohol consumption, smoking, diabetes mellitus, arterial hypertension, left ventricular hypertrophy, thyroid disorders, drug exposure (including statins and other cholesterol-lowering drugs, anticoagulants, antiplatelet agents and immunosuppressive agents), the lipid profile, serum concentrations of calcium, phosphate, potassium, parathyroid hormone, albumin, creatinine and C-reactive protein (CRP), hemoglobin, estimated glomerular filtration rate (eGFR), proteinuria and incident CV events.
The nephrologist recorded subjectively whether or not a given patient had a sedentary lifestyle. Patients were characterized as smokers if they were former or current smokers. Diabetes mellitus was classified as absent, controlled (HbA1C ≤7%) or uncontrolled (HbA1C >7%). Arterial hypertension was classified as absent, optimally treated (<140/90 mmHg), grade I (140–159/90–99 mmHg), grade II (160–179/100–109 mmHg) or grade III (>180/110 mmHg). The GFR was estimated with the Modification of Diet in Renal Disease equation because the standardized isotopic dilution mass spectroscopy method was not available for all of the follow-up period.
Data on statin prescriptions (whether issued by a nephrologist or not) were extracted from the patient's electronic health records. When a patient had received the same drug class intermittently during the follow-up period, all periods of drug exposure were documented. Statins were classified according to the treatment intensity, i.e. the dose and each statin's known ability to reduce the LDL-c concentration [15]. High-intensity statin therapy included atorvastatin 40–80 mg/day and rosuvastatin 20–40 mg/day. Moderate-intensity statin therapy included atorvastatin 10–20 mg/day, rosuvastatin 5–10 mg/day, simvastatin 20–40 mg/day, pravastatin 40–80 mg/day, lovastatin 40 mg/day and fluvastatin 40–80 mg/day. Low-intensity statin therapy included simvastatin 10 mg/day, pravastatin 10–20 mg/day, lovastatin 20 mg/day and fluvastatin 20–40 mg/day.
Cardiovascular outcomes
The primary outcome was incident atherosclerotic CV events: nonfatal stroke, transient ischemic attack, nonfatal myocardial infarction, angina pectoris, other atherosclerotic CV events (with ischemia requiring revascularization) and CV death caused by an atherosclerotic event in statin users vs non-users [16].
The secondary outcome was any incident CV event; in addition to the aforementioned atherosclerotic CV events, this outcome included heart failure, arrhythmia and any CV death.
Adverse reactions to statins
An ADR was defined as “an appreciably harmful or unpleasant reaction, resulting from an intervention related to the use of a medicinal product, which predicts hazard from future administration and warrants prevention or specific treatment, or alteration of the dosage regimen, or withdrawal of the product” [17]. A serious ADR was defined as an ADR that was followed by death, a life-threatening situation, hospitalization (initial or prolonged), disability, permanent damage or another important medical event [13]. Based on the patient's electronic health records, we used the Naranjo ADR probability scale [18] to assess ADRs recorded during the statin exposure periods. The validated Naranjo ADR probability scale is mainly used to probe the causal nature of relationships between a drug and an adverse event through 10 questions on the event's chronology, the symptom profile and the literature data [19]. Each recorded event was assigned to one of the following probability categories, according to the total Naranjo probability scale score: ≥9: definite; 5–8: probable; 1–4: possible; 0: doubtful.
Statistical analysis
In descriptive analyses, categorical variables were expressed as the number (percentage) and continuous variables were expressed as the mean ± standard deviation (SD) or the median [interquartile range (IQR)], depending on the data distribution. The visual analysis of histograms was used to determine whether or not data were normally distributed.
Overall, the proportion of missing data was 2.6%. The proportions of missing data by variable and by year are given in Table 1 and Supplementary data, Tables S1–S8. We performed multiple imputations for these variables by using the fully conditional specification method (10 datasets and 10 iterations; Table 1 and Supplementary data, Tables S1–S8) [20]. The patterns suggested that the data were indeed missing at random.
Characteristics of the study population at transplantation.
| N = 318 | Missing data (%) | |
|---|---|---|
| Clinical CV risk factors | ||
| Age (years), mean (SD) | 45.73 (13.09) | 0.0 |
| Sex (male), n (%) | 204 (64.2) | 0.0 |
| BMI (kg/m2), median (IQR) | 23.80 (21.12–27.50) | 0.0 |
| Ethnic group, n (%) | 0.0 | |
| Caucasian | 294 (92.5) | |
| Black | 23 (7.2) | |
| Other | 1 (0.3) | |
| Alcohol consumption, n (%) | 28 (8.8) | 0.0 |
| Smoking, n (%) | 80 (25.2) | 0.0 |
| Thyroid disorders, n (%) | 21 (6.6) | 0.0 |
| Diabetes mellitus, n (%) | 0.0 | |
| No | 294 (92.5) | |
| Controlled (HbA1c ≤7%) | 14 (4.4) | |
| Uncontrolled (HbA1c >7%) | 10 (3.1) | |
| Sedentary lifestyle, n (%) | 92 (28.9) | 0.0 |
| Arterial hypertension, n (%) | 0.0 | |
| No | 38 (11.9) | |
| Optimally treated (<140/90 mmHg) | 129 (40.6) | |
| Grade 1 (140–159/90–99 mmHg) | 120 (37.7) | |
| Grade 2 (160–179/100–109 mmHg) | 21 (6.6) | |
| Grade 3 (>180/110 mmHg) | 10 (3.1) | |
| Left ventricular hypertrophy, n (%) | 65 (20.4) | 0.0 |
| Variables related to CKD and kidney transplantation | ||
| Etiology of CKD, n (%) | 0.0 | |
| Glomerulonephritis | 98 (30.8) | |
| Hereditary disease | 57 (17.9) | |
| Including polycystic kidney disease | 51 (16.0) | |
| Renal and urinary tract malformations | 37 (11.6) | |
| Hypertensive kidney disease | 15 (4.7) | |
| Diabetic kidney disease | 14 (4.4) | |
| Interstitial nephritis | 20 (6.3) | |
| Vascular nephropathy | 14 (4.4) | |
| Indeterminate | 46 (14.5) | |
| Other | 17 (5.3) | |
| Time on dialysis before transplantation (years), median (IQR) | 2.20 (1.29–3.87) | 0.0 |
| Previous kidney transplantation, n (%) | 40 (12.6) | 0.0 |
| Preemptive transplantation, n (%) | 13 (4.1) | 0.0 |
| DSAs, n (%) | 0.0 | |
| Previously | 5 (1.6) | |
| Currently | 2 (0.6) | |
| Never | 311 (97.8) | |
| Cinacalcet use before transplantation, n (%) | 64 (20.1) | 0.0 |
| Deceased donor, n (%) | 292 (91.8) | 0.0 |
| Induction immunosuppressive therapy, n (%) | ||
| Basiliximab | 187 (58.8) | 0.0 |
| Thymoglobulin | 125 (39.3) | 0.0 |
| Intravenous immunoglobulins | 12 (3.8) | 0.0 |
| Maintenance immunosuppressive therapy, n (%) | ||
| Corticoids | 318 (100.0) | 0.0 |
| Tacrolimus | 243 (76.4) | 0.0 |
| Cyclosporine | 74 (23.3) | 0.0 |
| Mycophenolate mofetil | 311 (97.8) | 0.0 |
| Everolimus | 6 (1.9) | 0.0 |
| Sirolimus | 0 | 0.0 |
| Azathioprine | 0 | 0.0 |
| Antithrombotic drugs, n (%) | ||
| Anticoagulant | 17 (5.3) | 0.0 |
| Antiplatelet agent | 31 (9.7) | 0.0 |
| Laboratory data, median (IQR) | ||
| Serum calcium (mg/L) | 92.0 (88.4–98.0) | 0.0 |
| Serum phosphate (mg/L) | 44.9 (35.4–55.0) | 0.0 |
| Parathyroid hormone (ng/mL) | 231.50 (92.00–480.25) | 2.5 |
| Serum potassium (mEq/L) | 4.76 (4.30–5.27) | 0.0 |
| Hemoglobin (g/dL) | 9.80 (8.80–10.60) | 0.3 |
| Serum albumin (g/L) | 41.80 (39.00–45.00) | 0.3 |
| Homocysteine (ng/L) | 23.80 (15.12–34.18) | 0.0 |
| Proteinuria, (mg/day) | 315.00 (176.00–564.00) | 0.3 |
| Serum creatininea (mg/L) | 15.5 (12.5–19.4) | 0.0 |
| eGFRa (mL/min/1.73 m2) | 52.00 (40.25–65.00) | 0.0 |
| CRP (mg/L) | 3.00 (1.00–6.15) | 0.0 |
| Triglycerides (mmol/L) | 1.59 (1.15–2.22) | 0.0 |
| Total cholesterol (mmol/L) | 4.94 (4.14–5.65) | 0.0 |
| HDL-c (mmol/L) | 1.15 (0.95–1.41) | 0.3 |
| LDL-c (mmol/L) | 2.60 (1.99–3.31) | 0.3 |
Serum creatinine and eGFR 1 month after transplantation.
Biochemical effects of statins in users (vs non-users) over the entire follow-up period and with stratification for statin intensity (in LMMs).
| Triglycerides | Total cholesterol | HDL-c | LDL-c | |||||||||
|---|---|---|---|---|---|---|---|---|---|---|---|---|
| Estimate ± SEE | t-value | P-value | Estimate ± SEE | t-value | P-value | Estimate ± SEE | t-value | P-value | Estimate± SEE | t-value | P-value | |
| Statin exposure overall | ||||||||||||
| Fixed effects | ||||||||||||
| Time | 0.001 ± 0.007 | 0.35 | .728 | 0.044 ± 0.008 | 5.352 | <.001 | 0.023 ± 0.003 | 8.298 | <.001 | 0.055 ± 0.006 | 8.474 | <.001 |
| Statin | −0.299 ± 0.074 | −4.05 | <.001 | −0.27 ± 0.083 | −3.277 | <.001 | 0.15 ± 0.028 | 5.198 | <.001 | −0.273 ± 0.065 | −4.193 | <.001 |
| Time × statin | 0.027 ± 0.013 | 2.04 | .041 | −0.07 ± 0.015 | −4.348 | <.001 | −0.029 ± 0.005 | −5.705 | <.001 | −0.056 ± 0.012 | −4.677 | <.001 |
| Random effects | ||||||||||||
| Subject | 0.728 ± 0.885 | 0.681 ± 0.825 | 0.446 ± 0.668 | |||||||||
| Statin exposure stratified for intensity | ||||||||||||
| Fixed effects | ||||||||||||
| Time | 0.003 ± 0.007 | 0.356 | .722 | 0.045 ± 0.008 | 5.478 | <.001 | 0.023 ± 0.003 | 8.350 | <.001 | 0.055 ± 0.006 | 8.652 | <.001 |
| Statin intensity (ref. = no) | ||||||||||||
| Low | −0.152 ± 0.106 | −1.438 | .150 | −0.004 ± 0.119 | −0.036 | .971 | 0.111 ± 0.041 | 2.729 | 0.006 | −0.067 ± 0.093 | −0.718 | 0.473 |
| Moderate | −0.469 ± 0.101 | −4.659 | <.001 | −0.617 ± 0.112 | −5.503 | <.001 | 0.148 ± 0.039 | 3.837 | <.001 | −0.523 ± 0.088 | −5.951 | <.001 |
| High | −0.27 ± 0.304 | −0.874 | .382 | −1.340 ± 0.340 | −3.942 | <.001 | 0.010 ± 0.117 | 0.087 | .930 | −1.204 ± 0.266 | −4.526 | <.001 |
| Time × statin (low) | 0.013 ± 0.021 | 0.618 | .536 | −0.064 ± 0.023 | −2.669 | .008 | −0.012 ± 0.008 | −1.487 | .137 | −0.059 ± 0.019 | −3.154 | .002 |
| Time × statin (moderate) | 0.046 ± 0.017 | 2.705 | .007 | −0.031 ± 0.019 | −1.620 | .105 | −0.034 ± 0.006 | −5.301 | <.001 | −0.025 ± 0.015 | −1.677 | .094 |
| Time × statin (high) | 0.020 ± 0.043 | 0.463 | .644 | −0.003 ± 0.048 | −0.053 | .958 | −0.021 ± 0.016 | −1.273 | .203 | −0.006 ± 0.037 | −0.174 | .862 |
| Random effects | ||||||||||||
| Subject | 0.790 ± 0.889 | 0.674 ± 0.821 | 0.148 ± 0.384 | 0.441 ± 0.664 | ||||||||
SEE, standard error estimation.
In non-adjusted analyses, Cox proportional hazards models were used to assess the associations between (i) statin exposure (as time-dependent covariate) and incident CV events, (ii) all fixed and time-varying variables and incident CV events, and (iii) all fixed and time-varying variables and statin exposure. The survival time was right-censored if the outcome (“incident CV events” or “use of statins”) had not been observed in patients still being followed up when the data were collected. The survival time was also right-censored in patients lost to follow-up, those having resumed dialysis, and those who died (for non-CV-related deaths). When considering the “incident CV event” outcome, only the first CV event was analyzed.
In adjusted analyses of the association between statin exposure (as a time-dependent covariate) and outcomes (atherosclerotic CV events, and all CV events), marginal structural Cox proportional hazards models were weighted with time-varying inverse probability treatment weighting (IPTW) [21]. Time-varying IPTW was estimated by modeling the relationship between statin exposure and confounders via a Cox proportional hazards model. The confounders used in the latter Cox model were those known to be associated with CV events in the literature and those associated (P < .2) in our study with incident CV events. Overall, the confounders included in the Cox model for time-varying IPTW calculation were (i) age at transplantation, sex, ethnic group, history of CV events before transplantation, DSA at transplantation, hemodialysis duration before transplantation and serum homocysteine at transplantation, for time-fixed variables, and (ii) BMI, alcohol consumption, smoking, thyroid disorders, diabetes mellitus, sedentary lifestyle, hypertension, left ventricular hypertrophy, acute renal rejection, immunosuppressant therapy, antiplatelet agents, anticoagulant drugs, the use of fibrates and ezetimibe, serum concentrations of phosphate, potassium, albumin, CRP, triglycerides and LDL-c, hemoglobin, eGFR and proteinuria, for time-varying variables. Moreover, the occurrence of a non-atherosclerotic CV event (i.e. heart failure or rhythm disorders) was considered as a risk factor for the primary outcome (atherosclerotic CV events) and was therefore included in the Cox model for time-varying IPTW calculation.
Linear mixed models (LMMs) were built to assess the biochemical effectiveness of statins (statin users vs non-users) over time, up to the study end date. An LMM was built for triglycerides, total cholesterol, HDL-c and LDL-c and then stratified for statin therapy intensity. For each model, an unstructured matrix with random intercepts was used to estimate within-individual variance and between-individual variance. Furthermore, interaction terms (time × statin) were created to determine whether changes over time in the lipid profile differed significantly as a function of statin exposure.
In patients exposed to statins (n = 156), we compared triglyceride, total cholesterol, HDL-c and LDL-c concentrations on statin initiation (using Wilcoxon's signed-rank sum tests) with those measured at each annual, extensive clinical check-up for a period corresponding to the median duration of statin exposure (i.e. around 5 years). We ensured that there was a period of at least 3 months between statin initiation and the first set of lab results following statin initiation. Those comparisons were stratified for statin therapy intensity.
The threshold for statistical significance was set to P < .05. All analyses were performed using R software (version 4.0.5, R Foundation for Statistical Computing, Vienna, Austria).
Ethical aspects
In line with the French legislation on retrospective analyses of routine clinical practice, patients were not required to give their informed consent. On admission to hospital, however, patients could refuse the use of their medical data for research purposes. The study protocol was approved by an institutional committee with competency for studies not requiring approval by an investigational review board and was registered with the French National Data Protection Commission (Commission Nationale de l'Informatique et des Libertés, Paris, France; reference: PI2019_843_0055).
RESULTS
Baseline demographic characteristics
A total of 318 consecutive patients having received a kidney transplant between 1 January 2006 and 13 February 2019, met the inclusion criteria and so were included in the present study. The median (IQR) length of follow-up was 6.0 (3.9–10.0) years. Sixty-nine (21.7%) KTRs were not followed up until the study end date for the following reasons: 48 (15.1%) were lost to follow-up [including 37 (11.6%) with no reason stated in the patient's electronic health records and 11 (3.5%) who moved], 20 (6.3%) who went back on dialysis and 1 (0.3%) who died of an infection. Of these 318 KTRs, 204 (64.2%) were men. At the time of transplantation, the mean ± SD age of the study population was 45.7 ± 13.1 and the mean BMI (IQR) was 23.8 (21.1–27.5) kg/m2. Twenty-four (7.5%) patients had diabetes mellitus at the time of transplantation, and 35 (11.0%) patients had a history of CV events before transplantation. Seventy-four (23.3%) patients were receiving maintenance therapy with cyclosporine at baseline (Table 1).
Description of treatments with statins and other cholesterol-lowering drugs
Among the 318 KTRs included in the present study, 156 (49.1%) were exposed to statins during the study period. In all cases, the indication for statin therapy was to improve the lipid profile. The median (IQR) time interval between transplantation and statin initiation was 12.1 (5.5–36.1) months. The median (IQR) duration of statin exposure was 4.7 (2.6–7.0) years, which corresponds to a median percentage (IQR) of 71.0% (44.7–90.1) of the total follow-up time (Fig. 1).
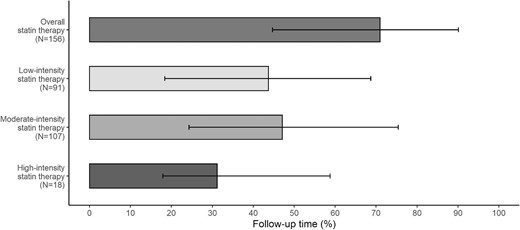
Median statin exposure time, as a percentage of the follow-up time. Error bars correspond to the IQR. N, number of patients.
During the study period, these 156 KTRs received several statins at different treatment intensities: 91 (58.3%), 107 (68.6%) and 18 (11.5%), respectively, received at least low-, moderate- or high-intensity statin therapy. The median percentage (IQR) of the total follow-up time exposed to low-, moderate- and high-intensity statin therapies was 43.7% (18.4–68.7), 47.1% (24.3–75.4) and 31.2% (17.9–58.8), respectively (Fig. 1).
Factors associated with the use of statins are described in Supplementary data, Table S9.
During the study period, some patients received cholesterol-lowering drugs other than statins: 9 (2.8%) received fibrates (including 8 KTRs having received at least one statin) for a median (IQR) duration of 1.0 (1.0–2.0) years and 11 (3.5%) received ezetimibe (including 10 KTRs having received at least one statin) for a median (IQR) duration of 2.0 (2.0–5.0) years.
Description of CV events
Twenty-seven ischemic CV events occurred in 26 (8.5%) KTRs during the follow-up, which corresponds to an incidence of 12.5 atherosclerotic CV events per 1000 person-years. Of these 26 patients, 12 (46.2%) experienced a myocardial infarction (including 7 patients requiring angioplasty or stenting), 7 (26.9%) experienced peripheral vascular stenosis requiring angioplasty or stenting, 5 (19.2%) experienced angina pectoris (including 3 patients requiring angioplasty or stenting) and 2 (7.7%) experienced stroke (1 of which was fatal). One patient experienced two separate episodes of angina pectoris. Four (15.4%) of the 26 patients had a history of CV events before transplantation: obliterating arteriopathy of the lower limbs in 3 cases and stroke in 1 case. The median (IQR) time interval between transplantation and the onset of the ischemic CV event was 5.9 (2.3–7.1) years. Eleven (42.3%) of the 26 patients were being treated with statins at the time of the ischemic CV event (including 5 patients with low-intensity statin therapy and 6 with moderate-intensity statin therapy). The incidence of atherosclerotic CV events was 8.6 per 1000 person-years in KTRs treated with statins and 18.2 per 1000 person-years in KTRs not treated with statins (P = .068). The median (IQR) time interval between transplantation and statin initiation was 11.5 (5.7–13.3) months and the median (IQR) duration of statin exposure before the atherosclerotic CV event was 4.7 (1.8–6.4) years. The median (IQR) serum creatinine measurement immediately prior to the atherosclerotic CV event was 18.6 (13.3–22.8) mg/L, corresponding to an eGFR (IQR) of 37 (26.25–55) mL/min/1.73 m2 (Supplementary data, Table S10).
In non-adjusted analyses, atherosclerotic CV events were associated with older age [hazard ratio (HR) 1.04 (95% CI 1.01–1.07)], thyroid disorders [HR 3.45 (1.23–9.66)], uncontrolled diabetes mellitus [vs no diabetes mellitus, HR 3.82 (1.55–9.43)], left ventricular hypertrophy [HR 3.03 (1.39–6.59)], time on dialysis before transplantation [HR 1.08 (1.02–1.15)], DSAs prior to transplantation [vs no DSA, HR 14.31 (2.81–72.94)], the use of intravenous immunoglobulins as the induction immunosuppressive therapy [HR 6.90 (2.21–21.54)], the use of antiplatelet agents [HR 3.30 (1.42–7.66)], higher serum phosphate concentrations [HR 2.29 (1.14–4.58)] and higher triglyceride concentrations [HR 1.46 (1.12–1.88)] (Supplementary data, Table S9).
In addition to these atherosclerotic CV events, 22 non-atherosclerotic CV events occurred in 20 KTRs: 18 (90.0%) had a rhythm disorder and 2 (10.0%) had heart failure. The median (IQR) time interval between transplantation and onset of the non-atherosclerotic CV event was 1.9 (1.0–4.3) years. None of the non-atherosclerotic CV events was fatal. One patient experienced an atherosclerotic CV event (myocardial infarction) prior to a non-ischemic CV event (heart failure). Five (25.0%) of these patients were being treated with statins at the time of the non-ischemic CV event (low-intensity statin therapy in one patient and moderate-intensity statin therapy in four). Six (30.0%) of these patients had already experienced the CV event of interest prior to transplantation (rhythm disorders in five cases, and heart failure in one).
Associations between statin exposure and CV events
In the Cox model fitted with IPTW, statin exposure was not associated with atherosclerotic CV events [HR 1.16 (95% CI 0.53–2.53)]. When stratified for low-, moderate- and high-intensity statin therapy, the HRs (95% CI) were 1.43 (0.52–3.93), 1.30 (0.48–3.50) and 1.10 (0.10–10.30), respectively (Fig. 2).
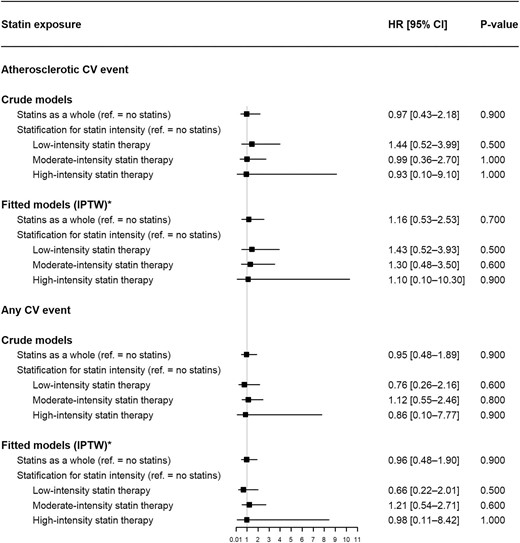
Associations between statin exposure and CV events (Cox proportional hazard models). *Variables used for estimation of the time-varying IPTW: (i) age at transplantation, sex, ethnic group, history of CV events before transplantation, DSAs at transplantation, hemodialysis duration before transplantation and serum homocysteine at transplantation (for time-fixed variables) and (ii) BMI, alcohol consumption, smoking, thyroid disorders, diabetes mellitus, sedentary lifestyle, hypertension, left ventricular hypertrophy, acute renal rejection, immunosuppressant therapy, antiplatelet agents, anticoagulant drugs, the use of fibrates and ezetimibe, serum phosphate, potassium, albumin, CRP, hemoglobin, eGFR, proteinuria, triglycerides and LDL-c (for time-varying variables).
Statin exposure (whether stratified for therapy intensity or not) was not associated with the “all CV events” variable (Fig. 2).
Biochemical effectiveness of statins
In the population as a whole, the application of linear mixed models showed that statin exposure (vs no exposure) was associated with (i) a significant decrease in concentrations of triglycerides (P < .001), total cholesterol (P < .001) and LDL-c (P < .001) and (ii) a significant post-transplantation increase over time in the HDL-c concentration (P < .001). When stratified for statin therapy intensity (ref. = no statins), low-intensity statin therapy was not associated with a significant decrease in concentrations of triglycerides (P = .150) or LDL-c (P = .473). Moderate-intensity statin therapy was associated with a significant decrease in concentrations of triglycerides (P < .001) and LDL-c (P < .001), and high-intensity statin therapy was associated with a significant decrease in the LDL-c concentration (P < .001) (Table 2).
In KTRs having received statins (n = 156), the median (IQR) LDL-c concentration was 2.88 (2.28–3.30) mmol/L upon statin initiation and 2.65 (2.05–3.32) mmol/L after 1 year of statin exposure; this decrease was statistically significant (P < .01). The significant decrease lasted for 5 years of statin exposure, which corresponded approximately to the median duration of exposure. When stratified for the intensity of statin therapy, this decrease was larger for high-intensity statin therapy (P < .001) (Fig. 3). The changes were significant for total cholesterol (Fig. 4) but not for HDL-c or triglycerides (Figs 5 and 6).
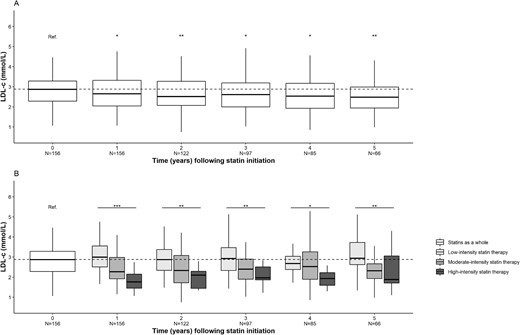
Changes over time in the LDL-c concentration after statin initiation. (A) Statins as a whole. (B) Stratification for statin therapy intensity. *P < .05, **P < .01, ***P < .001. N, number of patients.
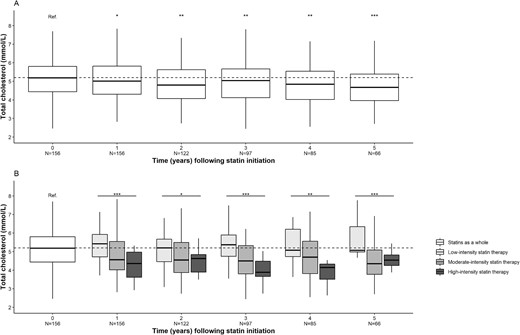
Changes over time in the total cholesterol concentration after statin initiation. (A) Statins as a whole. (B) Stratification for statin therapy intensity. *P < .05, **P < .01, ***P < .001. N, number of patients.
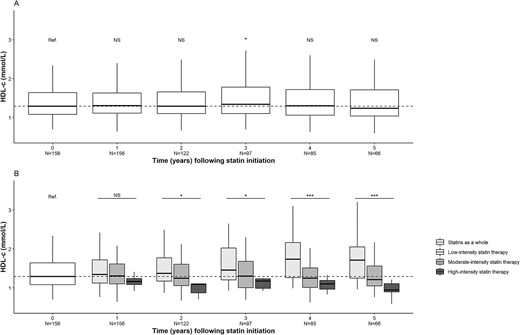
Changes over time in the HDL-c concentration after statin initiation. (A) Statins as a whole. (B) Stratification for statin therapy intensity. *P < .05, ***P < .001. N, number of patients; NS, not significant.
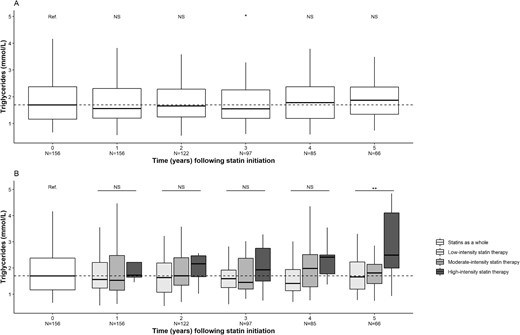
Changes over time in the triglyceride concentration after statin initiation. (A) Statins as a whole. (B) Stratification for statin therapy intensity. *P < .05, **P < .01. N, number of patients; NS, not significant.
Statin-induced ADRs
Of the 156 statin users, 12 (7.7%, corresponding to an incidence of 14.7 per 1000 person-years) experienced one or more ADRs related to statins, including 8 patients with myalgia, 1 with cholestasis, 1 with erectile dysfunction, 1 with abdominal pain, and 1 with concomitant myalgia, asthenia and dizziness. All of these ADRs were serious because they led to an “other medically important condition.” None of the ADRs led to hospitalization, a life-threatening event or death. Statins were the sole suspect drugs in 10 (83.3%) cases. According to the Naranjo probability scale score, these ADRs were “probable” in three (25.0%) cases and “possible” in nine (75.0%) cases. With the exception of erectile dysfunction, all the reported types of ADR were mentioned in the respective statin's summary of product characteristics. The patient having reported erectile dysfunction was also taking bisoprolol, a drug known to induce this ADR.
DISCUSSION
Compared with the general population, KTRs have a higher risk of CV events. While successful transplantation can reduce this risk significantly, KTRs still have an annual CV event rate of 3.5%–5% [11]. When compared with their age-matched peers, KTRs have a 3- to 5-fold greater risk of CV disease [22]. Over 50% of CV-related deaths in KTRs are sudden and are presumed to result from cardiac arrhythmia or cardiac arrest [23]. Thus, non-atherosclerotic cardiac disease appears to be particularly important in this patient population. In the literature, CV risk factors in KTRs include conventional risk factors (hypertension, diabetes mellitus, smoking, dyslipidemia and obesity) and non-conventional risk factors (renal impairment, proteinuria, immunosuppressants, left ventricular hypertrophy, anemia, acute rejection episodes, high plasma homocysteine concentrations and inflammation) [24, 25]. In our present focus on atherosclerotic CV events, we did not evidence a significant decrease in the incidence of atherosclerotic CV events in KTRs exposed to statins indicated for primary CV prevention, despite an improvement in the lipid profile (i.e. reductions in the LDL-c concentrations). Nevertheless, the LDL-c target (<2.59 mmol/L, according to the KDIGO guidelines [11]) was not achieved after 1 year of statin use; the median concentration in our study participants was 2.65 mmol/L.
Statins inhibit 3-hydroxy-3-methylglutaryl–coenzyme A reductase, which leads to a fall in the concentration of LDL-c, a major risk factor for CV events [26]. Moreover, statins reduce the CV risk through an anti-inflammatory effect involving the NLRP3 inflammasome and toll-like receptor pathways; this leads to a decrease in the concentration of high-sensitivity CRP [27–29], modulates the immune system's activity and protects tissues in some disease settings (e.g. ischemic stroke) [30, 31].
In the general population, the use of statins has an undeniably beneficial effect when prescribed for secondary prevention, i.e. to patients with a very high CV risk [32]. For primary CV prevention, the European Society of Cardiology and the European Atherosclerosis Society recommend LDL-c reduction through the use of statins in particular, and depending on other CV risk factors (mainly age, sex, systolic blood pressure and smoking) [33].
However, evidence of benefit for statins in CKD patients is sparse. The AURORA study group conducted a prospective, randomized, placebo-control trial of rosuvastatin in 2776 patients on maintenance hemodialysis. The statin had no significant effect (vs placebo) on the composite primary endpoint {death from CV causes, nonfatal myocardial infarction or nonfatal stroke [HR 0.96 (95% CI 0.84–1.11), P = .59} [5]. In a study by Wanner et al., 1225 patients with type 2 diabetes mellitus undergoing maintenance hemodialysis received either atorvastatin or placebo. Even though the median LDL-c concentration fell by 42%, there was no significant difference in the composite primary CV endpoint (CV death, nonfatal myocardial infarction and stroke) between the atorvastatin and placebo groups. However, the incidence of cardiac events was lower in the atorvastatin group [RR 0.82 (95% CI 0.68–0.99), P = .03] [34].
Even though KTRs have a high risk of CV events, there are few studies of statins and atherosclerotic CV events. Like our present work, none of the published studies found that statin use reduced the atherosclerotic CV risk. However, statins are recommended in the treatment guidelines for KTRs [10]. In 2013, the KDIGO organization developed a clinical practice guideline on lipid management for all adults and children with CKD, including KTRs [35]. On the basis of the Assessment of Lescol in Renal Transplantation (ALERT) randomized trial, the KDIGO working group suggested that statins improve CV outcomes [7]. In this trial, the risk reduction in the fluvastatin group (n = 1050) was similar to that in the placebo group [n = 1052; RR 0.83 (95% CI 0.64–1.06)] for the primary endpoint (i.e. the first occurrence of a major adverse cardiac event, defined as cardiac death, nonfatal myocardial infarction or coronary artery bypass). Furthermore, the results were statistically significant [RR 0.65 (0.48–0.88)] for the secondary endpoint (cardiac death and nonfatal myocardial infarction combined) [7]. However, the ALERT extension study showed a significantly greater reduction in the incidence of myocardial infarction and cardiac death among fluvastatin-treated patients than among placebo-treated patients after 5 years of follow-up [36].
In 2021, the results of a retrospective, single-center study of a cohort of 622 KTRs failed to show a protective role of statins for CV events and CV mortality [HR 0.81 (95% CI 0.53–1.24)] [37]. Anderson et al.’s study used a Cox proportional hazards model that included statins as binary covariate with a PS matching method, whereas we built a Cox proportional hazards model fitted with time-varying IPTW that included statins as a time-dependent covariate. However, the results of Anderson et al.’s study are consistent with our findings.
In 2023, the results of a large cohort study using the USRDS showed that statin exposure was significantly associated with a reduction in all-cause mortality [adjusted HR 0.95 (95% CI 0.90–0.99)]. However, the causes of mortality (including atherosclerotic CV events) were not reported. Furthermore, patients without Medicare insurance were not included in the study; hence, the patient selection criteria differed from those in our present study [9].
In KTRs treated with cyclosporine, a pharmacokinetic interaction with pravastatin would (in theory) increase serum cyclosporine concentrations via the competitive inhibition of P-glycoprotein (P-gp)/multidrug resistant protein 2 [38]; in turn, the inhibition might increase cyclosporine's cardiotoxicity. However, this interaction has not been proven clinically [39]. In our cohort, only six KTRs with an atherosclerotic CV event were being treated with both pravastatin and cyclosporine; before the CV event, the six patients’ plasma cyclosporine concentrations were in the normal range.
Regarding the safety of statin therapy, 12 (7.7%) KTRs in our cohort experienced ADRs (mostly myalgia). There were no serious ADRs; this observation is in line with the safety data from the ALERT randomized trial [7]. The ADR rate might have been underreported, which is a major limitation of pharmacovigilance studies in general [40]. Nevertheless, the fact that we always reviewed the statin users’ electronic health records probably minimized the underreporting bias. However, some ADRs might not have been reported in the electronic health records. Of the 12 KTRs reporting a statin-related ADR, five (41.7%) were also being treated concomitantly with cyclosporine. In theory, a pharmacokinetic interaction between these drugs is possible. Pharmacokinetic interactions might result in cyclosporine-treated patients being exposed to higher systemic concentrations of statins [41]: (i) cyclosporine inhibits CYP3A4, which metabolizes all statins [42], and (ii) P-gp and OATP1B1 are inhibited by cyclosporine, which leads to reduced hepatic uptake and increased statin exposure of smooth muscle [43, 44]. Unfortunately, we did not assay plasma statin concentrations in patients with probable statin-induced ADRs.
Our study had several limitations. First, the absence of significant results for clinical outcomes might have been related to a lack of statistical power. Secondly, the study's observational and retrospective design prevented us from forming similar comparator groups. Thirdly, the Cox models did not account for a possible post-discontinuation protective effect of statins. However, recent studies have shown the effect of statins on high-risk patients with dyslipidemia is not persistent [45], and data on the long-term effects of statins in KTRs are lacking. Lastly, we cannot be sure that all the study participants were fully compliant with their various treatments.
Our study had several strengths. First, the use of a Cox model with a time-varying covariable considered changes over time in drug exposure and thus reflected real-life clinical practice. Moreover, the use of a time-varying IPTW allowed us to account for time-varying confounders and thus reduce residual confounding bias. However, it should be borne in mind that comparisons using this type of adjustment are not as robust as those in a randomized controlled trial. Secondly, all known conventional and non-conventional CV risk factors in KTRs were taken into account with the exception of diet, for which data were not available. Moreover, physical activity was not assessed with a standardized questionnaire, and the nephrologist recorded subjectively whether or not a given patient had a sedentary lifestyle. Thirdly, data on all the patients’ prescriptions were available (allowing us to accurately estimate statin exposure periods) and all CV events were recorded in the patients’ electronic health records. Lastly, the study's single-center design ensured that the population was homogeneous in terms of management and assessment.
CONCLUSION
In a retrospective study of a cohort of KTRs and despite an improvement in lipid profiles, the use of statins (whether indicated for primary and/or secondary CV prevention) was not associated with a reduction in atherosclerotic CV events. Larger, controlled studies are needed to confirm or refute these results.
ACKNOWLEDGEMENTS
We thank David Fraser PhD (Biotech Communication SARL, Ploudalmézeau, France) for editorial advice and copy-editing assistance.
FUNDING
This research did not receive any specific funding from agencies in the public, commercial or not-for-profit sectors.
AUTHORS’ CONTRIBUTIONS
C.N. contributed to the conception/design of the work, acquisition, analysis and interpretation of data for the work, and drafting the manuscript. She approved the version to be published, and agrees to be accountable for all aspects of the work in ensuring that questions related to the accuracy or integrity of any part of the work are appropriately investigated and resolved. S.L. contributed to the conception/design of the work, interpretation of data for the work and drafting the manuscript. She approved the version to be published, and agrees to be accountable for all aspects of the work in ensuring that questions related to the accuracy or integrity of any part of the work are appropriately investigated and resolved. F.B. contributed to the interpretation of data for the work and drafting the manuscript. He approved the version to be published, and agrees to be accountable for all aspects of the work in ensuring that questions related to the accuracy or integrity of any part of the work are appropriately investigated and resolved. A.N. contributed to the acquisition of data for the work. He approved the version to be published, and agrees to be accountable for all aspects of the work in ensuring that questions related to the accuracy or integrity of any part of the work are appropriately investigated and resolved. Y.B. revised the work critically for important intellectual content. He approved the version to be published, and agrees to be accountable for all aspects of the work in ensuring that questions related to the accuracy or integrity of any part of the work are appropriately investigated and resolved. S.M.L. revised the work critically for important intellectual content. She approved the version to be published, and agrees to be accountable for all aspects of the work in ensuring that questions related to the accuracy or integrity of any part of the work are appropriately investigated and resolved. S.B. revised the work critically for important intellectual content. She approved the version to be published, and agrees to be accountable for all aspects of the work in ensuring that questions related to the accuracy or integrity of any part of the work are appropriately investigated and resolved. V.G.-C. revised the work critically for important intellectual content. She approved the version to be published, and agrees to be accountable for all aspects of the work in ensuring that questions related to the accuracy or integrity of any part of the work are appropriately investigated and resolved. K.M. revised the work critically for important intellectual content. He approved the version to be published, and agrees to be accountable for all aspects of the work in ensuring that questions related to the accuracy or integrity of any part of the work are appropriately investigated and resolved. G.C. contributed to the conception/design of the work, revised the work critically for important intellectual content, approved the version to be published, and agrees to be accountable for all aspects of the work in ensuring that questions related to the accuracy or integrity of any part of the work are appropriately investigated and resolved. B.B. contributed to the conception/design of the work, acquisition, analysis and interpretation of data for the work, and drafting the manuscript. He approved the version to be published, and agrees to be accountable for all aspects of the work in ensuring that questions related to the accuracy or integrity of any part of the work are appropriately investigated and resolved.
DATA AVAILABILITY STATEMENT
The data underlying this article are available in the article and in its online Supplementary data.
CONFLICT OF INTEREST STATEMENT
The authors declare that they have no competing interests. The results presented here have not been published previously in whole or part, except in abstract format.


Comments