


ABSTRACT
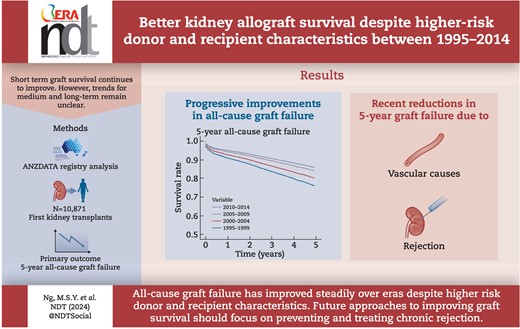
Advances in organ procurement, surgical techniques, immunosuppression regimens, and prophylactic antibiotic therapies have dramatically improved kidney transplant graft failure. It is unclear how these interventions have affected longer-term graft failure. It is hypothesized that graft failure has improved over the last 20 years.
Data on all first kidney transplants from 1995 to 2014 were extracted from the Australia and New Zealand Dialysis and Transplant Registry with follow-up as of 31 December 2021. Primary exposure was transplant era, classified into 5-year intervals. Primary outcome was all-cause 5-year graft failure. Secondary outcomes included all-cause 10-year graft failure and cause-specific graft failure. Kaplan–Meier curves and multivariable Cox proportional hazards regression models were used to assess trends in all-cause graft failure. Fine–Gray subdistribution hazard models verified that changes in death rates were not biasing the Cox proportional hazards regression models. Cumulative incidence functions were used to assess temporal trends in cause-specific graft failure.
Across 10 871 kidney transplants, there was a shift towards transplanting more recipients aged >45 years old, with more comorbidities, longer dialysis vintage, body mass index >30 kg/m2, and greater human leukocyte antigen mismatches. Donor age has increased but no clear shift in donor source was observed. Compared to 1995–99 (reference), the adjusted hazard ratio for 5-year graft failure was 0.78 (95% CI 0.67–0.91), 0.70 (95% CI 0.59–0.83), and 0.60 (95% CI 0.50–0.73) for 2000–04, 2005–09, and 2010–14, respectively. Ten-year graft failure similarly reduced from 0.83 (95% CI 0.74–0.93) for 2000–04 to 0.78 (95% CI 0.68–0.89) for 2010–14, compared to 1995–99.
Medium- and long-term all-cause graft failure has improved steadily since 1995–99. Significant reductions in graft failure due to rejection and vascular causes were observed at 5 years, and due to rejection, vascular causes, death, and glomerular disease at 10 years.
 Watch the video of this contribution at https://dbpia.nl.go.kr/ndt/pages/author_videos
What was known:
Advances in organ procurement, surgical techniques, immunosuppression regimens, and prophylactic antibiotic therapies have dramatically improved short-term graft outcomes
Effect on medium- and longer-term term graft outcomes is less clear
This study adds:
Analysis of 10 871 first kidney transplants between 1995 and 2014 identified a shift towards transplanting higher-risk donors and recipients
There were incremental improvements in 5- and 10-year graft failure
Improvement in graft failure persisted whether graft failure due to death was handled as a cause of graft failure or as competing event
Potential impact:
In the most contemporary era examined (transplanted 2010–14), death with a functioning graft has become the leading cause of graft failure, followed by rejection
This study highlights the need for future approaches to improve graft failure that focus particularly on improving patient survival and preventing or treating chronic rejection
INTRODUCTION
Before the arrival of cyclosporin in the late 1970s, 1-year graft survival rates were between 20% and 80% depending on the study and transplant type [1]. Today, one can expect a 1-year graft survival rate of >90% across most jurisdictions [2–4]. This mammoth leap in short-term graft survival is primarily attributed to advances in organ procurement and preservation, surgical techniques, immunosuppression regimens, and prophylactic antibiotic regimens [1, 5]. It follows that attention has shifted towards medium- and long-term graft outcomes where improvements are less apparent.
Key impediments to long-term graft failure include chronic rejection, infection, malignancy, and death with a functioning graft. Advances in early rejection prevention with the introduction of calcineurin inhibitors, mycophenolate, and triple immunosuppression introduced greater complications of infection, disseminated malignancy, metabolic syndrome, and cardiovascular disease—with implications for patient survival and long-term graft survival [1, 6–8]. Discoveries in cardiology, endocrinology, oncology, and infectious diseases have partially ameliorated these effects. Paradigm shifts in transplantation medicine to reduce immunosuppression and more carefully balance complications of over-immunosuppression against rejection risk are hoped to improve long-term clinical outcomes. However, the net sum of these practice changes on medium- to long-term graft outcomes in the modern era is not clear.
This study aimed to characterize trends in recipient and donor characteristics and in medium- and long-term graft failure in Australia and New Zealand first kidney transplants completed between 1995 and 2014, using data from the Australia and New Zealand Dialysis and Transplant (ANZDATA) Registry. We hypothesized that kidney graft failure has improved over time, despite transplanting in higher-risk donor and recipient settings.
MATERIALS AND METHODS
Sources of data
Ethical approval was acquired from the Metro North Human Research Ethics Committee (HREC/18/QRBW/354) and the data request was approved by ANZDATA (ANZREQ-17). All Australia and New Zealand transplant programmes and kidney units are mandated to submit data on transplant recipients. Transplant outcomes such as mortality, graft failure, and rejection were recorded in a continuous manner [9]. Primary kidney disease, acute rejection, and cause of graft failure were denoted by treating kidney specialist and may not be biopsy proven [9]. Follow-up data were available up until 31 December 2021.
Study population
People receiving their first kidney transplant in Australia and New Zealand between 1995 and 2014 were included in the analysis. Recipients were excluded from the analysis sample if they were under 18 years old at transplant, received multi-organ transplants, or had received any previous kidney transplant(s).
Study variables
Exposure was year of kidney transplant divided into 5-year intervals: 1995–99, 2000–04, 2005–09, and 2010–14. Covariates included primary kidney disease, recipient gender, recipient ethnicity, recipient age, smoking status, diabetes, coronary artery disease, peripheral vascular disease, dialysis vintage, recipient body mass index (BMI), human leukocyte antigen (HLA) mismatches, total ischaemia time, donor gender, donor age, donor type, and initial immunosuppression regimen. All covariates were recorded at the time of transplant. The initial immunosuppression regimen was immunosuppression regimen on discharge from hospital after kidney transplant procedure. Acute rejection was included as a covariate where recipients were categorized as positive for acute rejection if they experienced any episodes of acute rejection.
Study outcomes
The primary study outcome was all-cause 5-year graft failure. Secondary study outcomes were all-cause 10-year graft failure and cause-specific graft failure. Causes of graft failure were classified into rejection, glomerular disease, vascular, technical, miscellaneous, and death with functioning graft, as per Supplementary Table S1.
Statistical analysis
All analyses were completed in R version 4.3.0 (R Foundation for Statistical Computing, Vienna, Austria) [10]. Bivariate comparisons for demographic and outcome variables were evaluated using the χ2 test for proportions and t-test for means. Only patients with complete data for all variables of interest were included in the analyses. Multicollinearity was assessed with variance inflation factors and there was no significant multicollinearity among the explanatory variables.
Univariable and multivariable Cox proportional hazards models were used to estimate all-cause 5- and 10-year graft failure. Kaplan–Meier curves and adjusted survival curves based on the Cox models were used to visualize trends in all-cause 5- and 10-year graft failure stratified by kidney transplant era. All-cause 5-year graft failure (outcome) for each 5-year kidney transplant era interval (exposure) were compared using estimated conditional hazard ratios, as adjusted for the other variables in the multivariable Cox model. Interaction effects between the time intervals and other covariates were explored but were not found to be significant. The proportional hazards assumption was verified for all explanatory variables using log–log plots and Schoenfeld residuals. Pairwise post hoc comparisons were made using estimated marginal means.
Sensitivity analyses assessed the impact of including and excluding incomplete cases on unadjusted all-cause 5- and 10-year graft failure hazard ratios. In further sensitivity analyses, the outcome 5-year graft failure due to death with a functioning graft was treated as a competing event rather than as an outcome. Sensitivity analyses with competing risk regression for all-cause 5-year graft failure were completed using R package ‘mprsk: Subdistribution Analaysis of Competing Risks’. Estimation, testing, and regression modelling of subdistribution functions were completed as described by Fine and Gray [11]. Cumulative incidence functions were used to assess temporal trends in cause-specific graft failure.
RESULTS
Patient characteristics
Data on 16 552 kidney transplants were extracted from ANZDATA; 73 cases were excluded as recipients were <18 years old at time of transplant, 3463 were excluded due to previous transplant being outside of study dates, and 2145 cases were excluded due to missing data (Fig. 1). This left 10 871 first kidney transplants for analysis. The number of first kidney transplants increased steadily between 1995 and 2014 with 1939, 2312, 3023, and 3597 in 1995–99, 2000–04, 2005–09, and 2010–14, respectively. There was a shift towards transplanting people at an older age (P < 0.001), with more comorbidities [diabetes (P < 0.001), coronary artery disease (P < 0.001), peripheral vascular disease (P < 0.001)], longer dialysis vintage (P < 0.001), higher BMI (P < 0.001), and more HLA mismatches (P < 0.001) in more modern eras (Table 1). Donor age has also increased over time (P < 0.001, Table 1). For the entire cohort, all-cause graft failure rates were 4.3%, 5.5%, 10.2%, and 20.8%, at 1, 2, 5, and 10 years, respectively (Table 2). Death with functioning graft rates at 1-, 2-, 5-, and 10-year were 2.2%, 3.5%, 7.8%, and 16.9%, respectively (Table 2).

Flowchart of participants.
Variable: summary by transplant era.
| 1995–99 | 2000–04 | 2005–09 | 2010–14 | ||
|---|---|---|---|---|---|
| Characteristics | n = 1939 | n = 2312 | n = 3023 | n = 3597 | P value |
| Primary kidney disease | <.001 | ||||
| Glomerular disease | 962 (50%) | 1092 (47%) | 1355 (45%) | 1500 (42%) | |
| Diabetes | 247 (13%) | 346 (15%) | 408 (13%) | 625 (17%) | |
| ADPKD | 236 (12%) | 297 (13%) | 496 (16%) | 537 (15%) | |
| Reflux nephropathy | 193 (10%) | 181 (7.8%) | 257 (8.5%) | 213 (5.9%) | |
| Hypertension | 62 (3.2%) | 79 (3.4%) | 136 (4.5%) | 228 (6.3%) | |
| Other | 239 (12%) | 317 (14%) | 371 (12%) | 494 (14%) | |
| Recipient gender | .034 | ||||
| Female | 756 (39%) | 898 (39%) | 1124 (37%) | 1315 (37%) | |
| Male | 1183 (61%) | 1414 (61%) | 1899 (63%) | 2282 (63%) | |
| Recipient ethnicity | <.001 | ||||
| White | 1590 (82%) | 1899 (82%) | 2483 (82%) | 2766 (77%) | |
| Asian | 152 (7.8%) | 183 (7.9%) | 294 (9.7%) | 416 (12%) | |
| Maori | 109 (5.6%) | 128 (5.5%) | 122 (4.0%) | 227 (6.3%) | |
| ATSI | 75 (3.9%) | 84 (3.6%) | 99 (3.3%) | 113 (3.1%) | |
| Other | 13 (0.7%) | 18 (0.8%) | 25 (0.8%) | 75 (2.1%) | |
| Recipient age, years, median (IQR) | 46 (19) | 48 (20) | 49 (20) | 52 (19) | <.001 |
| Recipient age, group, years | <.001 | ||||
| 18–44 | 900 (46%) | 954 (41%) | 1160 (38%) | 1186 (33%) | |
| 45–54 | 530 (27%) | 667 (29%) | 812 (27%) | 888 (25%) | |
| 45–64 | 420 (22%) | 525 (23%) | 792 (26%) | 1041 (29%) | |
| 65+ | 89 (4.6%) | 166 (7.2%) | 259 (8.6%) | 482 (13%) | |
| Smoking status | <.001 | ||||
| Current | 256 (13%) | 292 (13%) | 337 (11%) | 367 (10%) | |
| Former | 620 (32%) | 751 (32%) | 967 (32%) | 1296 (36%) | |
| Never | 1063 (55%) | 1267 (55%) | 1718 (57%) | 1925 (54%) | |
| Diabetes | 299 (15%) | 421 (18%) | 543 (18%) | 837 (23%) | <.001 |
| Coronary artery disease | 188 (9.7%) | 331 (14%) | 496 (16%) | 699 (19%) | <.001 |
| Peripheral vascular disease | 129 (6.7%) | 211 (9.1%) | 259 (8.6%) | 390 (11%) | <.001 |
| Dialysis vintage, years, median (IQR) | 1.80 (2.44) | 2.18 (3.00) | 2.00 (3.49) | 2.19 (3.69) | <.001 |
| Dialysis vintage, years | <.001 | ||||
| Pre-emptive | 85 (4.4%) | 183 (7.9%) | 430 (14%) | 399 (11%) | |
| <1 | 187 (9.6%) | 171 (7.4%) | 216 (7.1%) | 278 (7.7%) | |
| 1–3 | 974 (50%) | 954 (41%) | 1087 (36%) | 1259 (35%) | |
| 3+ | 693 (36%) | 1004 (43%) | 1290 (43%) | 1661 (46%) | |
| Recipient BMI, kg/m2 | <.001 | ||||
| <25 | 1012 (52%) | 1062 (46%) | 1331 (44%) | 1404 (39%) | |
| 25–29.9 | 642 (33%) | 818 (35%) | 1081 (36%) | 1270 (35%) | |
| 30+ | 285 (15%) | 432 (19%) | 611 (20%) | 923 (26%) | |
| HLA mismatches | <.001 | ||||
| 0–1 | 376 (19%) | 350 (15%) | 396 (13%) | 409 (11%) | |
| 2–4 | 1216 (63%) | 1322 (57%) | 1697 (56%) | 1909 (53%) | |
| 5–6 | 347 (18%) | 640 (28%) | 930 (31%) | 1279 (36%) | |
| Total ischaemia time, hours, median (IQR) | 14 (9) | 12 (12) | 8 (10) | 9 (9) | <.001 |
| Total ischaemia time, hours | <.001 | ||||
| <12 | 654 (34%) | 1072 (46%) | 1933 (64%) | 2382 (66%) | |
| 12–18 | 763 (39%) | 832 (36%) | 811 (27%) | 960 (27%) | |
| 18+ | 522 (27%) | 408 (18%) | 279 (9.2%) | 255 (7.1%) | |
| Donor gender | <.001 | ||||
| Female | 857 (44%) | 1003 (43%) | 1510 (50%) | 1790 (50%) | |
| Male | 1082 (56%) | 1309 (57%) | 1513 (50%) | 1807 (50%) | |
| Donor age, years, median (IQR) | 42 (27) | 45 (25) | 48 (21) | 49 (22) | <.001 |
| Donor age group, years | <0.001 | ||||
| <18 | 209 (11%) | 188 (8.1%) | 165 (5.5%) | 161 (4.5%) | |
| 18–44 | 875 (45%) | 922 (40%) | 1086 (36%) | 1270 (35%) | |
| 45–54 | 425 (22%) | 622 (27%) | 810 (27%) | 904 (25%) | |
| 55–64 | 316 (16%) | 430 (19%) | 704 (23%) | 843 (23%) | |
| 65+ | 114 (5.9%) | 150 (6.5%) | 258 (8.5%) | 419 (12%) | |
| Donor type | <.001 | ||||
| Deceased | 1577 (81%) | 1689 (73%) | 1725 (57%) | 2513 (70%) | |
| Living | 362 (19%) | 623 (27%) | 1298 (43%) | 1084 (30%) | |
| Acute rejection | |||||
| Total number of acute rejection episodes | 699 | 1207 | 1300 | 1443 | N/A |
| Participants with ≥1 acute rejection episode | 463 (24%) | 818 (35%) | 888 (29%) | 1045 (29%) | <.001 |
| Anti-thymocyte globulin | 94 (4.8%) | 129 (5.6%) | 104 (3.4%) | 151 (4.2%) | .001 |
| Steroids | <.001 | ||||
| Steroid | 1772 (91%) | 2224 (96%) | 2973 (98%) | 3547 (99%) | |
| None | 167 (8.6%) | 88 (3.8%) | 50 (1.7%) | 51 (1.4%) | |
| Mechanistic target of rapamycin inhibitor | <.001 | ||||
| Everolimus | 12 (0.6%) | 34 (1.5%) | 70 (2.3%) | 19 (0.5%) | |
| Sirolimus | 173 (8.9%) | 88 (3.8%) | 32 (1.1%) | 3 (<0.1%) | |
| Neither | 1754 (90%) | 2190 (95%) | 2921 (97%) | 3575 (99%) | |
| Calcineurin inhibitor | <.001 | ||||
| Ciclosporin | 1811 (93%) | 1698 (73%) | 1300 (43%) | 582 (16%) | |
| Tacrolimus | 66 (3.4%) | 552 (24%) | 1611 (53%) | 2933 (82%) | |
| Neither | 62 (3.2%) | 62 (2.7%) | 112 (3.7%) | 82 (2.3%) | |
| Anti-metabolite | <.001 | ||||
| Azathioprine | 994 (51%) | 78 (3.4%) | 25 (0.8%) | 12 (0.3%) | |
| Mycophenolate | 704 (36%) | 2048 (89%) | 2905 (96%) | 3503 (97%) | |
| Neither | 241 (12%) | 186 (8.0%) | 93 (3.1%) | 82 (2.3%) |
Abbreviations: ADPKD = autosomal dominant polycystic kidney disease, ATSI = Aboriginal and Torres Strait Islander, IQR = interquartile range, NA = not applicable.
Crude proportions with transplant failure during follow-up, by transplant era.
| 1995–99 | 2000–04 | 2005–09 | 2010–14 | ||
|---|---|---|---|---|---|
| Outcome | n = 1939 | n = 2312 | n = 3023 | n = 3597 | P value |
| All-cause-graft failure | |||||
| 1 year | 143 (7.4%) | 123 (5.3%) | 113 (3.7%) | 91 (2.5%) | <.001 |
| 2 years | 173 (8.9%) | 150 (6.5%) | 140 (4.6%) | 135 (3.8%) | <.001 |
| 5 years | 303 (16%) | 258 (11%) | 261 (8.6%) | 283 (7.9%) | <.001 |
| 10 years | 505 (26%) | 487 (21%) | 520 (17%) | NA | <.001 |
| Death with functioning graft | |||||
| 1 year | 63 (3.2%) | 56 (2.4%) | 62 (2.1%) | 66 (1.8%) | .006 |
| 2 years | 90 (4.6%) | 91 (3.9%) | 93 (3.1%) | 109 (3.0%) | .005 |
| 5 years | 161 (8.3%) | 196 (8.5%) | 208 (6.9%) | 286 (8.0%) | .120 |
| 10 years | 340 (18%) | 407 (18%) | 482 (16%) | N/A | <.001 |
Trends in all-cause 5-year graft failure
There was a significant association between more recent era and better transplant survival, for both unadjusted and adjusted analyses. Compared to 1995–99 (reference), the adjusted hazard ratio for 5-year graft failure was 0.78 (95% CI 0.67–0.91), 0.70 (95% CI 0.59–0.83), and 0.60 (95% CI 0.50–0.73) for 2000–04, 2005–09, and 2010–14, respectively (Table 3). In addition to older era, other factors associated with shorter transplant survival included: recipient age >45 years old, recipient BMI >30 kg/m2, acute rejection, dialysis vintage >1 year before transplant, recipient smoking history, recipient diabetes, recipient coronary artery disease, donor age >45 years, ischaemia time >18 hours, and absence of calcineurin inhibitor in the initial immunosuppression regimen (Table 3). Living kidney donor, recipient male gender and mycophenolate in the initial immunosuppression regimen were associated with decreased all-cause 5-year graft failure risk (Supplementary Table S2).
Unadjusted and adjusted Cox model regression for 5-year all-cause graft failure.
| Unadjusted | Adjusted | |||
|---|---|---|---|---|
| Characteristics | HR (95% CI) | P value | AHR (95% CI) | P value |
| Transplant era | ||||
| 1995–99 | Reference | Reference | ||
| 2000–04 | 0.79 (0.69–0.90) | <.001 | 0.78 (0.67–0.91) | .002 |
| 2005–09 | 0.60 (0.53–0.69) | <.001 | 0.70 (0.59–0.83) | <.001 |
| 2010–14 | 0.61 (0.54–0.69) | <.001 | 0.60 (0.50–0.73) | <.001 |
Abbreviations: AHR = adjusted hazard ratio, CI = confidence interval, HR = hazard ratio.
Improvements in all-cause 5-year graft failure were more marked between earlier eras than between more recent eras, i.e. the magnitude of improvements in survival is reducing with time (Fig. 2a). This was confirmed using pairwise comparisons: difference in adjusted odds ratio for 5-year all-cause graft failure between 1995 and 1999 versus 2000–04 was 0.79 (95% CI 0.64–0.97) compared to 0.89 for 2005–09 versus 2010–14 (95% CI 0.75–1.05), Supplementary Table S3. Sensitivity analyses demonstrated that including incomplete cases (people with any missing data) would be unlikely to alter the hazard ratio direction or significance of the all-cause 5-year graft failure findings (Supplementary Table S4).
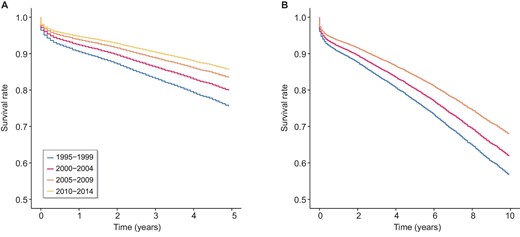
Adjusted 5-year (A) and 10-year (B) graft survival by transplant era.
Trends in 5-year graft failure with death as a competing risk
On sensitivity analyses, handling death as competing risk (rather than a cause of graft failure), improvements in all-cause 5-year graft failure in more recent transplant eras was also seen, with adjusted subdistribution hazard ratio 0.73 (95% CI 0.59–0.91) 2000–04, 0.60 (95% CI 0.47–0.75) in 2000–04, and 0.52 (95% CI 0.41–0.67) in 2010–14 (Supplementary Table S5). Effect modifiers of 5-year graft failure included recipient age, acute rejection episodes, dialysis vintage >3 years, recipient smoking history, recipient diabetes, recipient gender, donor age, and initial immunosuppression regimen (Supplementary Table S5).
Trends in all-cause 10-year graft failure
Similar to all-cause 5-year graft failure, adjusted hazard ratio for all-cause 10-year graft failure reduced from 0.83 (95% CI 0.74–0.93) for 2000–04 to 0.78 (95% CI 0.68–0.89) for 2005–09 (Table 4) compared to 1995–99 (reference) (Table 4). Recipient age >45 years old, recipient gender, HLA mismatches, recipient BMI >30, dialysis vintage >1 year, recipient smoking history, recipient diabetes, recipient coronary artery disease, recipient peripheral vascular disease, donor age >45 years old, donor type, total ischaemia time >18 hours, and initial immunosuppression regimen were effect modifiers of 10-year graft failure risk (Supplementary Table S6). The magnitude of the improvement in all-cause 10-year graft failure was greater comparing the two earlier versus the two more recent transplant eras (Fig. 2b). Sensitivity analyses demonstrated that including incomplete cases (people with any missing data) would be unlikely to alter the hazard ratio direction nor significance of the all-cause 10-year graft failure findings (Supplementary Table S7).
: Unadjusted and adjusted Cox model regression for 10-year all-cause graft failure.
| Unadjusted | Adjusted | |||
|---|---|---|---|---|
| Characteristics | HR (95% CI) | P value | AHR (95% CI) | P value |
| Transplant era | ||||
| 1995–99 | Reference | Reference | ||
| 2000–04 | 0.85 (0.77–0.93) | <.001 | 0.83 (0.74–0.93) | .002 |
| 2005–09 | 0.69 (0.63–0.75) | <.001 | 0.78 (0.68–0.89) | <.001 |
Abbreviations: AHR = adjusted hazard ratio, CI = confidence interval, HR = hazard ratio.
Trends in cause-specific graft failure
Cumulative incidence rates for 5-year graft failure due to specific causes of graft failure are presented in Supplementary Table 8: for vascular causes, rates reduced from 0.023 in 1995–99 to 0.008 in 2010–14; for rejection, rates reduced from 0.079 in 1995–99 to 0.020 in 2010–14. Adjusted subdistribution hazard ratios for graft failure due to technical causes, glomerular disease, miscellaneous causes, and death with a functioning graft, remained grossly unchanged. With longer 10-year follow-up, adjusted subdistribution hazard ratios for graft failure due to death with functioning graft, glomerular disease, rejection, vascular, and miscellaneous causes all reduced over the study period (Supplementary Table S9). The 5- and 10-year cumulative incidence plots support and summarize these findings (Figs 3, 4).
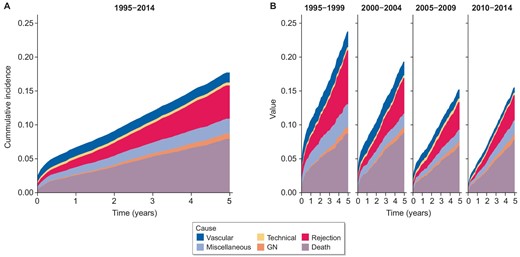
Cumulative incidence of cause-specific graft failure by time. Censored at 5 years post-transplant. (A) Transplant era 1995–2015. (B) Transplant era stratified by 5-year intervals.
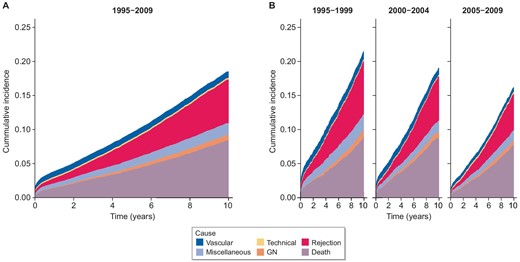
Cumulative incidence of cause-specific graft failure by time. Censored at 10 years post-transplant. (A) Transplant era 1995–2015. (B) Transplant era stratified by 10-year intervals.
DISCUSSION
We had hypothesized that kidney graft failure has reduced over time, despite transplanting in higher-risk donor and recipient settings. This study confirmed our hypothesis, and demonstrated that all-cause 5-year and 10-year graft failure has steadily improved between 1995 and 2014 in Australia and New Zealand, while the risk profile of kidney donors and recipients has increased. Progressing onwards from previous investigations in Europe and the USA [2, 12], our study provides a comprehensive binational overview of first kidney transplant outcomes into the modern era, with near-complete jurisdictional inclusion and follow-up, and detailed covariable data.
This study identified shifts towards transplanting older donors and recipients, with more recipient comorbidities, longer dialysis vintage, higher BMI, and increased HLA mismatches. This is consistent with observations in Europe using data from the Collaborative Transplant Study (CTS) where recipient and donor age, dialysis vintage, use of expanded criteria donors and HLA mismatches have increased between 1986–95 and 2006–15 [2]. Similarly, recipient age, BMI, diabetes, hypertension, and dialysis vintage were reported to increase between 1995–99 and 2014–17 in the USA [12]. Donor age remained similar over the study period in this Scientific Registry of Transplant Recipients (SRTR) analysis, probably reflecting regional differences in donor recruitment practices and donor pools [12]. Transplantation of recipients of older age with diabetes over time has also been observed in South Korea and Singapore [13, 14]. This global shift towards conducting higher-risk kidney transplants has coincided with improvements in kidney transplant medical care, including: (i) increased utilization of calcineurin inhibitors and mycophenolate, (iii) improved infection prophylaxis, and (iii) advances in metabolic syndrome management [1, 15, 16]—all of which have acted to successfully mitigate kidney transplant risks such that mortality and morbidity advantages over remaining on dialysis are maintained even in higher-risk subpopulations [17–20].
Despite transplanting higher-risk donor and recipients, all-cause 5- and 10-year graft failure steadily improved in successive eras in this study. This finding is consistent with international experience as recorded in CTS and SRTR analyses [2, 12, 21]. The 5-year graft failure reduced at a consistent rate between 1986–99 and 2000–15 in a CTS database analysis after controlling for donor age, recipient age, graft number, HLA mismatches, and panel reactive antibodies [2]. This study excluded death with a functioning graft from its graft failure outcome and living donor transplants; and included second and subsequent transplants and transplantations with donation after brain death only. The CTS database analysis also controlled for slightly different covariates than those considered in our study. In an SRTR analysis, 5-year all-cause graft failure also reduced consistently between 1995–99 and 2014–17 after adjusting for recipient age, recipient gender, primary kidney disease, recipient ethnicity, recipient BMI, recipient insurance type, dialysis vintage, graft number, donor age, and donor type [12]. Similar to the European analysis, this SRTR study also included repeat kidney transplants. In our analysis, improvements in 5-year graft failure were largest between earlier transplant eras after controlling for covariates. This is consistent with observations that earlier advances such as calcineurin inhibitors, mycophenolate, HLA matching, and organ preservation had greater effects on graft failure compared to more recent developments in organ allocation, rejection management, and preservation [15]. Further research is required to test this hypothesis in current and future eras, and to replicate our findings in other cohorts.
Previous studies investigating changes in all-cause graft failure over time did not assess cause-specific graft failure [2, 12, 22]. We identified a reduced hazard for 5- and 10-year graft failure secondary to rejection over the study period. Although reduction in acute rejection is widely reported [23, 24], this work is the first to quantify improvements in medium- and long-term graft failure due to rejection over time. Reduction in graft failure due to rejection coincide with immunosuppression regimen switch from cyclosporin/azathioprine to tacrolimus/mycophenolate and improved methods of monitoring for features of rejection such as kidney biopsy Banff criteria [1, 25, 26]. By comparison, only 10-year (but not 5-year) graft failure due to death or glomerular disease reduced over time, probably due to the longer lead time required to experience these outcomes. These results concur with a previous ANZDATA analysis of kidney transplants from 1980 to 2018 where most improvements in 1–10-year graft failure due to death with functioning graft occurred between 1980 to 1995 with a slower decline in incidence rates thereafter [27]. In another ANZDATA analysis investigating graft outcomes in kidney transplant recipients with glomerular disease, graft failure due to glomerular disease risk did not change significantly between 1998–05 and 2006–12 [28]. Notably, this study reported total glomerular disease-associated graft failure for people transplanted between 1990 and 2012 with data censoring at 31 December 2012 [28]. People transplanted in 2006–12 would have up to 6 years of follow-up, which may not be adequate to capture glomerular disease-associated graft failure. It is unclear whether reductions in glomerular disease-associated graft failure are due to reduced disease recurrence in the context of tacrolimus-mycophenolate immunosuppression era. The 10-year graft failure due to death with functioning graft reduced over the study period, probably reflecting advances in cardiovascular, endocrinological, malignancy, and infectious disease therapies. It is unclear whether improvements in death with functioning graft have been hindered by transplanting higher-risk recipients; those who are at greater likelihood of life-threatening complications.
A major strength of this study is the near-complete inclusion and follow-up of kidney transplant recipients across Australia and New Zealand. The ANZDATA Registry collects information on all patients receiving chronic dialysis or kidney transplantation in Australia and New Zealand for health service development and quality audits [23]. Information is provided by all kidney units on a mandatory basis [23]. Key events such as dialysis initiation, transplantation, death, and graft failure are provided in real time and a cross-section survey is completed on a yearly basis [23]. The near-complete inclusion and follow-up enabled the assessment of long-term graft outcomes and high generalizability of results to people with kidney transplants in Australia and New Zealand.
Limitations of this study include changes in graft failure cause classification over time, unadjusted confounders, and missing data. Classification of graft failure causes in ANZDATA changed over time with some categories [e.g. chronic antibody mediated rejection (biopsy proven), gradual graft failure (biopsy not proven)] being present for a portion of the study period. This issue was mitigated by grouping graft failure causes into five broad categories: rejection, vascular, technical, glomerular disease, and miscellaneous. Primary kidney disease and graft failure causes in ANZDATA are denoted by the treating kidney specialist and not necessarily biopsy proven, potentially leading to disease misclassification. Notably, most graft failure due to glomerular disease is biopsy proven in ANZDATA [29, 30]. Although many potential confounders were included as covariates, unmeasured confounders (e.g. immunosuppression drug compliance, and changes in immunosuppression regimen after hospital discharge) may have affected identified associations between transplant era and outcome. Last, this analysis excluded cases with missing data (Supplementary Tables S10, S11), potentially leading to selection bias. However, the number of cases with missing data was overall low (16%) and sensitivity analyses demonstrated that including all possible data would be unlikely to alter the hazard ratio direction or significance of the 5- and 10-year all-cause graft failure findings (Supplementary Tables S4 and S7).
This study is the first investigation of medium- and long-term kidney transplant survival in Australia and New Zealand as a function of transplant era. More recent transplant eras were associated with improvements in all-cause 5- and 10-year graft failure risk. Focusing on causes of graft failure, reductions in 5-year graft failure due to rejection and vascular causes, and in 10-year graft failure due to death, rejection, vascular causes, and glomerular disease were observed, suggesting that advances in transplant survival are not entirely explained by better prevention and treatment of acute rejection with modern immunosuppression.
ACKNOWLEDGEMENTS
We acknowledge the Australian and New Zealand nephrology community for providing information and maintaining the ANZDATA Registry database. The data reported here have been supplied by the Australia and New Zealand Dialysis and Transplant Registry (ANZDATA). The interpretation and reporting of these data are the responsibility of the Editors and in no way should be seen as an official policy or interpretation of the Australia and New Zealand Dialysis and Transplant Registry.
FUNDING
This work was funded by the 2020 Robert and Janelle Bird Postdoctoral Research Fellowship by the Royal and Brisbane Women's Hospital Foundation.
AUTHORS’ CONTRIBUTIONS
M.S.Y.N., A.J.M., and M.M.O.S. conceptualized study and interpreted data. All authors were involved in study design, data curation, and manuscript review/editing. A.T.J. completed statistical analyses. M.S.Y.N. wrote the original draft. A.J.M. and M.M.O.S. provided study supervision.
DATA AVAILABILITY STATEMENT
Applications to access this data can be made to the ANZDATA Registry as per data policies at https://www.anzdata.org.au/anzdata/services/data-policies/.
CONFLICT OF INTEREST STATEMENT
M.S.Y.N. has received travel sponsorship and grant funding from Avant Foundation. M.S.Y.N. has received Travel Award from the Australia and New Zealand Society of Nephrology. A.J.M. was supported by a Queensland Health Advancing Clinical Research Fellowship.
REFERENCES
Author notes
A.J.M. and M.M.O. contributed equally to this work as co-senior authors


Comments