


Abstract
Despite the rise in publications reporting Artificial Intelligence (AI) solutions in healthcare, their usage in clinical practice remains limited. Prominent barriers for their implementation in clinical practice are the lack of integration of AI-based tools in the hospital health information system and clinical workflows. We previously developed an AVF Failure risk score to assess the expected incidence of AVF failures within 3 months based on routinely collected dialysis data. The risk score showed high accuracy (AUC = 0.81) and calibration. Based on this risk score, we developed an AI-enhanced dashboard supporting the management of AVF in hemodialysis patients. The usability and usefulness of the AI-enhanced AVF management dashboard was evaluated in a pilot quality improvement program.
A quality improvement framework was used to evaluate the usability of an AI-enhanced dashboard for AVF management (Fig. 1A). First, healthcare professionals (HCP) were involved to provide inputs for model design, endpoint definition, and potential predictors through various qualitative interview techniques such as brainstorming sessions and focus groups (Phase I). A machine learning model was then developed to assess the expected incidence of AVF failure within 3 months. The model used routinely collected clinical data to minimize additional burden on clinical workflow. (Phase II). After developing and validating the model, a model error analysis was conducted using case studies methodology to improve model performance (Phase III). Once the model reached a good accuracy, think-aloud interview was used to abstract HCP needs and to design a user interface for model output. A user-friendly dashboard was developed to display the risk of AVF failure within 3-months and patient's vascular access history (Phase IV). This solution was integrated in the health record system and updated monthly with the latest risk score and medical information. A pilot quality improvement program was conducted in 15 clinics across 4 countries (IT, CZ, SK, SG) from May to December 2022. HCP were asked to evaluate their agreement with the risk score using a 5-point Likert scale (completely disagree to agree) and assess the usefulness of the dashboard in clinical decision making. At this stage the dashboard is not used for medical decision making (Phase V). The evaluation results were compiled into a monthly report and shared with all the HCP involved in the project to promote awareness and engagement. After 3 months of usage, a round-table discussion was held with all participants to gather their feedback and discuss clinical cases (Phase VI).
Access to the AI-enhanced dashboard increased during the evaluation period. In the first two months of the pilot quality improvement program, the AI-enhanced dashboard was evaluated for 20% patients with an AVF, a proportion that doubled by the end of the program (Fig. 1B). HCP reported 90% agreement with risk model rating (Fig. 1C), suggesting that the model capture relevant physiological status of the patient and its output is understandable by the healthcare staff. Qualitative analysis of round-table discussions showed that the dashboard is perceived as useful and clear. HCP suggested few changes in the user interface to enhance actionability and improve clinical workflow integration.
Our results support the usefulness and intelligibility of the AI-enhanced AVF management dashboard. The advance of AI-models highlighted the importance to develop new strategies for their integration and evaluation in clinical practice. The engagement of HCP in the early phases of AI-model design and development grants a continuous feedback loop bringing clinical and AI world together. A clinical perspective in dashboard design reflects the needs of healthcare professionals and enhance consideration of patient medical needs. The synergy between theoretical and clinical perspective is crucial to improve model performance, usability, and implementation in clinical practice.
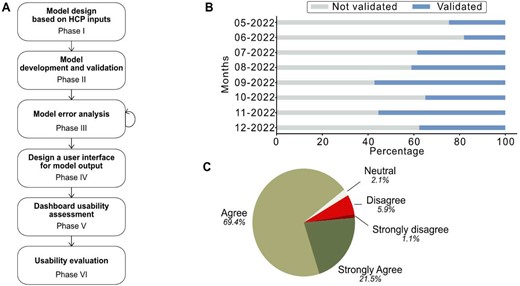
A) Workflow of the improvement framework. B) Percentage of evaluated dashboard's entry C) Percentage of agreement reported by HCP.


Comments