


Abstract
Hemodialysis (HD) adequacy is generally estimated by the dialysis adequacy marker Kt/V urea that poorly describes removal of uremic toxins with different removal kinetics, such as protein bound or middle molecule uremic toxins, which have direct effect on morbidity and mortality of end stage kidney disease (ESKD) patients. We have recently shown the feasibility of estimating an alternative dialysis adequacy marker that can be applied to dialysis sessions with varying settings and different uremic toxins, intradialytic time average concentration (TAC) of uremic toxins, such as urea, uric acid (UA), indoxyl sulfate (IS) and beta-2-microglobulin in blood of ESKD patients, from spent dialysate concentrations determined by laboratory methods [1]. The aim of this retrospective observational study was to estimate
intradialytic TAC of uremic toxins UA and IS non-invasively from spent dialysate concentrations determined by optical methods.
Twenty-two ESKD patients on chronic HD were enrolled into the study. For each patient 4 midweek dialysis sessions with different treatment settings were included (1 HD: Qb = 200 mL/min, Qd = 300 mL/min, dialyzer 1,5m2; 3 HDF: median (interquartile range) Qb = 298 (296-356) mL/min, Qd = 795 (500–800) mL/min, Vsubst = 21.8 (15–24.5) L, dialyzers 1,8 m2 and 2,2 m2). During each dialysis session, blood samples were taken at 0 min (start) and 240 min after the start from the arterial blood line and dialysate samples were taken at 7 min and 240 min after the start from the outlet of the dialysis machine. Concentrations of UA and IS in serum and spent dialysate samples were determined with HPLC. In addition, UV absorbance and fluorescence of the spent dialysate samples were measured with spectrophotometer UV-3600 and spectrofluorometer RF-6000 (both from Shimadzu Corp., Japan), after which concentrations of UA and IS in spent dialysate samples were determined based on the optical properties of samples. Stability of HD treatment settings were monitored online and dialysis sessions with unstable blood and dialysate flow rates were excluded. TAC of UA and IS were calculated from serum concentrations and evaluated from laboratory and optically estimated logarithmic mean concentrations (Mln D) of spent dialysate.
Mean intradialytic serum TAC values of UA and IS were 198.4±44.0 μmol/L and 69.5 ± 37.8 μmol/L and strongly correlated to those estimated from optically determined Mln D 198.0±38.9 μmol/L (R2 = 0.75) and 69.5 ± 37.8 μmol/L (R2 = 0.81), respectively. Mln D of UA and IS in spent dialysate based on laboratory methods were 102.2 ± 22.8 μmol/L and 5.9 ± 3.5 μmol/L and strongly correlated with the optically determined concentrations of 102.7 ± 23.1 μmol/L (R2 = 0.97) and 6.1 ± 3.4 μmol/L (R2 = 0.97), respectively.
Intradialytic serum TAC of UA and IS can be estimated non-invasively with optical methods from their concentration in spent dialysate independent of treatment modality. Optical online monitoring of spent dialysate in real-time could therefore provide additional information about treatment adequacy regarding the removal of uremic toxins’ other than urea. In future, TAC estimation models should be optimized for each uremic toxin to establish higher accuracy, considering real-time treatment settings, recirculation etc.
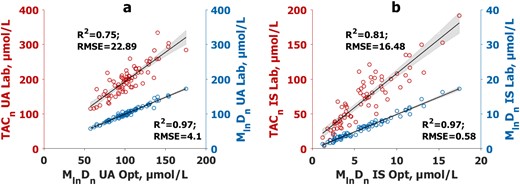
Correlation between logarithmic mean concentration (Mln Dn) of (a) uric acid (UA) and (b) indoxyl sulfate (IS) in spent dialysate based on optically (Opt) determined concentrations and intradialytic time-averaged concentrations (TAC) in serum (TACn), and between Mln Dn in spent dialysate based on laboratory (Lab) determined concentrations. The serum TAC values were normalized by average effective blood, and the Mln Dn values by average dialysate flow rates, respectively; n = 73. The black lines mark the regression lines and the grey area marks 95% confidence interval of the slope.


Comments