


ABSTRACT
Nephrosclerosis is one of the histopathological consequences of severe or malignant hypertension (MH), some of the pathophysiology of which has been extrapolated from essential polygenetic arterial hypertension. Despite our recent description of unsuspected ciliopathies with MH, causes of MH in young patients with severe renal impairment are poorly understood.
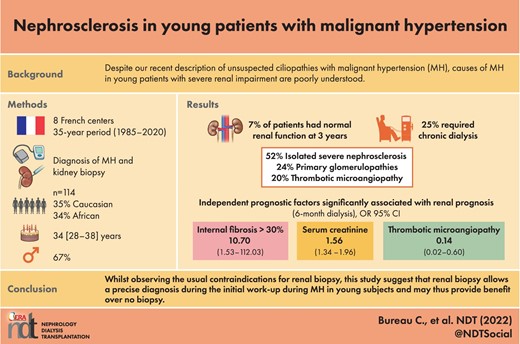
To refine and better describe the MH phenotype, we studied clinical and prognostic factors in young patients receiving a kidney biopsy following their first episode of MH. Patients were identified retrospectively and prospectively from eight centres over a 35-year period (1985–2020). Keywords were used to retrospectively enrol patients irrespective of lesions found on renal biopsy.
A total of 114 patients were included, 77 (67%) of whom were men, average age 34 years, 35% Caucasian and 34% African origin. An isolated clinical diagnosis of severe nephrosclerosis was suggested in only 52% of cases, with 24% primary glomerulopathies. Only 7% of patients had normal renal function at diagnosis, 25% required emergency dialysis and 21% were eventually transplanted. Mortality was 1% at the last follow-up. Independent prognostic factors significantly associated with renal prognosis (6-month dialysis) and predictive of end-stage renal disease were serum creatinine on admission {odds ratio [OR] 1.56 [95% confidence interval (CI) 1.34–1.96], P < .001} and renal fibrosis >30% [OR 10.70 (95% CI 1.53–112.03), P = .03]. Astonishingly, the presence of any thrombotic microangiopathy lesion on renal biopsy was an independent, protective factor [OR 0.14 (95% CI 0.02–0.60), P = .01]. The histopathological hallmark of nephrosclerosis was found alone in only 52% of study patients, regardless of ethnicity.
This suggests that kidney biopsy might be beneficial in young patients with MH.
What is already known about this subject?
The lesions of nephrosclerosis are one of the histopathological consequences of malignant hypertension (MH).
Part of the MH pathophysiology has been extrapolated from essential arterial hypertension or our understanding of the aging process.
Some authors consider kidney disease per se as the starting point of MH when MH is associated with renal failure, but the genetic causes of MH are poorly understood, especially in young patients with severe renal impairment.
What this study adds?
The diagnosis of MH with ‘isolated’ nephrosclerosis accounts for only 52% of cases, whereas 48% of patients have underlying renal disease documented or suggested by the renal biopsy.
The criteria associated with an increased risk of extrarenal purification at 6 months was the serum creatinine level at admission and the presence of fibrosis >30% on biopsy. The presence of thrombotic microangiopathy appears to be a protective factor.
Morbidity was high, with 46% of patients requiring supplementary therapy or transplantation in the medium-/long-term follow-up.
What impact this may have on practice or policy?
Hypertension in this population is driven by a renal disease in at least 48% of patients. Conversely, isolated nephrosclerosis lesions need additional studies to explain their genesis.
Given that half the patients have a renal disorder extrapolated from their renal biopsy, a renal biopsy should be performed after a MH episode in young patients, irrespective of their geographical origin, that of African in particular.
INTRODUCTION
Malignant hypertension (MH) is characterized by a sharp and sudden increase in blood pressure (BP; particularly diastolic) and is associated with acute organ damage (retinopathy, renal failure, left ventricular dysfunction or central neurological injuries) [1,2]. Currently, fundoscopy examination is not mandatory for diagnosis. MH still represents the most severe form of hypertension today [3,4]. At presentation, roughly 30% of patients with MH have a plasma creatinine of up to 200 µmol/l [5]. Proteinuria is generally <1 g/day and persistent or nephrotic-range proteinuria or haematuria usually prompts investigation into an underlying primary nephropathy, such as a genetically related kidney disease, as described recently [6].
As early as 1988, Kawazoe et al. [7] found that chronic glomerulonephritis was frequently used as a diagnostic alternative to essential hypertension, a finding subsequently endorsed by Ohta et al. [5]. The renal histology of MH is typically characterized by exudative lesions of arteriocapillary fibrinoid necrosis and by an intimal proliferation (‘endarteritis’) that gradually occludes the arterial lumen in an ‘onion bulb’ pattern. This arterial involvement leads to glomerular ischaemia and deleterious renin–angiotensin system amplification, which may worsen hypertension severity [8]. Renal function during MH depends on the underlying renal pathology and the degree of renal damage at the time of diagnosis. Kidney survival at 5 years reaches 60% in the case of essential hypertension and only 4% at 18 months in the case of pre-existing glomerulonephritis [7]. With optimized treatment of hypertension, kidney recovery may be possible, especially if the initial renal injury is moderate. Most commonly, there is a progressive deterioration of kidney function. With the possibility of renal recovery, antihypertensive therapy is an absolute necessity to protect the kidney from further aggression [9,10].
The median age of patients with MH is ≈40 years. There are few prognostic factors in the younger population, with generally few associated comorbidities. In practice, young patients with MH, especially those with African origins, rarely receive a kidney biopsy. More often than not, the vascular aetiology is retained without documentation, something that is particularly noticeable in African-origin patients, in spite of this population being most affected by this pathology [11–17]. Renal biopsy analysis such as exome sequencing could identify a specific aetiology in this group, as well as prognostic factors, both of which could impact clinical management by better understanding disease progression in these patients [6].
Beyond proposing a clinical description of MH in young patients (<40 years), the main objective of this study, a prerequisite to any genetic study, was to identify the epidemiological, clinical and prognostic factors of those with MH who underwent a kidney biopsy. The secondary objective was to examine the potential benefits of an early anatomopathological study in this population.
MATERIALS AND METHODS
This observational, multicentre, cohort study combines both retrospective and prospective data. The study was conducted in several nephrology departments in Île-de-France, Marseille, Pointe-à-Pitre and Tours between 1985 and 2020. We collected data from any patient <40 years of age admitted for MH, as indicated in the patient's hospitalization report according to the diagnostic criteria in effect at the time of the episode [1,2], and the patient was then subjected to a renal biopsy within 1 year of the episode. Inclusion criteria were age <40 years, hospitalization for an episode of MH and a renal biopsy performed within 1 year of the episode. Exclusion criteria were age <18 years and protected adults. We identified patients using the key words ‘nephrosclerosis’, ‘thrombotic microangiopathy’ and ‘MH’ in various pathology databases and in a second step we verified in the hospital report that the reason for admission was really an episode of MH and we verified with the available elements the veracity of the diagnosis according to the definitions in force [1,2]. A description of the clinical presentation and kidney biopsy were recorded. Given the protracted study period, the anatomopathological analysis could not be centralized, so pathological descriptions were collected from renal biopsy summaries using a standardized lexicon.
Measurements
For all patients, data were collected and restructured from hand-written medical records and computer files using the REDCap database. Data included demographic characteristics, inclusion centre, sex, age at first consultation, height, weight, history of pregnancy or eclampsia, socio-economic status, personal or family history of chronic kidney disease (CKD) or high BP. The duration of events and their evolution were also specified. Clinical data were collected on BP, 24-h diuresis, Glasgow score, neurological signs, oxygen saturation, need for initial oxygen therapy, eye fundus examination with retinopathy graduation according to the Keith–Wagener–Barker classification, electrocardiogram (ventricular hypertrophy, ST segment, T wave), cardiac ultrasound (ventricular enlargement, left ventricular ejection fraction, size of the septum), kidney ultrasound (kidney size, resistance index), brain magnetic resonance imaging (MRI), biopsy characteristics (time of realization, complications, number of glomeruli) and the anatomopathological interpretation. Additional endpoints were the final diagnosis clinically retained at the end of hospitalization, drug therapies used in the first 24 h and during the remaining hospitalization, the need for dialysis during the first 48 h and at 1 and 6 months, complications during the episode of MH and evolution of BP and renal function.
The socio-economic level of the patients was defined according to the five categories set out by the Institut national de la statistique et des études économiques. The poverty line corresponded to half of the median income, the working-class categories were above this threshold but in the poorest 30%, the middle class was distributed around the median salary, the wealthy categories formed part of the richest 20% without reaching the wealth threshold and the highest income bracket received more than double the median salary.
Statistical analyses
All the categorical variables are expressed in number (%) and the continuous variables are given as median [interquartile range (IQR)]. The endpoints were dependence on dialysis in the 6 months following the initial episode and renal transplant during the time of the follow-up. For all outcomes, we performed a univariate statistical analysis using the Fisher (for categorical data) and Student or Wilcoxon (for continuous data) tests. We then fitted multivariate statistical analysis to identify variables associated with the dependence on dialysis at 6 months.
Logistic regression was built by including all risk factors for the primary outcome that met the 0.20 significance threshold in univariate analysis and those defined as relevant in the literature even if not significant in our univariate analysis. The final model resulted from a stepwise variable selection process using the Akaike criteria. Potential interactions were tested in the final model. The results were given as odds ratios (ORs) and 95% confidence intervals (CIs). Missing data were handled by multiple imputation by chained equation. Data were imputed using an imputation model repeated 10 times. An analysis model was fit in each of the 50 imputed datasets separately and these 50 datasets were then pooled and gave overall sets of estimates and corresponding standard errors [18]. Fit quality was evaluated by the Hosmer–Lemeshow test. Receiver operating characteristics (ROC) curves (with 95% CI) were generated and Youden's index was calculated to assess the ability of our final model to predict poor renal outcome. P-values <.05 were considered statistically significant. All the statistical analyses were carried out with R version 3.1.1 (R Foundation for Statistical Computing, Vienna, Austria).
RESULTS
A total of 114 patients were included for the study period. Their characteristics are shown in Table 1. Most patients came from the Île-de-France region [n = 75 (67.5%)], notably from one centre (Tenon Hospital). Twenty-two (19%), 12 (11%) and 5 (4%) patients were from Marseille, Pointe-à-Pitre and Tours, respectively. The ethnic origins of the patients were diverse, but 35% were Caucasian. Patient socio-economic status appears balanced. A total of 46% of patients had a personal history of hypertension, 24% reported a family history of hypertension and 19% had a family history of renal disease.
Characteristics of the study population (N = 114).
| Demographic characteristics | Values | NA (%) |
|---|---|---|
| Male, n (%) | 77 (67.5) | 0 |
| Age (years), median (IQR) | 34 (28–38) | 0 |
| Body mass index (kg/m2), median (IQR) | 25.3 (22.5–28.4) | 14 |
| Antecedents | ||
| Pregnancies, n (%) | 20 (61) | 14 |
| Pre-eclampsia, n (%) | 5 (15) | 11 |
| Personal history of hypertension, n (%) | 46 (46) | 12 |
| Personal history of kidney disease, n (%) | 19 (17) | 2 |
| Duration of hypertension (years), median (IQR) | 2 (1–3) | 0 |
| Family history of hypertension, n (%) | 27 (24) | 2 |
| Family history of kidney disease, n (%) | 21 (19) | 3 |
| Geographical or declared ethnicity, n (%) | 1 | |
| Caucasian | 68 (60) | |
| Africa | 39 (35) | 1 |
| Asia | 6 (5) | |
| Socio-economic status, n (%) | ||
| Beneath the poverty line | 11 (10) | |
| Working class | 32 (29) | |
| Middle class | 43 (39) | 4 |
| Wealthy | 17 (16) | |
| High income | 6 (5) | |
NA: not applicable.
Patient characteristics at admission are reported in Table 2. The two main reasons for admission were neurological symptoms, with headaches present in 43% of patients and visual disorders in 29%. Few patients presented with symptoms of neurological or respiratory distress. Diuresis was preserved in nearly all patients [1500 ml (95% CI 1000–1500)]. A total of 65% of patients received a fundus examination at the time of initial management. The majority of patients had severe retinopathy, with 68% of the study population at stage 3 or 4 at diagnosis.
Characteristics at admission.
| Characteristics | Values | NA (%) |
|---|---|---|
| Symptoms at initial admission | ||
| Headache, n (%) | 49 (43) | 0 |
| Visual impairment, n (%) | 33 (29) | 0 |
| Dyspnoea, n (%) | 23 (20) | 0 |
| Asthenia, n (%) | 24 (21) | 0 |
| Nocturnal polyuria, n (%) | 18 (16) | 0 |
| Weight loss, n (%) | 14 (12) | 0 |
| Chest pain, n (%) | 12 (10) | 0 |
| Loss of appetite, n (%) | 14 (12) | 0 |
| Epistaxis, n (%) | 4 (4) | 0 |
| Convulsion, n (%) | 1 (1) | 0 |
| Clinical features | ||
| Systolic BP on admission (mmHg), median (IQR) | 205 (180–230) | 0 |
| Diastolic BP on admission (mmHg), median (IQR) | 120 (110–140) | 0 |
| Diuresis at 24 h (ml), median (IQR) | 1500 (1000–1500) | 33 |
| Glasgow score, median (IQR) | 15 (15–15) | 9 |
| Neurological deficit, n (%) | 5 (5%) | 12 |
| SpO2 on admission (%), median (IQR) | 100 (98–100) | 17 |
| Oxygen therapy during the first week, n (%) | 13 (13) | 12 |
| Eye fundoscopy (Keith–Wagener–Barker classification), n (%) | ||
| Fundus examination during initial management | 71 (65) | 0 |
| Normal | 2 (3) | NA |
| Stage 1 | 8 (11) | |
| Stage 2 | 13 (18) | |
| Stage 3 | 24 (34) | |
| Stage 4 | 24 (34) | |
SpO2, blood oxygen saturation level; NA: not applicable.
The biological characteristics of the study group are reported in Table 3. Few complement abnormalities were observed. Proteinuria on admission was significant, at 3 g/24 h. Troponin was elevated but was considered clinically pathological in only 20% of cases.
Biological parameters.
| Blood sampling | Admission | NA (%) | 6 months | NA (%) |
|---|---|---|---|---|
| Serum creatinine (µmol/l) | 398 (198–705) | 5 | 301 (184–495) | 49 |
| Blood urea nitrogen (mg/dl) | 51 (−27–81) | 15 | 46 (30–57) | 54 |
| eGFR (ml/min/1.73 m2) | 17 (8–41) | 5 | 23 (5.5–36) | 49 |
| Natremia (mmol/l) | 137 (135–140) | 14 | 139 (137–140) | 47 |
| Kalaemia (mmol/l) | 3.8 (3.1–4.4) | 10 | 4.3 (3.9–4.5) | 53 |
| Haemoglobin (g/dl) | 10.9 (8.6–12.9) | 17 | 12 (10.5–13) | 53 |
| Platelets (/mm3) | 194 000 (116 000–264 000) | 18 | 251 000 (202 000–307 500) | 62 |
| Thrombopenia (<150), n (%) | 34 (36) | 18 | NA | NA |
| LDH (UI/l) | 456 (289–771) | 24 | 371 (160–563) | 68 |
| Increased LDH (>250), n (%) | 16 (21) | 24 | NA | NA |
| Haptoglobin (g/dl) | 0.31 (0–0.96) | 31 | NA | NA |
| Low haptoglobin (<0.08), n (%) | 25 (36) | 31 | NA | NA |
| Schistocytes (%) | 0 (0–1) | 33 | 0 (0–0) | 66 |
| Biological microangiopathy, n (%) | 25 (40) | 38 | NA | NA |
| Troponin at admission, n (%) | ||||
| Normal | 28 (50) | 51 | ||
| High | 28 (50) | 51 | ||
| Study of complement at admission, n (%) | ||||
| Genetic study of complement | 35 (39) | 22 | ||
| Low C4 | 11 (15) | 27 | ||
| Low CH50 | 3 (5) | 48 | ||
| Low C3 | 4 (5) | 30 | ||
| Urine sediment at admission | ||||
| Haematuria, n (%) | 34 (35) | 3 | ||
| Leucocyturia, n (%) | 18 (20) | 21 | ||
| Urine protein (g/24 h), mean (95% CI) | 2.6 (1.3–4.4) | 7 | ||
| Tubular proteinuria, n (%) | 28 (35) | 20 | ||
| Glomerular proteinuria, n (%) | 51 (65) | 22 | ||
Values are presented as median (IQR) unless stated otherwise.
eGFR: estimated glomerular filtration rate; LDH, lactate dehydrogenase; NA: not applicable.
The paraclinical investigations at admission are presented in Supplementary Table 1. After echocardiography, most patients had left ventricular hypertrophy (80%), both concentric and on electrocardiogram (52%). The observed kidney size was normal [100 mm (95% CI 95–110)], as were the Doppler parameters. We found that only 25% (n = 28) of the population had a brain MRI performed during initial management, with 61% of the MRIs interpreted as abnormal, 25% had microbleeds in the T2 window, and 21% had reversible posterior encephalopathy syndrome.
Renal biopsy characteristics are reported in Table 4. In our population, 39% (45/114) of the biopsies were performed during the first week of management, the other biopsies were performed at most 6 months after the MH episode. A total of 12% (n = 14) of the biopsies resulted in complications, arterio-embolization was required in 4 patients and 5 patients required transfusion.
Description of kidney biopsy.
| Characteristics | Values | NA (%) |
|---|---|---|
| Renal biopsy findings | ||
| Number of glomeruli (n), median (IQR) | 15 (10–21) | 0 |
| Number of sclerotic glomeruli (n), median (IQR) | 4 (2–8) | 0 |
| Complications of biopsy, n (%) | ||
| Hematoma | 14 (12) | 0 |
| Need for arterio-embolization | 4/14 (29) | NA |
| Transfusion | 5/14 (36) | NA |
| Interstitial fibrosis, n (%) | 7 | |
| None | 10 (10) | |
| <10% of the total | 11 (11) | |
| 10–30% | 25 (24) | |
| >30% | 60 (57) | |
| Glomerulopathies, n (%) | ||
| Presence of additional glomerulopathy | 60 (53) | 0 |
| Segmental and focal hyalinosis | 35 (58) | NA |
| IgA deposits | 11 (18) | |
| Membranoproliferative | 2 (3) | |
| Membranous nephropathy | 2 (3) | |
| Other | 10 (17) | |
| Immunofluorescence, n (%) | ||
| None | 43 (47) | 10 |
| IgM | 27 (30) | |
| C3 mesangial | 31 (34) | |
| IgA mesangial | 16 (18) | |
| Membrane IgG | 4 (4) | |
| IgG | 5 (6) | |
| Glomerular fibrin | 4 (4) | |
| Vascular lesions, n (%) | ||
| Malignant nephron-angiosclerosis | 75 (66) | 0 |
| Thrombotic microangiopathy | 58 (51) | 0 |
| Vascular fibrosis | 53 (46 | 0 |
| Vascular hyaline deposits | 22 (19%) | 0 |
Ig: immunoglobulin; NA: not applicable.
A majority of biopsies (57%) showed renal fibrosis affecting >30% of the renal biopsy surface area. A glomerulopathy was diagnosed in 53% of cases, including 58% with indeterminate glomerular nephropathy with lesions of segmental and focal hyalinosis and 18% with immunoglobulin A (IgA) deposits. Pathological signs of thrombotic microangiopathy were observed in 51% of the renal biopsies.
The final diagnosis recorded after clinical management of the MH episode was nephrosclerosis in 52% (n = 59), primary glomerulopathy in 25% (n = 28) and thrombotic microangiopathy in 20% (n = 23) of cases. Endocrine disease was found in only 2% of cases (n = 2, including 2 renin tumours). Additionally, two sclerodermas were ultimately diagnosed.
Drug therapies used in the first 24 h and during management are reported in Supplementary Table 2.
Patient evolution and outcomes are shown in Table 5. A total of 25% of patients required dialysis in the first 48 h; at 6 months this proportion increased to 31%. The median follow-up after the first episode was 3 years (IQR 1–7). At the time of collection only 7% of patients had normal renal function, 25% required chronic dialysis and 21% had undergone transplantation. Mortality in our population was 1%. Only 8% of patients had a secondary episode of MH.
Evolution and outcome of patients.
| Characteristics | Values | NA (%) |
|---|---|---|
| Renal replacement therapy, n (%) | ||
| Dialysis within the first 48 h | 29 (25) | 0 |
| Dialysis at day 28 | 34 (30) | 0 |
| Dialysis at 6 months | 35 (31) | 0 |
| Evolution of renal function | ||
| Time since first episode (years), median (IQR) | 3 (1–7) | 0 |
| Last serum creatinine at time of collection (µmol/l), median (IQR) | 146 (110–243) | 35 |
| eGFR at time of collection (ml/min/1.73 m2), median (IQR) | 44 (17–62) | 31 |
| eGFR >60 ml/min/1.73 m2, n (%) | 8 (7) | 0 |
| CKD stage 3, n (%) | 12 (11) | |
| CKD stage 4, n (%) | 13 (12) | |
| CKD stage 5, n (%) | 13 (11) | |
| Chronic dialysis, n (%) | 28 (25) | |
| Transplantation, n (%) | 24 (21) | |
| Death, n (%) | 1 (1) | |
| Lost to follow-up, n (%) | 15 (13) | |
| Complications, n (%) | ||
| None | 76 (67) | NA |
| Other episodes of malignant hypertension | 9 (8) | NA |
| Stroke | 4 (3.5) | NA |
| Thrombotic microangiopathy | 4 (3.5) | NA |
| Myocardial infarction | 2 (2) | NA |
| Diabetes | 7 (6) | NA |
| Hypertension, n (%) | ||
| Blood pressure controlled at 6 months | 56 (59) | 17 |
| Hypertension despite transplantation | 9 (38) | 0 |
eGFR: estimated glomerular filtration rate; NA: not applicable.
The univariate analysis and multivariate analysis of risk factors for extra-renal replacement therapy at 6 months are shown in Table 6. These risk factors were creatinine level at admission [1.56 (95% CI 1.34–1.96), P < .001] and the presence of fibrosis >30% [10.70 (95% CI 1.53–112.03), P = .03] on renal biopsy. The presence of microangiopathy on biopsy appears to be a protective factor [0.14 (95% CI 0.02–0.60), P = .01]. The ROC of the multivariate model used (creatinine/fibrosis/thrombotic microangiopathy) is shown in Supplementary Fig. 1, with an area under the curve of 0.96 (95% CI 0.92–0.99).
Univariate and multivariate analysis of risk factors for renal replacement therapy at 6 months.
| Risk factors | OR (95% CI) | P-value |
|---|---|---|
| Univariate analysis | ||
| Age at first consultation | 1.25 (0.79–1.98) | .29 |
| Male | 1.58 (0.67–4.01) | .31 |
| African origin | 0.79 (0.33–1.82) | .59 |
| Family history of hypertension | 7.64 (2.09–49.4) | .01 |
| Systolic BP at admission | 0.97 (0.88–1.07) | .52 |
| Diastolic BP at admission | 0.97 (0.84–1.12) | .66 |
| Diuresis at 24 h | 0.92 (0.86–0.98) | .01 |
| Fundus examination stage 3 | 0.75 (0.17–3.95) | .71 |
| Fundus examination stage 4 | 1.39 (0.39–7.08) | .66 |
| Serum creatinine at admission | 1.37 (1.24–1.57) | <.001 |
| Haemoglobin at admission | 0.58 (0.45–0.71) | <.001 |
| Platelets at admission | 0.85 (0.68–1.05) | .15 |
| LDH at admission | 1.02 (0.98–1.05) | .35 |
| Urine protein | 1.06 (1.01–1.14) | .04 |
| Renal size | 0.88 (0.66–1.18) | .41 |
| Thrombotic microangiopathy on biopsy | 1.44 (0.65–3.25) | .37 |
| Internal fibrosis >30% | 3.59 (1.25–13.02) | .02 |
| Glomerulopathy | 0.51 (0.22–1.15) | .11 |
| Multivariate analysis | ||
| Serum creatinine at admission | 1.56 (1.34–1.96) | <.001 |
| Internal fibrosis >30% | 10.70 (1.53–112.03) | .03 |
| Thrombotic microangiopathy on biopsy | 0.14 ([0.02–0.60) | .01 |
LDH: lactate dehydrogenase.
The comparisons of characteristics and prognosis between patients requiring extra-renal replacement therapy at 6 months and others, between patients of African origin or other origins and between patients with nephroangiosclerosis final diagnosis and others are presented in Supplementary Tables 3–5, respectively.
DISCUSSION
Summary of the main results
This multicentric, 35-year study from eight centres in France examines a specific population of young patients (<40 years old) who experienced at least one episode of malignant arterial hypertension with a diagnosis of renal pathology. We show that the diagnosis of MH with nephrosclerosis alone accounts for only 52% of episodes, while in 48% of cases underlying renal disease is the ultimate cause, which is consistent with previously reported percentages [1]. After multivariate analysis, the criteria associated with an increased risk of extrarenal purification at 6 months were the creatinine level on admission and the presence of fibrosis >30% on biopsy. The presence of thrombotic microangiopathy on biopsy appears to be a protective factor, as was found for biological microangiopathy previously [19]. This may be because acute endothelial damage in MH may resolve with BP control, unlike other types of arterial injuries, as well as those observed in people with chronically elevated BP. MH managed in these centres was not associated with increased mortality. On the other hand, there was significant morbidity, with 46% of patients requiring supplementary therapy or transplantation in the medium/long term.
Final diagnosis
Given the final diagnosis, one might have expected that an overwhelming majority of patients would have at least severe vascular disease. We observed that these episodes of MH led to a diagnosis of glomerulopathy in 20% of cases. The high proportion of IgA nephropathy found in the biopsies is noticeable (20%). Other diagnoses included haemolytic uraemic syndrome with factor H deficiency and thrombocytopenic purpuras. Thus very little endocrine or renovascular hypertension was observed in this age group, unlike in other cohorts [1,20]. These elements are a convincing argument for research into more specific aetiologies. An episode of MH that appears to be vascular should therefore not lead to the misdiagnosis of a second disease requiring more specific treatment. This is an additional argument for performing an early renal biopsy in these patients in order to check for underlying non-vascular pathologies.
Renal biopsy and complications
The place of renal biopsy in this population depends not only on the diagnostic profitability of the examination, but also on the risk incurred by the patient during the procedure—in other words, its benefit:risk ratio. Here, the percentage of complications of renal biopsy is not insignificant and the percentage of transfusion is abnormally low compared with the percentage of arterio-embolization. It has been shown that the risk of major bleeding after percutaneous native kidney biopsy may be higher than generally thought and is associated with a 2-fold higher risk of death. It varies widely but can be estimated with a score useful for shared decision making and procedure choice. Given the moderate severity of complications, and despite the acute clinical context, it seems inappropriate to postpone a renal biopsy in order to establish aetiology. However, our study emphasizes the need to carefully select those patients to be biopsied and to be mindful of the usual contraindications [21].
Renal histopathological analysis
Our work produced several findings concerning the anatomopathological attacks in patients. Thus we observed that, despite the young age of our population, the underlying renal parenchyma undergoes a significant change. Interstitial fibrosis of >30% was found in 57% of the biopsies taken. As opposed to former hypotheses, the degree of fibrosis does not vary according to ethnicity [22,23].
History of renal disease and hypertension
Our study suggests the importance of both a personal and a family history of renal failure and hypertension. We noted that 46% of patients had at least one episode of hypertension and 20% had a family history of renal failure, which suggests the probable place of genetic forms in these pathologies [24]. The selection of young patients may have increased the proportion of those with a family history of renal vascular disease. In unselected populations, this type of history is found in 95% of cases of MH labelled ‘undetermined vascular disease’ and 61.5% of cases occurred in the context of glomerulopathy [5]. We recently published a case series showing that ciliopathies can lead to severe hypertension in adults [6].
Admission
Our results confirm the importance of ophthalmological (fundus) and neurological (MRI) diagnostic examinations in the early phase of diagnosis. In this study, of the 28 patients (25%) who had a brain MRI in the first few days, only 38% of patients had normal neurological imaging. This should lead to the systematic performance of a brain MRI in the initial phase of MH to diagnose underlying lesions.
Evolution and complications
In our population, the overall mortality was 1% at follow-up, although it is worth bearing in mind that 13% were lost to follow-up. This result is consistent with the latest prognostic studies carried out on the global population of MH [9,25]. We note that only eight patients (7% of our population) did not have renal failure at the end of follow-up, which means that, given the already advanced fibrosis at the time of diagnosis, the pathology cannot be easily reversed. The objective of early diagnosis might be to optimize the management of patients over subsequent years. Moreover, diagnosis may potentially become evident after transplantation. We did not observe a relapse of MH on the graft.
Proportion of African-origin patients
The proportion of Africa-origin patients in our study was lower than expected. This could be explained by the hypothesis that this population is potentially less biopsied due to the epidemiological aspects of the origin of hypertension in African-origin subjects and, in particular, the place of vascular aetiologies [26–28]. A large ‘African’ bias with regard to the indication for renal biopsy is highlighted by an American study suggesting that, in an equivalent clinical context, African-origin subjects were more often diagnosed as having ‘vascular nephropathy’ without any histopathological evidence [17].
Strengths and limitations of the study
A major limitation of our study is the unequal number of patients included from each centre and the absence of centralized pathological re-examination. Moreover, despite the extended duration of the study, the majority of patients had been recently biopsied and the median follow-up time was in fact only 4 years. Because of the selected services, the patients included are probably mainly nephrological MH, and other presentations of MH may have been seen in neurology (stroke, encephalopathy, etc.) or cardiology wards (heart failure). In these patients, it is not known whether renal biopsy would have been as contributory as for nephrological patients. The reasons for admission were mainly neurological (headaches in 43% of cases) and ophthalmological (visual disorders in 29% of patients). Although the number of patients in our study seems to be one of the highest in the literature, the actual number of non-biopsy patients with a clinical diagnosis of malignant arterial hypertension before the age of 40 years is probably much higher. The imbalance between transfusion and arterio-embolization in the complications identified here suggests that our study is underpowered compared with other studies on renal biopsy complications. Last, we note the absence of complement exploration in the majority of patients.
Perspectives
Our study suggests that a renal biopsy should be performed early in the first weeks during MH in young subjects, whatever their geographical origin (but especially in those of African descent), to explore more specific aetiologies. An episode of MH that appears to be vascular should therefore not prevent the diagnosis of a second disease requiring more specific treatment. Our study justifies a prospective study in young subjects to validate the need for a renal biopsy independent of genetic background and comparing biopsied and non-biopsied patient populations.
CONCLUSION
While observing the usual contraindications for renal biopsy, such as kidney size, single kidney, etc, the various findings from this study suggest that renal biopsy allows a precise diagnosis during the initial work-up for MH in young subjects, irrespective of their ethnicity, and may thus provide benefit over no biopsy. Our work paves the way for a prospective study using controls to quantitate the importance of renal biopsy.
ACKNOWLEDGEMENTS
We thank pathologist Pr David Buob and Dr Aurélie Sannier for their assistance in patient retrieval.
FUNDING
None declared.
AUTHORS’ CONTRIBUTIONS
C.B. and L.M. were responsible for the conception and design. C.B., J.S., M.B., T.R. and A.C. were responsible for data acquisition. C.B., M.J. and L.M. were responsible for analysis and interpretation. C.B., M.J., T.R., A.C., J.M.H., E.R. and L.M. were responsible for drafting the manuscript. All authors approved the final manuscript.
DATA AVAILABILITY STATEMENT
All data collected for the study, including individual participant data, will be available upon request from the corresponding author (participant data with study participation code, study protocol).
CONFLICT OF INTEREST STATEMENT
A.C. reports grants from Mexbrain and stock options from Carmat, CRISPR and Pfizer unrelated to this work. J.-M.H. reports consulting fees, honoraria and support for attending meetings and/or travel from AstraZeneca, Alexion, Bayer, Boehringer Ingelheim France, Servier and Vifor Fresenius and grants from AstraZeneca unrelated to this work. E.R. reports institutional grants and personal fees from Alexion unrelated to this work. LM. reports personal fees from Sanofi, Alexion and Travere Therapeutics unrelated to this work. All other authors have no conflicts of interest related to this work.


Comments