


ABSTRACT
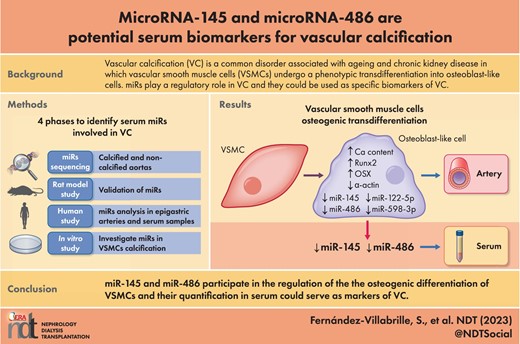
MicroRNAs (miRs) regulate vascular calcification (VC), and their quantification may contribute to suspicion of the presence of VC.
The study was performed in four phases. Phase 1: miRs sequencing of rat calcified and non-calcified aortas. Phase 2: miRs with the highest rate of change, plus miR-145 [the most abundant miR in vascular smooth muscle cells (VSMCs)], were validated in aortas and serum from rats with and without VC. Phase 3: the selected miRs were analyzed in epigastric arteries from kidney donors and recipients, and serum samples from general population. Phase 4: VSMCs were exposed to different phosphorus concentrations, and miR-145 and miR-486 were overexpressed to investigate their role in VC.
miR-145, miR-122-5p, miR-486 and miR-598-3p decreased in the rat calcified aortas, but only miR-145 and miR-486 were detected in serum. In human epigastric arteries, miR-145 and miR-486 were lower in kidney transplant recipients compared with donors. Both miRs inversely correlated with arterial calcium content and with VC (Kauppila index). In the general population, the severe VC was associated with the lowest serum levels of both miRs. The receiver operating characteristic curve showed that serum miR-145 was a good biomarker of VC. In VSMCs exposed to high phosphorus, calcium content, osteogenic markers (Runx2 and Osterix) increased, and the contractile marker (α-actin), miR-145 and miR-486 decreased. Overexpression of miR-145, and to a lesser extent miR-486, prevented the increase in calcium content induced by high phosphorus, the osteogenic differentiation and the loss of the contractile phenotype.
miR-145 and miR-486 regulate the osteogenic differentiation of VSMCs, and their quantification in serum could serve as a marker of VC.
What is already known about this subject?
Vascular calcification (VC) is a common disorder associated with ageing and chronic kidney disease (CKD) in which vascular smooth muscle cells (VSMCs) undergo a phenotypic transdifferentiation into osteoblast-like cells.
miRs play a regulatory role in VC, and they could be used as highly specific biomarkers easily detected in serum.
What this study adds?
The decrease in miR-145 and miR-486 was found to be consistently associated to VC, in both the arteries and serum of rats and humans, with or without CKD.
miR-145 and miR-486 reduced the loss of the VSMCs contractile phenotype and the osteogenic differentiation under calcifying stimuli.
What impact this may have on practice or policy?
The measurement of miR-145 and miR-486 is performed using inexpensive techniques that could be used as non-invasive serum biomarkers of VC.
The identification of miRs that regulate VC would allow the development of new therapeutic strategies for a better management of VC.
INTRODUCTION
Vascular calcification (VC) is one of the most common complications and one of the leading causes of mortality in the ageing general population and in patients with chronic kidney disease (CKD) [1, 2]. The vascular smooth muscle cells (VSMCs), predominantly localized in the medial layer of the arterial wall, are responsible for the contractile properties of the arteries [3, 4]. In ageing and CKD, VSMCs undergo transdifferentiation, losing the phenotypic markers of smooth muscle cell contractility, expressing several bone-related proteins [5]. VC is currently diagnosed at late stages. Therefore, efforts should be made to identify non-invasive sensitive biomarkers to contribute to the detection, as soon as possible, of the presence of VC.
The microRNAS (miRs) are small single-stranded noncoding RNAs that mediate post-transcriptional gene silencing [6]. Recent studies have suggested that miRs are important regulators of skeletal-related genes and mediators of cardiovascular complications [7–13]. Thus, miRs could be good candidates as biomarkers of VC, as they can be easily detected in serum by simple and inexpensive techniques, having the additional advantage of being highly specific. Several miRs have been implicated in the development of VC, acting as either inducers or promoters [10]. One of the first miRs identified was miR-125, which was suggested as a possible biomarker of VC in the elderly population [14] and patients with CKD [15]. As miRs are involved in the transdiferentiation of VSMCs, they could be useful not only in the diagnosis but also in the development of new therapeutic strategies for the management of VC [16–18].
The main objective of this study was to identify—using different approaches—serum miRs involved in VC, that can be used as markers of this disorder.
MATERIALS AND METHODS
Design
The study aimed to identify miRs that can be used as markers of VC, following four phases.
Phase 1: a miRs sequencing study, to identify differentially expressed miRs in non-calcified aortas from rats with normal renal function and severely calcified aortas from rats with chronic renal failure (CRF).
Phase 2: a rat study, performed in aortas and serum from rats with normal renal function without VC (group 1), and aortas from rats with CRF with mild (group 2) and severe (group 3) VC. In the three groups, the expression of miRs with a rate of change >1.5-fold in miRs sequencing, plus miR-145 (the most abundant miR in the VSMCs) were analyzed.
Phase 3: a human study, performed, (i) in epigastric arteries from kidney transplant donors and kidney recipients with CKD 5, and (ii), in serum samples from a large randomized general population study (European Vertebral Osteoporosis Study, EVOS). In phases 3a and 3b, the miRs identified in phase 2 were analyzed.
Phase 4: an in vitro study, performed in VSMCs exposed to different concentrations of phosphorus (P) in which the miRs identified in phase 2 and 3 were overexpressed in order to investigate their potential role in VSMCs calcification.
The protocol for the rat studies was approved by the Laboratory Animal Ethics Committee of Oviedo University (PROAE 14/2021), and it adhered to the National Institutes of Health Guide for the Care and Use of Laboratory Animals. The protocols for human study were approved by the Ethics Committee of Hospital Universitario Central de Asturias, and they were conducted according to the ethical principles of the Declaration of Helsinki.
Phase 1: miRs sequencing
The Phase 1 study was performed using non-calcified aortas from four rats with normal renal function and severely calcified aortas from four rats with CRF obtained using the model described in Phase 2.
The miRs sequencing and analysis were performed by Dreamgenics following a current procedure: (i) quality study of the sequences obtained in each sample, (ii) clipping of the sequences based on the quality of the sequencing base, (iii) pseudo-quantification of transcripts using the mirPro algorithm and (iv) correlation analysis of the samples and differential study of expression with the DESeq2 program.
The miRs with a fold change >1.5 between severely calcified and non-calcified aortas were selected for validation by qRT-PCR. When the data were not sufficient to determine which sequence was the predominant—names like miR-5p (from the 5′ arm) and miR-3p (from the 3′ arm)—the miR-5p was selected for the study.
Phase 2: rat study
Four-month-old male Wistar rats (350–400 g) were used. They were anesthetized using methoxifluorane, and CRF was produced by partial nephrectomy (removal of the right kidney and infarction of 3/4 of the left kidney) [19]. The CRF rats were divided into two groups: a group fed a standard rodent chow with a normal P content (NP; 0.6% P, 0.6% Ca) (CRF + NP) (n = 8), and a group fed a high P diet (HP; 0.9% P, 0.6% Ca, and 20% protein content; Panlab) (CRF + HP) (n = 8). An additional group of sham-operated rats (normal renal function), fed the standard rodent chow, was included in the study as reference group (n = 6). Rats were housed in wire cages and received diet and water ad libitum. After 14 weeks, rats were euthanized by exsanguination using isofluorane anaesthesia, and serum samples were drawn for analyses. Aortas were removed, washed twice with saline solution, and divided into two pieces used for RNA/miR extraction and Ca content.
Phase 3: human study
Study in human epigastric arteries
Patients and samples
Forty epigastric arteries, 30 from kidney recipients and 10 from kidney donors, were used in the study. One fragment from the artery was used for miRs and RNA extraction and the other fragment for the quantification of the Ca content. Biochemical and clinical data, including serum Ca, P and parathyroid hormone (PTH) were collected from the recipients at the time of kidney transplantation.
Vascular calcification
VC was scored in the aortas of the kidney transplant recipients by the semi-quantitative Kauppila Index (KI), in a lateral abdominal X-ray. The KI ranged from 0 to 24. All X-ray images were evaluated by the same radiologist who was blinded to the patient's data. The intra-observer coefficient of variation was below 2%. Ki > 0 was considered positive for VC.
Study in serum from the general population
Patients and samples
To determine the possible role of the selected miRs as serum biomarkers of VC, they were measured in 76 serum samples from the EVOS [20]. Serum from the EVOS have been frozen since 1995–96 at –25°C, avoiding freeze–thaw cycles, and the miRs were measured immediately after defrosting and extraction with TRI Reagent (Sigma Aldrich).
Vascular calcification
VC was evaluated in all the EVOS participants by a lateral lumbar X-ray (from 11th thoracic vertebrae to 5th lumbar vertebrae). VC was defined using the method of Frye et al. [21], and scored as follows: grade 0 (no VC, n = 39), grade 1 (mild–moderate VC, n = 16) or grade 2 (severe VC, n = 21). Briefly, the presence of a linear visible calcification shorter than the length of two vertebral bodies or one dense plaque or several scattered semi-dense plaques were defined as mild–moderate VC (grade 1). The presence of a linear visible calcification longer than the length of two or more vertebral bodies, and/or several dense plaques were defined as severe VC (grade 2) [22].
Phase 4: in vitro study
Induction of A7r5 calcification
The cell line A7r5 (VSMCs from rat's aorta, ATCC) was grown in Dulbecco’s modified Eagle's medium (DMEM) supplemented with 10% fetal bovine serum (FBS) and 1% penicillin/streptomycin (Lonza, Belgium) to subconfluence. The P content of the growing media was 1 mM. Three independent experiments using different P concentration were performed in triplicates. Cells were cultured in DMEM supplemented with 1% FBS, and with increasing concentrations of P to obtain the following final concentrations: 1 mM P (non calcifying media, non CM), 2 mM P and 3 mM P (calcifying media, CM). Ca deposition was quantified 3 days after the addition of the stimuli.
Transfection with mimics
A7r5 were seeded at 5000 cells/cm2 in six-well plates (Corning Costar). To force expression of miR-145 and miR-486, when a 60%–70% confluence was reached, cells were transfected overnight with 500 pmol mimics of miR-145 and miR-486 (Ambion) using the DharmaFECT transfection reagent (GE Healthcare Dharmacon) following the manufacturer's instructions. Transfection with a scrambled sequence (Ambion) was used as a negative control, with the same concentrations and exposure times than the mimics. A7r5 cells were cultured for 3 days in control media (DMEM + 1% FBS + 1 mM P) and in calcifying media with the highest P content (DMEM + 1% FBS + 3 mM P). Afterwards, Ca content, miRs and gene expression were assessed. The three experimental conditions were performed in triplicates.
Analytical and technical procedures used in all the studies
Biochemical markers
Serum creatinine, Ca and P were measured using a multichannel auto analyzer (Hitachi 717). Serum PTH was measured by ELISA (Intact PTH ELISA Kit; Immutopics) and fibroblast growth factor 23 (FGF23) by a sandwich ELISA (Kainos Laboratories) following the manufacturer's protocols.
Analyses of calcification
Quantification of Ca content
Frozen arterial fragments (aorta from rats or epigastric artery from humans) and A7r5 cells were washed three times with phosphate-buffered saline (PBS) and homogenized in 0.6 N HCl at 4°C gently shaking for 24 h. Upon centrifugation, Ca content was determined colorimetrically in the supernatants by the o-cresolphtalein complexone method [23]. The remaining pellet was resuspended in lysis buffer (125 mM Tris, 2% SDS, pH 6.8) for protein extraction and quantification. Ca content was normalized to total cell protein and expressed as micrograms of Ca per milligram of protein.
Alizarin red staining
In A7r5 cells, Ca deposits were stained with Alizarin red following a previously described procedure [24]. Briefly, A7r5 cells were washed three times with PBS, fixed with 10% formaldehyde, washed three times with distilled water, stained with 2% alizarin red pH 4.2 and washed three times with distilled water. Afterwards the Ca deposits were visualized. The Ca deposits were quantified after adding 10% acetic acid to each well and incubate at room temperature with shaking. Then, cells in 10% acetic acid were collected to a microcentrifuge tube and they were heated at 85°C for 10 min. Afterwards, samples were centrifuged, and the supernatants were neutralized with 10% ammonium hydroxide. The absorbance was read at 405 nm.
MicroRNA and RNA extraction, retrotranscription and quantitative PCR
A fragment of the abdominal aorta from the rats or from the human epigastric arteries was homogenized in an Ultraturrax (OmniHT) in TRI Reagent following the manufacturer's instructions. Total RNA from rat and human serum samples and A7r5 cells was also extracted with TRI Reagent. Total RNA concentration and purity were quantified by UV-Vis Spectrophotometry (NanoDrop Technologies), which measured absorbance at 260 and 280 nm. Reverse transcription was performed with a High-Capacity cDNA Reverse Transcription Kit (Applied Biosystems) following the manufacturer's instructions.
Expression of miRs levels was analyzed from the total RNA using Megaplex Primer Pools (Thermo Fisher) for the retrotranscription according to the manufacturer's instructions. Retrotranscription quantitative PCR (qRT-PCR) was performed in the resulting product using the appropriate TaqMan miR Assays (Applied Biosystems) for miR-145, miR-122-5p, miR-132-5p, miR-146a-5p, miR-146b-5p, miR-192-5p, miR-194-5p, miR-200a-3p, miR-200b-3p, miR-21-5p, miR-325-5p, miR-34a-5p, miR-34b-5p, miR-34c-5p, miR-375-3p, miR-486 and miR-598-3p. Endogenous rat small nuclear RNA U6, and exogenously added cel-miR-39 (Ambion) were respectively used as reference for tissue and for serum samples.
Gene expression was also measured by qRT-PCR using QuantStudio 3 (Applied Biosystems). TaqMan qRT-PCR amplification was performed with gene-specific primers (Gene Expression Assays; Applied Biosystems) for genes involved in the phenotypic transdifferentiation and calcification of VSMCs: α-actin, RUNX family transcription factor 2 (Runx2) and Osterix (Osx). Rat glyceraldehide-3-phosphate-dehydrogenase (GAPDH) was used as the housekeeping gene.
The relative quantitative evaluation of miRs and target genes was performed by comparing threshold cycles using the ΔΔ cycle threshold method [25].
Statistical analyses
Data are shown as mean ± standard deviation (SD) or medians and interquartile ranges (IQR) according to the normal or non-normal distribution of the studied variable.
For the aortic and serum samples, the CRF-NP and CRF-HP groups were compared with the Reference group using the non-parametric Kruskal–Wallis and Dunn's Multiple Comparison tests, or analysis of variance (ANOVA) for samples with normal distribution.
The non-parametric Mann–Whitney–Wilcoxon test was used to compare the epigastric arteries of donors and recipients of kidney transplant. In the serum samples of the EVOS study, the groups were compared using the non-parametric Kruskal–Wallis and Dunn tests, with Bonferroni correction. The receiver operating characteristic (ROC) curve and binary logistic regression were used to investigate the sensitivity and specificity of miR-145 and miR-486 as markers of VC.
In the in vitro model, the different groups were compared using the non-parametric Kruskal–Wallis and Dunn's Multiple Comparison tests, or ANOVA for samples with normal distribution. All the correlation studies were carried out using the simple linear regression method. All analyses were performed used R 4.1.0.
RESULTS
Phase 1 miRs sequencing: miRs differentially expressed between non-calcified and calcified aortas
The miRs sequencing analysis detected 34 differentially expressed miRs between non-calcified and calcified aortas from rats, 17 of them were upregulated and the other 17 were downregulated (Table 1).
Differentially expressed miRs determined by miRs sequencing (Phase 1) in non-calcified aortas (from four rats with normal renal function fed a NP diet) and in severe calcified aortas (from four CRF rats fed a HP diet for 14 weeks); and Log2 fold change versus non-calcified aortas.
| Upregulated | Downregulated | ||
|---|---|---|---|
| miR | Log2 fold change | miR | Log2 fold change |
| rno-miR-132-5p | 2.89 | rno-miR-122-5p | –5.00 |
| rno-miR-132-3p | 2.08 | rno-miR-122-3p | –5.00 |
| rno-miR-146a-5p | 2.69 | rno-miR-192-5p | –2.21 |
| rno-miR-146b-5p | 2.69 | rno-miR-486 | –1.81 |
| rno-miR-21-5p | 1.63 | rno-miR-194-5p | –3.33 |
| rno-miR-34a-5p | 1.68 | rno-miR-194-3p | –1.47 |
| rno-miR-34b-5p | 3.66 | rno-miR-200a-3p | –1.75 |
| rno-miR-34b-3p | 2.74 | rno-miR-200b-3p | –1.52 |
| rno-miR-34c-5p | 3.63 | rno-miR-375-3p | –2.39 |
| rno-miR-34c-3p | 2.73 | rno-miR-598-3p | –1.61 |
| rno-miR-325-5p | 1.76 | rno-miR-6215 | –1.42 |
| rno-miR-27a-5p | 1.25 | rno-miR-143-5p | –1.06 |
| rno-miR-212-5p | 1.33 | rno-miR-143-3p | –0.87 |
| rno-miR-212-3p | 0.96 | rno-miR-144-3p | –1.12 |
| rno-miR-221-3p | 1.25 | rno-miR-28-3p | –0.95 |
| rno-miR-221-5p | 0.86 | rno-miR-29c-3p | –0.89 |
| rno-miR-223-3p | 1.26 | rno-miR-29c-5p | –0.98 |
In bold type, miRs with a fold change >1.5 and selected for phase 2.
Phase 2 rat study: biochemical markers, aortic Ca content and aortic and serum miRs
The rats with CRF showed a reduction in the creatinine clearance, the lowest values were observed in rats fed a HP diet (CRF + HP). In addition, in the CRF + HP group the lowest serum Ca and the highest serum P, FGF23 and intact PTH levels were observed (Table 2). The aortic Ca content and the osteogenic markers, Osx and Runx2, showed the highest levels in the CRF + HP group; meanwhile, the expression of the contractile α-actin gene showed significant lower levels in the two groups of rats with CRF compared with the reference (Table 2).
Serum biochemical parameters, aortic calcium content, gene markers of vascular calcification and aortic miRs expression in rats (Phase 2).
| Reference | CRF + NP | CRF + HP | ||
|---|---|---|---|---|
| Serum biochemical parameters | Creatinine clearance (mL/min) (mean ± SD) | 2.78 ± 0.55 | 0.99 ± 0.15 *** | 0.48 ± 0.25***## |
| Ca (mg/dL) [median (IQR)] | 10.15 (10.03–10.35) | 10.50 (10.20–10.65) | 9.55 (9.43–9.83) *### | |
| P (mg/dL) [median (IQR)] | 4.10 (4.10–4.25) | 4.80 (4.35–4.85) | 10.30 (6.23–15.58)***# | |
| FGF23 (mg/dL) [median (IQR)] | 274.10 (224.50–362.10) | 427.60 (411.30–463.40) | 1176.30 (1113.70–1200.00)***# | |
| PTH (pg/dL) [median (IQR)] | 647.5 (372.2–1096.8) | 988.0 (842.5–1533.0) | 15 176 (6826–16 869)***## | |
| Aortic osteogenic differentiation | Ca content (µg Ca/mg protein) (median [IQR]) | 8.75 (7.14–10.59) | 36.33 (22.72–60.11) | 155.33 (66.94–396.39)** |
| mRNA Runx2 (RU) [median (IQR)] | 0.97 (0.80–1.18) | 1.97 (1.66–2.31) | 6.69 (3.67–8.35)*** | |
| mRNA Osx (RU) [median (IQR)] | 1.13 (0.79–1.22) | 1.18 (1.04–1.56) | 1.67 (1.61–2.04)** | |
| mRNA α-actin (RU) (mean ± SD) | 1.00 ± 0.37 | 0.28 ± 0.27** | 0.38 ± 0.21** | |
| Aortic miR expression | miR-145/U6 (RU) [median (IQR)] | 0.82 (0.67–1.37) | 0.34 (0.26–0.39)** | 0.31 (0.15–0.36)** |
| miR-122–5p/U6 (RU) [median (IQR)] | 0.83 (0.79–1.12) | 0.03 (0.02–0.10)* | 0.05 (0.05–0.07)* | |
| miR-486/U6 (RU) [median (IQR)] | 1.05 (0.74–1.05) | 0.41 (0.28–0.55)* | 0.16 (0.14–0.18)** | |
| miR-598–3p/U6 (RU) [median (IQR)] | 0.90 (0.57–1.35) | 0.33 (0.16–0.55) | 0.07 (0.01, 0.36)** |
Reference, sham-operated rats. Data represent median [interquartile range (IQR)] or mean ± standard deviation (SD).
*P < .05, **P < .01, ***P < .001 versus Reference; #P < .05, ##P < .01, ###P < .001 versus CRF + NP.
From the 16 miRs selected from the sequencing with a fold change >1.5 between non-calcified and calcified aortas, eight were upregulated and eight downregulated (Phase 1) (Table 1); only miR-122-5p, miR-486 and miR-145 showed lower aortic levels in the two groups with CRF, whereas miR-598-3p showed lower aortic levels only in the CRF + HP group (Table 2). In the serum of rats with CRF, exclusively two out of the four previous miRs were detected (miR-145 and miR-486), and they showed significantly lower serum levels only in the CRF + HP group (Fig. 1). The aortic and serum levels of miR-145 and miR-486 positively correlated with creatinine clearance but not with the other biochemical parameters studied (Supplementary data, Fig. S1).
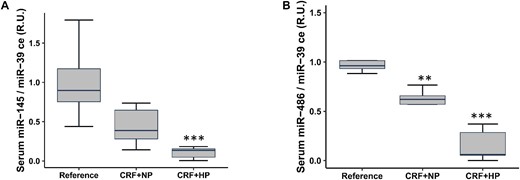
Serum levels of miRs in rats with non-calcified and calcified aortas (Phase 2). Serum levels of miR-145 (A) and miR-486 (B) in control and CRF rats after 14 weeks. Reference, sham-operated rats. Data represent median (IQR) values. **P < .01, ***P < .001 versus Reference.
Phase 3a human study: Ca content and miRs expression in epigastric arteries
The relevant parameters of the kidney transplant recipients are depicted in Table 3. No significant differences in age, sex, body mass index (BMI), smokers and serum levels of Ca, P and PTH were found in patients with or without VC (data not shown). The median age of kidney donors, 54.00 years (49.00–62.00), was not significantly different from the kidney recipients, 61.00 years (57.00–65.00). The Ca content of the epigastric arteries from kidney transplant recipients showed higher values and a great dispersion, but not significant differences, when compared with kidney donors [146.34 µg Ca/mg protein (12.75–1898.68) recipients vs 15.60 μg Ca/mg protein (13.90–19.32) donors]. The levels of miR-145 and miR-486 in the epigastric arteries were significantly lower in the group of kidney transplant recipients (Fig. 2A and B), and in both groups they inversely correlated with the Ca content of the epigastric arteries (R = –0.41, P = .013 and R = –0.33, P = .045, respectively) (Supplementary Fig. S2 A and B). In the kidney recipients, miR-145 and miR-486 showed an inverse correlation with KI (KI—miR-145 R = –0.44, P = .024; KI—miR-486 R = –0.54, P = .004; Supplementary data, Fig. S2C and D).
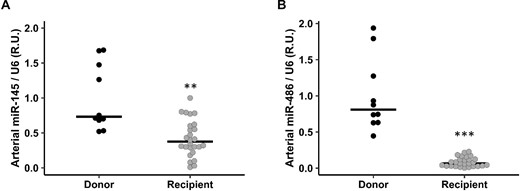
miR-145 and miR-486 levels in epigastric arteries from kidney transplant donors and recipients (Phase 3a). Arterial level of miR-145 (A) and miR-486 (B) in donor group (black spots) and recipients (grey spots). Horizontal rows show median. **P < .01, ***P < .001 versus donor group.
Relevant demographic, clinical and biochemical parameters from 30 kidney transplant recipients (Phase 3a) in whom epigastric arteries were collected.
| Age (years) [median (IQR)] | 61.00 (57.00–65.00) |
| Sex (males %) | 75.86 |
| VC (%) (KI > 0) | 82.50 |
| BMI (kg/m2) (mean ± SD) | 26.82 ± 3.60 |
| Smokers (%) | 27.59 |
| Ca (mg/dL) (mean ± SD) | 9.26 ± 0.58 |
| P (mg/dL) (mean ± SD) | 4.36 ± 0.99 |
| PTH (pg/mL) [median (IQR)] | 243.00 (128.00–283.00) |
Data represent percentage (%), median (IQR) or mean ± SD.
Phase 3b human study: VC and miRs expression in serum of the general population
In the general population (EVOS), no significant differences in age, sex, BMI, smokers and serum levels of Ca, P and PTH were found among the three groups. The two groups with VC showed significantly lower serum levels of miR-145. The serum miR-486 level was significantly lower only in the group with severe VC (Table 4).
Demographic parameters, serum biomarkers and serum levels of miR-145 and miR-486 in general population with different degree of aortic calcification (EVOS) (Phase 3b).
| No VC (n = 39) | Mild VC (n = 16) | Severe VC (n = 21) | P | |
|---|---|---|---|---|
| Age (years) (mean ± SD) | 61.61 ± 6.82 | 62.89 ± 8.16 | 64.85 ± 7.07 | .257 |
| Sex (males %) | 38.46 | 50.00 | 47.62 | .663 |
| BMI (Kg/m2) (mean ± SD) | 27.34 ± 4.09 | 27.34 ± 3.17 | 27.55 ± 3.40 | .975 |
| Smokers (%) | 12.82 | 26.67 | 28.57 | .267 |
| Ca (mg/dL) (mean ± SD) | 9.35 ± 0.32 | 9.29 ± 0.33 | 9.47 ± 0.28 | .189 |
| P (mg/dL) (mean ± SD) | 3.55 ± 0.41 | 3.54 ± 0.52 | 3.57 ± 0.39 | .978 |
| PTH (pg/mL) [median (IQR)] | 44.00 (33.50–59.00) | 49.00 (34.75–80.00) | 54 (47.00–63.00) | .103 |
| miR-145 (RU) [median (IQR)] | 1.00 (0.23–5.69) | 0.04 (0.02–0.45)* | 0.02 (0.006–0.12)*** | <.001 |
| miR-486 (RU) [median (IQR)] | 1.00 (0.41–6.28) | 0.49 (0.19–1.61) | 0.05 (0.01–1.43)*** | .003 |
n, number of patients available. Data represent percentage (%), median (IQR) or mean ± SD. *P < .05, ***P < .001 versus no VC group.
The ROC curve showed that the area under the curve (AUC) was better for serum miR-145 compared with serum miR-486 (0.827 vs 0.715, Fig. 3A and B). The combination of miR-145 and miR-486 did not show a better ROC curve. Since the two variables did not follow a normal distribution, a logarithmic transformation and a binary logistic regression was performed. Bivariate analysis showed that both, miR-145 and miR-486, correlated with VC (P = .00105 and P = .0089, respectively; Supplementary Fig. S3A and B). After multivariate analysis, miR-145 showed a significant correlation with VC (P = .017) but not miR-486 (P = .563).
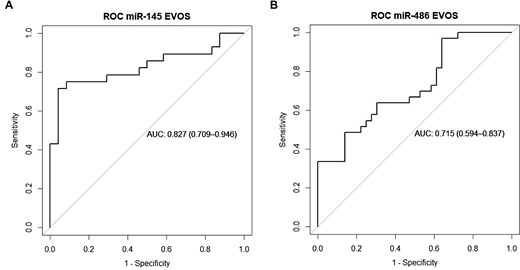
ROC curve of serum miR-145 (A) and miR-486 (B) in general population (EVOS) (Phase 3b). AUC 0.6–0.75 means fair test, AUC 0.75–0.9 means good test.
Phase 4 in vitro study: Ca content and miRs expression in VSMCs exposed to calcifying media
When the A7r5 cells were exposed to different concentrations of P (1, 2 and 3 mM final P concentration) for 3 days, the Ca content of VSMCs showed a P concentration-dependent increase that was statistically significant with 2 and 3 mM P (Fig. 4 and Table 5). The Runx2 and Osx gene expression showed similar behavior to the Ca content, with a significant increase when VSMCs where exposed to 3 mM P. The α-actin gene decreased when the P concentration increased, achieving statistical significance with the highest P concentration (3 mM P). The miR-145 and miR-486 expression significantly decreased when 2 and 3 mM of P were used (Table 5).
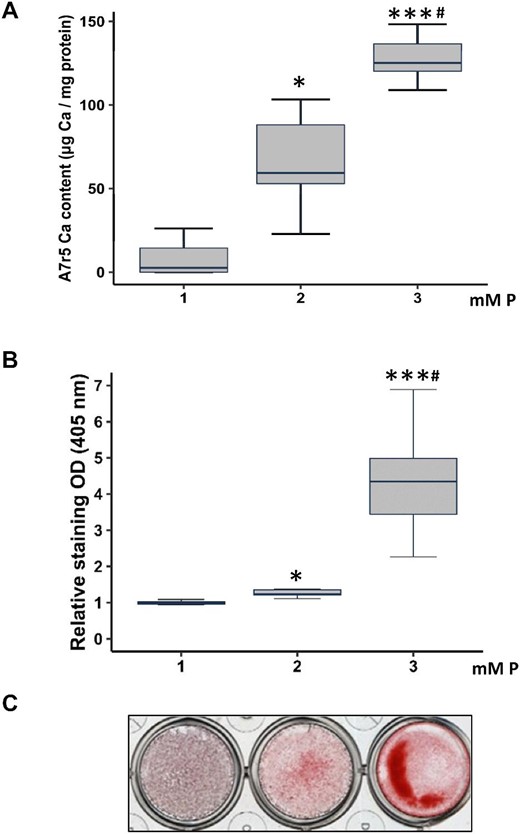
Effects of P (from 1 to 3 mM P) on Ca content in A7r5 cells cultured for 3 days in vitro (Phase 4). DMEM 1 mM P is considered non calcifying media (Non-CM), and 2 and 3 mM are considered calcifying media (CM). Ca deposition determined by o-cresolphtalein complexone method (A) and Alizarin red staining (B) with a representative image of Alizarin red staining (C). Data represent median (IQR). *P < .05, ***P < .001 versus 1 mM P; #P < .05 versus 2 mM P.
Ca content, gene expression of α-actin, Osx, Runx2, miR-145 and miR-486 in A7r5 VSMCs exposed to different P concentration.
| 1 mM P | 2 mM P | 3 mM P | |
|---|---|---|---|
| Ca content (μg Ca/mg protein) [median (IQR)] | 2.56 (0.00–14.45) | 59.34 (52.95–88.14)* | 125.15 (120.20–136.60)***# |
| Runx2 (RU) [median (IQR)] | 0.99 (0.964–1.01) | 1.11 (1.00–1.21) | 1.46 (1.22–1.72)***# |
| Osx (RU) [median (IQR)] | 0.82 (0.78–1.34) | 1.25 (0.91–1.41) | 2.57 (1.41–3.24)**# |
| α-actin (RU) [median (IQR)] | 0.92 (0.86–1.01) | 0.93 (0.74–0.98) | 0.72 (0.69–0.84)**# |
| miR-145 (RU) [median (IQR)] | 0.84 (0.75–1.30) | 0.58 (0.26–0.86)* | 0.37 (0.31–0.53)** |
| miR-486 (RU) (mean ± SD) | 1.00 ± 0.26 | 0.67 ± 0.13* | 0.51 ± 0.15*** |
Data represent median (IQR) or mean ± SD.
*P < .05, **P < .01, ***P < .001 versus 1 mM P; and #P < .05 versus 2 mM P.
The exposure of A7r5 cells to miR-145 and miR-486 mimics led to overexpression of both miRs [for miR-145: control 1 ± 0.46 relative units (RU); miR-145 mimic 110.95 ± 62.61 RU; and for miR-486: control 1 ± 0.51 RU; miR-486 mimic 2404.25 ± 471.15 RU]. The miR-145 and miR-486 overexpression attenuated by 45% and 47%, respectively, the Ca content induced by the calcifying medium (3 mM P, Fig. 5A) and significantly prevented the increase of Osx (Fig. 5B). The overexpression of miR-145, but not of miR-486, decreased Runx2 and increased α-actin expression (Fig. 5C and D).
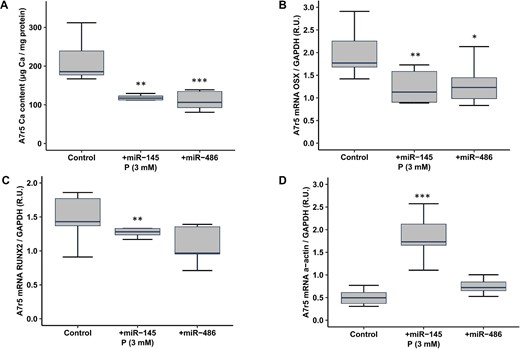
Effect of miR-145 and miR-486 overexpression on A7r5 calcification induced by high P (Phase 4). Ca deposition determined by o-cresolphtalein complexone method (A), expression of: Osx (B), Runx2 (C) and α-actin (D) genes in A7r5 cells expose to calcifying media (CM) (3 mM P), and transfected with negative control (scrambled), miR-145 mimic or miR-486 mimic. Data represent median (IQR). *P < .05, **P < .01, ***P < .001 versus negative control (scramble).
DISCUSSION
The present study, using complementary in vivo (rat and human model) and in vitro approaches, identified that miR-145 and miR-486 were involved in the process of VC and could be used, especially miR-145, as serum biomarkers of VC. Other miRs, like 122-5p and 598-3p, may be also involved, but they were not detected in serum. To achieve these results several stepwise analyses were performed.
In recent years, CKD has become one of the main public health problems mainly due to the demography of the ageing worldwide. So far, an estimated 500 million adults suffer from CKD. Renal replacement therapies (dialysis and kidney transplant) are among the most expensive treatments for chronic diseases. Furthermore, since its early stages, this disorder has been associated with a remarkable increase in cardiovascular all-cause morbidity and mortality [26]. Ageing in the general population and CKD patients is characterized by severe disturbances in the bone–vascular axis which favors, among other things, vascular and soft tissue calcification, increasing the risk of cardiovascular diseases [1, 2]. VC occurs after a process of transdifferentiation of VSMCs to osteoblasts-
like cells that takes place far before the VC can be detected, delaying its management and the possibility of successful outcomes [27, 28].
Serum miRs have been suggested to be valid biomarkers for the diagnosis and/or prognosis of different diseases such as cancer or cardio-cerebrovascular diseases among others [29, 30]. Although several miRs have been found to participate in the process of VC [9, 31, 32], only few of them have been suggested as useful biomarkers of the VSMCs osteogenic differentiation which leads to VC [33]. Phase 1 of our study, comparing severely calcified and non-calcified aortas from rats, allowed the identification of 34 differentially expressed miRs. The 16 miRs with >1.5-fold change expression, plus miR-145, the most abundant miR in normal arteries and VSMCs [18], were selected to be validated in the following phases with the aim of identifying serum miRs that can reflect what is happening in the arteries.
In Phase 2, as expected, the CRF rats which received a high P load during 14 weeks (CRF + HP group) showed the lowest renal function and the worst serum values for P, Ca, PTH and FGF23 (Table 2). When the aortas of these rats were studied, only four out of the 17 miRs selected—miR-145, miR-486, miR- 122-5p and miR-593-3p—showed, in the CRF + HP group, a significant decrease in the aortic levels with increase in Ca aortic content (Table 2). In this rat model, vascular calcification was associated with the loss of the contractile marker α-actin and with an increase of osteogenic genes (Runx2 and Osx) and these changes were exacerbated in the presence of high P [34]. However, it is important to note that the rats with no high exposure to P (CRF + NP), also showed a phenotypic transdifferentiation of VSMCs (significant decrease in aortic expression of α-actin and a trend to elevate aortic Ca content), with no elevation in serum P but with significant decrease in miR-145 and miR-486. This fact suggests that the decreases observed in the miRs are not only due to the increase in P exposure, but also to other non-measured factors that can influence the phenotypic changes occurring in the VSMCs.
Unfortunately, the remarkable decrease in the four miRs detected in the aorta of the rats was not mimicked by the serum results, where only two out of the four miRs detected in the aorta, miR-145 and miR-486, showed a significant reduction in serum (Fig. 1). This fact limited the possible use of these set of four miRs as potential panel of non-invasive serum biochemical markers of VC.
In Phase 3, miR-145 and miR-486, the two miRs in which were found the most consistent results associated to VC, were tested in two different populations, (i) kidney transplant recipients and (ii) in a randomly selected general population from the EVOS.
In the CKD patients, the epigastric arteries from kidney transplant recipients showed a high prevalence (82.5%) of VC but there were no differences in current demographic parameters such as age and gender, and serum biochemical parameters (Ca, P and PTH), between kidney transplant recipients with and without VC. The mentioned lack of differences in the currently used parameters used to assess CKD–mineral and bone disorder clearly emphasizes the need to have more specific and sensitive markers of VC in CKD patients [35, 36].
The epigastric artery levels of miR-145 and miR-486 were significantly lower in kidney recipients compared with kidney donors (Fig. 2). Furthermore, the KI of kidney recipients inversely correlated with miR-145 and miR-486 levels, highlighting the potential use of these two miRs as biomarkers of VC (Supplementary data, Fig. S2C and D).
Regretfully, an important limitation of the study is that serum from the kidney transplanted recipients was not available at the time of the present study, a fact which impeded study of the expression of miRs in the arteries and serum of the CKD transplanted patients. Therefore, in order to perform a human serum validation of miR-145 and miR-486 as markers of VC, frozen-stored serum from a randomized general population (in whom a complete study of VC was carried out and published) was used (EVOS study) [22]. In the EVOS population, serum levels of miR-145 and miR-486 showed significant relevant differences according to the severity of the aortic calcification (Table 4). In fact, the group with severe aortic VC showed a 50- and 20-fold decrease in miR-145 and miR-486, respectively, compared with the group without aortic calcification, and a 25-fold decrease in miR-145 in the mild VC group. The ROC curves (Fig. 3) confirmed the importance of these results, showing that miR-145 was a specific and sensitive serum marker of VC, with a better profile than miR-486.
In the in vitro experiments, the exposure of VSMCs to different P concentrations showed the same trend of results of those observed in the groups of CRF rats fed a high P diet. The exposition to the highest concentration of P (3 mM P), increased the Ca VSMCs content, Osx and Runx2 expression, and reduced α-actin, miR-145 and miR-486 (Fig. 4 and Table 5). The overexpression of both miRs partially prevented the Ca increase induced by the calcifying medium, reducing the increase of Osx and Runx2 and the decrease in α-actin (the last two changes occurred only in the miR-145 overexpression), pointing to its direct implication in the VSMCs transdifferentiation and consequent calcification.
The miR-145 has been shown in vivo and in vitro to be critical for the VSMCs phenotype modulation and proliferation [18, 37, 38]. miR-145 is mainly expressed in the VSMCs of the normal arteries, in which it has been identified as the most abundant and highly expressed miR, and some studies attribute to miR-145 a direct role in vascular calcification. Its expression is decreased in human VSMCs exposed to high phosphate concentrations and in aortas from Apoe-deficient mice [8, 39, 40]. It is described that miR-145 target the osteogenic transcriptional factor Osx and the novel transcription factor of osteoblast differentiation Krüppel-like factor 4 (KLF4) [7, 38, 41], which direct regulates Runx2 [42, 43]. Moreover, the overexpression of miR-145 increased the expression of the contractile markers as α-actin, calponin and smooth muscle myosin heavy chain (SM-MHC), but its inhibition produced a phenotypic transdifferentiation to an osteogenic phenotype with reduction α-actin and (SM-MHC) [17, 18]. The value of miR-145 as a biomarker of cardiovascular disorders has been associated not only in studies related to VC but also in other cardiovascular disorders such as coronary artery disease [44].
The role of miR-486 in VSMCs and VC is less clear and even contradictory. In fact, some studies described that the augmenting of miR-486 in aortic valve interstitial cells was associated with increase in osteogenic markers, such as Runx2 and Osx [45, 46], meanwhile others described that calcified bicuspid aortic valve leaflets showed a significant reduction in miR-486 [47]. Furthermore, it has been described in murine macrophage cells that miR-486 inhibited the Nuclear factor of activated T cell cytoplasmic 1 (NFATc1) [48], which is a master transcription factor of the osteoclast differentiation, but also it has been identified as modulator of the transdifferentiation of human coronary artery smooth muscle cells to osteoblasts like phenotype [49]. Another possible mechanism by which miR-486 may regulate VC is through the control of apoptosis [50]; in fact, it has been described that silencing of miR-486 increased the rate of apoptosis in cardiomyocytes [51]. In our study, the overexpression of miR-486 showed a protective role of this miR in VC, though more studies are needed to determine more precisely its role in VC.
Despite there still some controversies [52, 53], it seems that several miRs could be involved in the process of VC. To support their possible role, our in vivo and in vitro studies indicate that a relevant number of them are differentially expressed in calcified and non-calcified arteries. The careful and progressive stepwise analyses performed in the CRF rat model, the human epigastric arteries from kidney recipients and the serum from general population have shown that only miR-145, and to a lesser degree miR-486, showed consistent results as serum levels of these two miRs inversely correlated with the transdifferentiation from contractile to osteogenic phenotypes across all models.
An important limitation of our study is that the serum levels of miR-145 and miR-486 were evaluated at a single point in time and the individuals were not followed up. A prospective medium- or long-term information of these two miRs may have allowed us to study the association between them and the potential changes in VC.
The in vitro results supported the in vivo results, showing that the overexpression of miR-145 and miR-486 reduced the gene osteogenic changes and the Ca deposition in VSMCs. In summary, the combination of the in vivo and in vitro results, suggest that miR-145 and miR-486 have a promising profile that allow to position them as potential non-invasive biomarkers of VC.
ACKNOWLEDGEMENTS
The authors would like to thank Dreamgenic for the advice on the analysis of the sequencing of the miRs and ALCER (Asociación para la lucha contra las enfermedades renales) for its support.
FUNDING
This study has been funded by Instituto de Salud Carlos III through the projects ‘PI17/00715, PI19/00532, PI20/00753, PI20/00633’ (Co-funded by European Regional Development Fund/European Social Fund ‘A way to make Europe’/‘Investing in your future’), the ISCIII Retic REDinREN (RD16/0009/0017) and RICORS2040 (Kidney Disease), Plan de Ciencia, Tecnología e Innovación 2013–2017 y 2018–2022 del Principado de Asturias (GRUPIN14-028, IDI-2018–000152, IDI-2021–000080), Fundación Renal Iñigo Álvarez de Toledo (FRIAT). S.F.-V. and B.M.-C. were supported by a graduate fellowship from the Gobierno del Principado de Asturias (‘Severo Ochoa’ program BP 20-081 and BP 19-057), J.M.-V. by a graduate fellowship from the Ministerio de Ciencia, Innovación y Universidades (FPU program FPU 2019-00483), C.A-M. by RICORS2040 (Kidney Disease), N.C.-L by IDI-2018-000152 and IDI-2021-000080, and S.P. was supported by Fundación para la Investigación Biosanitaria de Asturias (FINBA). Funding for open Access Charge: Fundación para la Investigación e Innovación Biosanitaria (FINBA).
AUTHORS’ CONTRIBUTIONS
Conceptualization, A.S.D., M.N.-D., J.B.C.-A, N.C.-L. and S.P.; methodology, S.F.-V., B.M.-C., J.M.-V., C.A.-M. and S.P.; software, S.F.-V., B.M.-C. and J.L.F.-M.; validation, M.N.-D., J.B.C.-A., N.C.-L. and S.P.; formal analysis, S.F.-V., B.M.-C., J.L.F.-M. and S.P.; investigation, S.F.-V, C.A.-M., N.C.-L. and S.P.; resources, S.L.-O., R.G.-C., J.L.F.-M. and S.P.; data curation, S.F.-V., B.M.-C., J.M.-V., S.L.-O., C.P.-A., N.C.-L. and S.P.; writing original draft preparation, S.F.-V., M.N.-D., J.B.C.-A., N.C.-L. and S.P.; writing review and editing, S.F.-V., N.C.-L., M.N.-D., J.B.C.-A. and S.P.; visualization, N.C.-L., S.P., J.B.C.-A., M.N.-D. and A.S.D.; supervision, M.N.-D., J.B.C.-A., N.C.-L. and S.P.; funding acquisition, C.A.-M., J.L.F.-M., M.N.-D., J.B.C.-A., N.C.-L. and S.P. All authors have read and agreed to the published version of the manuscript.
DATA AVAILABILITY STATEMENT
The data underlying this article will be shared upon reasonable request to the corresponding author.
CONFLICT OF INTEREST STATEMENT
None declared.
REFERENCES
Author notes
Equal contribution as first authors.
Equal contribution as corresponding authors.
Equal contribution as senior authors.


Comments