


ABSTRACT
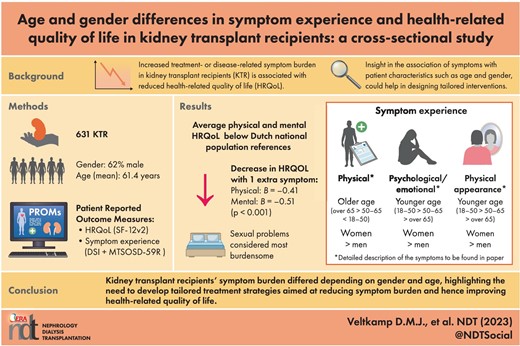
Health-related quality of life (HRQOL) is an increasingly important patient-reported outcome in kidney transplant recipients (KTRs). This study explored relationships between symptom prevalence and burden with HRQOL, and age and gender differences in symptom experience.
Eligible Dutch KTRs transplanted in Leiden University Medical Center were invited for this cross-sectional study. HRQOL, and occurrence and burden of 62 symptoms were measured using validated questionnaires. Univariate and multivariate regression analysis were used for investigating the associations of symptom experience with mental and physical HRQOL, and differences in symptom experience between genders and KTRs of diverse age groups.
A total of 631 KTRs were analyzed; the mean (standard deviation) age was 61.3 (11.3) years, and 62% were male. The median (interquartile range) number of symptoms was 14 (7–22), with a burden of 20 (8–37; range 0–244). Per extra symptom, physical and mental HRQOL decreased [–0.41 (–0.50; –0.31) and –0.51 (–0.59; –0.42), respectively, P < .001]. Most occurring symptoms were bruises, tiredness, lack of energy, urge to urinate at night and dry skin. Sexual problems were considered most burdensome. Female KTRs reported more symptoms than men. Amongst others, younger KTRs experienced more (18–50 > 50–65 ≥65 years) feelings of depression and both female and younger KTRs reported higher symptom prevalence concerning changes in physical appearance.
KRTs’ symptom experience differed depending on gender and age, highlighting the need to develop tailored treatment strategies to reduce symptom experience and subsequently improve HRQOL.
What is already known about the subject?
Physical and mental health-related quality of life (HRQOL) are lower in kidney transplant recipients (KTRs) versus the general population (in the long term).
Increased treatment- or disease-related symptom burden in KTRs is associated with reduced HRQOL. Increased knowledge concerning symptom experience in KTRs is warranted to develop effective tailored interventions aimed at improving HRQOL.
What this study adds?
The most frequently reported symptoms were bruises, feeling tired and lack of energy, increased urge to urinate at night, dry skin, bone or joint pain, muscle cramps and weakness, trouble staying asleep and erectile problems. Sexual problems were the most burdensome.
Symptom experience differed between age and gender, e.g. the younger the age, the more feelings of depression were experienced (18–50 years > 50–65 years > ≥65 years old); female and younger KTRs reported higher symptom prevalence concerning changes in physical appearance.
What impact this may have on practice or policy?
This study shows KTRs’ symptom experience differed between genders and KTRs or different ages, and thereby emphasizes the need to develop tailored interventions on an individual and a populational level aimed at reducing symptom experience and improving HRQOL in KTRs.
INTRODUCTION
Kidney transplantation is the preferred kidney replacement therapy in most patients with end-stage kidney failure. Research in the past has shown that transplantation has a beneficial effect on survival compared with chronic dialysis in younger patients [1, 2]. Nowadays, patients’ perspectives on, amongst other things, their health-related quality of life (HRQOL) and treatment-related side-effects play an increasingly important role in choice of treatment next to conventional clinician-reported outcomes of transplantation such as graft survival, acute rejection and mortality [3, 4]. Patients’ perspectives on their health can be expressed by patient-reported outcomes (PROs), obtained using patient-reported outcome measures (PROMs) [5].
The growing acknowledgement of PROs as valuable treatment outcomes is caused by progression in the field of kidney transplantation. Amongst others, the arsenal of immunosuppressive strategies in kidney transplant medicine has expanded over the last decades. This evolution has given opportunity to balance side-effects of immunosuppressive medication with risk of rejection more individually [6]. Additionally, an increasing number of elderly patients receive a donor kidney as part of the Eurotransplant Senior Program, even though the survival benefit of kidney transplantation is less clear in the elderly [7]. These developments emphasize the importance of the HRQOL benefit of transplantation, especially in septua- and octogenarians. Also, poor perceived HRQOL is associated with worse treatment adherence [8] and (subsequently) higher risk of rejection and mortality [9, 10]. Insight into PROs gives the opportunity to design tailored (e.g. to age) interventions to conceivably improve healthcare and thereby treatment outcomes at individual and populational levels [3, 11].
Previous studies investigated HRQOL in kidney transplant recipients (KTRs) in comparison with the general population. These studies showed that, in the long term, physical and mental HRQOL are lower in KTRs versus the general population [12]. Furthermore, previous research in KTRs has shown that increased treatment- or disease-related symptom burden is associated with reduced HRQOL [8, 10, 13, 14]. Increased knowledge concerning symptom experience (occurrence and burden) in KTRs is warranted to develop effective interventions aimed at improving HRQOL. Additionally, insight into associations of symptom experience with patient characteristics such as gender and age could help in tailoring these interventions. To the best of our knowledge, so far only one small study (n = 110) has been conducted using 26 symptoms in KTRs [15]. A larger study using a broader range of symptoms would increase our insight into KTRs’ symptom experience and advance generalizability.
Therefore, this study aims to (i) explore symptom occurrence and burden of 62 symptoms in a large cohort of KTRs; (ii) investigate relationships between symptom prevalence and burden with mental and physical HRQOL; (iii) explore differences in symptom occurrence and burden between KTRs of different sexes and age categories, divided by time post-transplantation (1–5, 5–15, ≥15 years post-transplantation).
MATERIALS AND METHODS
This cross-sectional study was performed at Leiden University Medical Centre (LUMC) in Leiden, The Netherlands. HRQOL and symptom experience were measured using PROMs, filled out in October 2020. The following KTRs, who underwent transplantation in LUMC, were included in the study: (i) KTRs of ≥18 years old at times of the study; (ii) KTRs with a functioning graft; (iii) KTRs who visited LUMC's transplant clinic at least once after December 2010 in order to have a more actively followed patient population; and (iv) KTRs who had a sufficient understanding of the Dutch language. Patients with a simultaneous pancreas–kidney transplantation were excluded. KTRs who received their transplant after March 2019 were not invited since they were already involved in a longitudinal study concerning PROMs post-transplantation [3]. Informed consent for research purposes was included in the questionnaire. This study was approved by LUMC's institutional review board and conducted following national guidelines for medical scientific research. The Strengthening The Reporting of OBservational Studies in Epidemiology (STROBE) guideline was followed for the reporting of the study [16].
PROMs
The PROMs consist of validated questionnaires assessing physical and mental HRQOL and disease- and treatment-related symptom burden mirroring the Dutch national dialysis PROMs with added information on transplant symptoms [17]. The 12-item Short-Form Health Survey version 2 (SF-12v2) was used for measuring HRQOL, with scores divided into mental and physical component summary scores, hereafter called mental and physical HRQOL (summarizing physical functioning/role-physical/bodily pain/general health/vitality/social functioning/role-emotional/mental health [18]). Mental and physical HRQOL are calculated by norm-based scoring algorithms, ranging from 0 to 100 [standardized to the US general population with mean scores (standard deviations, SD) of 50 (10)], where a higher score indicates better HRQOL. The SF-12 is used routinely within the Dutch dialysis population [19, 20].
For the assessment of KTRs’ symptom experience, no international agreement on the use of a particular instrument has been achieved [19]. Therefore, we combined the Dialysis Symptom Index (DSI) with the Modified Transplant Symptom Occurrence and Symptom Distress Scale-59 Items Revised (MTSOSD-59R) to cover kidney disease-specific and immunosuppressant-specific symptoms [21, 22]. The DSI is used routinely in Dutch dialysis care. Previous research has shown that the DSI is also suitable in KTRs [23]. Duplicate questions were removed, leaving us with 62 symptoms (menstrual problems only for women, erectile problems only for men), maximum 61 per patient. Following the DSI template, for each symptom patients were asked to indicate if the symptom was present in the past week (yes/no). If present, KTRs had to indicate how much it bothered them on a scale ranging from 0 (“not at all”) to 4 (“very much”). The total symptom burden score is calculated by summation of all symptom burden scores (maximum 244).
Data collection
PROMs were administered electronically (ePROMs). A link to the ePROMs was sent to participants via e-mail. Non-responders received a reminder after 7–14 days. If no e-mail address was known, a paper questionnaire was sent once by regular mail. The following sociodemographic and clinical patient characteristics were collected via the questionnaire, as part of standard medical care or as routine registration for transplant procedure in the Netherlands Organ Transplant Registry (NOTR): age, gender, socioeconomic status (SES; obtained by linking the postcode with the SES score per postcode area reported by the Netherlands Institute for Social Research [24], divided into three levels: low/medium/high), primary kidney disease which was categorized according to the ERA coding system into eight categories [glomerulonephritis, interstitial nephritis/pyelonephritis, cystic kidney disease, congenital/hereditary kidney disease, renal vascular disease, diabetes mellitus, other, unknown (including missing) [25]], estimated glomerular filtration rate (eGFR), de novo donor-specific antigens (dnDSAs) (present vs absent/unknown), donor type (living/deceased), pre-emptive transplantation (yes/no), time post-transplantation, anti-diabetic or anti-hypertensive medication prescription, and type of immunosuppressants at times of the study.
Statistical analysis
Continuous variables are shown as mean (SD) for normally distributed variables or median [interquartile range (IQR)] for skewed variables, and categorical variables as numbers (%). A list of the examined symptoms with their occurrence and mean burden score was presented to describe symptom experience in the study population.
The associations of symptom prevalence and symptom burden with mental and physical HRQOL were investigated with linear regression analysis. All residuals were plotted to check linearity assumption. We adjusted for possible confounders: age, gender, time post-transplantation, SES, primary kidney disease, donor type, pre-emptive transplantation, dnDSAs and eGFR.
Thereafter we analyzed associations of age and gender with the number of experienced symptoms and amount of symptom burden with univariate linear regression analysis. We did not identify factors that could have influenced the variables “age” or “gender” that we should adjust for.
Due to the cross-sectional design, time post-transplantation was not equal for all participants. Therefore, a separate regression analysis was performed to investigate whether the amount of symptoms and the total symptom burden was different for KTRs with different time-spans post-transplantation (divided into three categories: 1–5, 5–15, ≥15 years). Here we adjusted for the possible confounder “age.”
The differences in symptom prevalence and burden per individual symptom between genders, and KTRs of different ages (18–50, 50–65, ≥65 years) were analyzed using univariate logistic and univariate linear regression analysis, respectively. The group was split according to time post-transplantation to account for the heterogeneity (1–5, 5–15, ≥15 years). We used the Benjamini and Hochberg procedure (10% false discovery rate) to determine the highest P-value that indicates significant difference to adjust for multiple testing [26].
To identify differences between responders and non-responders, T-tests and Chi-squared tests of association were used. Since filling out all PROM questions was mandatory (patients were contacted by the outpatient clinic if the form was not filled out completely), there are no missing data. Statistical significance was assumed by a P-value of <.05 unless otherwise stated. SPSS version 25.0 (IBM, Armonk, NY, USA) was used to perform statistical analysis.
RESULTS
Patient characteristics
Of 1493 prevalent KTRs, 543 completed the ePROMs and an additional 131 patients returned the paper version PROMs. After exclusion of patients who did not provide informed consent (n = 34), 631 KTRs (42% of invited KTRs) were included (Fig. 1). Mean (SD) age was 61.4 (11.3) years, 62% were male, median (IQR) time post-transplantation was 9.1 (4.9–15.1) years, 32% had a pre-emptive transplantation, and 61% of the transplants were from a living donor (Table 1). Younger KTRs (18–50 years) were on average transplanted less long ago, had slightly higher eGFR and were more often pre-emptively transplanted. KTRs aged ≥65 years were more often on duo immunosuppressive therapy and had higher SES (Table 1). No differences between genders were found (Table 1).
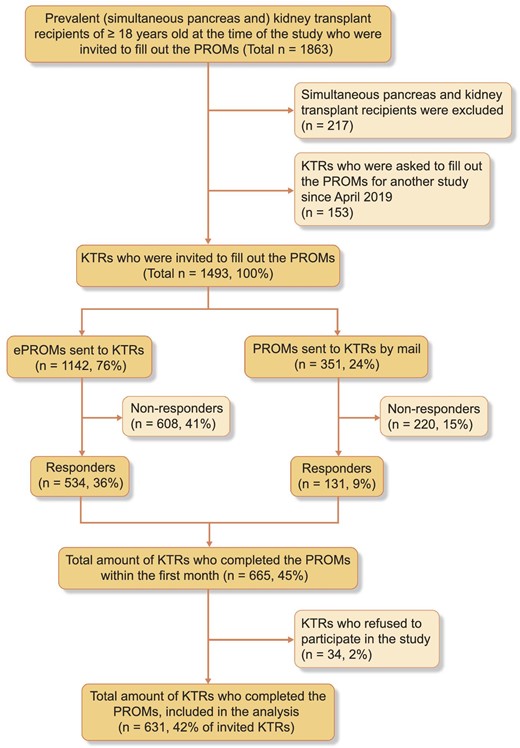
Flow-chart of patient inclusion.
Patient characteristics (n = 631).
| Kidney transplant recipients | Total (n = 631) | Men (n = 394) | Women (n = 237) | 18 to <50 years (n = 101) | 50 to <65 years (n = 264) | ≥65 years (n = 266) |
|---|---|---|---|---|---|---|
| Gender, male, n (%) | 394 (62) | 394 (100) | 0 (0) | 65 (64) | 162 (61) | 167 (63) |
| Mean (SD) age at times of the survey, years | 61.4 (11.3) | 61.2 (11.4) | 61.8 (11.1) | 42.7 (6.2) | 58.1 (4.2) | 71.7 (4.4) |
| ≥18 to <50 years, n (%) | 101 (16) | 65 (17) | 36 (15) | 65 (100) | 0 (0) | 0 (0) |
| ≥50 to <65 years, n (%) | 264 (42) | 162 (41) | 102 (43) | 0 (0) | 162 (100) | 0 (0) |
| ≥65 years, n (%) | 266 (42) | 167 (42) | 99 (42) | 0 (0) | 0 (0) | 167 (100) |
| Median (IQR) time since kidney transplantation, years | 9.1 (4.9–15.1) | 9.0 (4.6–15.2) | 9.2 (5.4–15.2) | 7.1 (3.5–12.2) | 9.2 (4.5–16.0) | 9.9 (5.8–15.7) |
| ≥1 to <5 years, n (%) | 158 (25) | 105 (27) | 53 (22) | 36 (36) | 70 (27) | 52 (20) |
| ≥5 to <15 years, n (%) | 312 (49) | 188 (48) | 124 (52) | 51 (51) | 120 (46) | 141 (53) |
| ≥15 years, n (%) | 161 (26) | 101 (26) | 60 (25) | 14 (14) | 74 (28) | 73 (27) |
| Mean (SD) recent eGFR, mL/min/1.73 m2a | 49.4 (16.8) | 49.7 (16.3) | 48.9 (17.7) | 54.0 (17.6) | 49.0 (16.6) | 47.7 (16.3) |
| <30 mL/min/1.73 m2, n (%) | 62 (13) | 37 (12) | 25 (14) | 6 (7) | 26 (12) | 30 (15) |
| ≥30 to <60 mL/min/1.73 m2, n (%) | 291 (59) | 183 (59) | 108 (60) | 50 (59) | 124 (59) | 117 (59) |
| ≥60 mL/min/1.73 m2, n (%) | 138 (28) | 91 (29) | 47 (26) | 29 (34) | 59 (28) | 50 (25) |
| Pre-emptive kidney transplantation, n (%)a | 187 (30) | 112 (28) | 75 (32) | 42 (42) | 68 (26) | 77 (29) |
| Primary cause of kidney failure, n (%)a | ||||||
| Glomerulonephritis | 160 (25) | 107 (27) | 53 (22) | 36 (36) | 60 (23) | 64 (24) |
| Interstitial nephritis or pyelonephritis | 61 (10) | 32 (8) | 29 (12) | 13 (13) | 25 (9) | 23 (9) |
| Cystic kidney diseases | 141 (22) | 89 (23) | 52 (22) | 12 (12) | 63 (24) | 66 (25) |
| Other congenital/hereditary kidney diseases | 16 (3) | 11 (3) | 5 (2) | 4 (4) | 10 (4) | 2 (1) |
| Renal vascular disease | 60 (10) | 41 (10) | 19 (8) | 6 (6) | 21 (8) | 33 (12) |
| Diabetes mellitus | 33 (5) | 22 (6) | 11 (5) | 4 (4) | 14 (5) | 15 (6) |
| Other diseases | 46 (7) | 22 (6) | 24 (10) | 5 (5) | 24 (9) | 17 (6) |
| Unknown cause | 100 (16) | 62 (16) | 38 (16) | 20 (20) | 43 (16) | 37 (14) |
| Current treatment with anti-diabetic or anti-hypertensive drugs, n (%)a | ||||||
| Anti-diabetic drugs | 125 (20) | 80 (20) | 45 (19) | 12 (12) | 43 (16) | 70 (26) |
| Anti-hypertensive drugs | 227 (36) | 143 (36) | 84 (35) | 47 (47) | 91 (34) | 89 (33) |
| De novo DSAs, n (%)a | 124 (20) | 74 (19) | 50 (21) | 25 (25) | 55 (21) | 44 (17) |
| Donor type, n (%)a | ||||||
| Living donor | 376 (60) | 237 (60) | 139 (59) | 73 (72) | 152 (58) | 151 (57) |
| Donation after brain death | 144 (23) | 78 (20) | 66 (28) | 19 (19) | 68 (26) | 57 (21) |
| Donation after cardiac death | 101 (16) | 73 (19) | 28 (12) | 8 (8) | 42 (16) | 51 (19) |
| Immunosuppressive regime, n (%)a | ||||||
| Prednisone + MPA/MPS + CNI | 242 (38) | 146 (37) | 96 (41) | 47 (47) | 113 (43) | 82 (31) |
| Prednisone + CNI | 152 (24) | 100 (25) | 52 (22) | 23 (23) | 50 (19) | 79 (30) |
| Other | ||||||
| Prednisone + MPA/MPS | 85 (13) | 50 (13) | 35 (15) | 7 (7) | 36 (14) | 42 (16) |
| Belatacept based | 10 (2) | 5 (1) | 5 (2) | 1 (1) | 4 (2) | 5 (2) |
| Azathioprine based | 27 (4) | 15 (4) | 12 (5) | 3 (3) | 9 (3) | 15 (6) |
| mTOR inhibitor based | 36 (6) | 33 (8) | 9 (4) | 12 (12) | 19 (7) | 11 (4) |
| Corticosteroid free | 18 (3) | 13 (3) | 5 (2) | 3 (3) | 12 (5) | 3 (1) |
| CNI, n (%)a | ||||||
| Tacrolimus | 348 (55) | 218 (55) | 130 (55) | 65 (64) | 148 (56) | 135 (51) |
| Ciclosporin | 85 (13) | 54 (14) | 31 (13) | 13 (13) | 34 (13) | 38 (14) |
| SES, n (%)a | ||||||
| Low | 65 (10) | 44 (11) | 21 (9) | 19 (19) | 28 (11) | 18 (7) |
| Middle | 399 (63) | 247 (63) | 152 (64) | 56 (55) | 165 (63) | 178 (67) |
| High | 162 (26) | 99 (25) | 63 (27) | 24 (24) | 69 (26) | 69 (26) |
| Total symptom prevalence, median (IQR) | 14 (7.0–22.0) | 11.0 (6.0–20.0) | 18.0 (10.0–25.5) | 13.0 (6.0–22.0) | 15.0 (7.0–23.0) | 13.0 (7.0–22.0) |
| Total symptom burden, median (IQR) | 20 (8.0–37.0) | 16.0 (8.0–35.3) | 29.0 (14.0–44.5) | 17.0 (6.0–34.0) | 20.0 (9.0–37.0) | 21.0 (9.0–38.3) |
| Physical HRQOL, mean (SD) | 43.7 (11.0) | 45.0 (10.7) | 41.5 (11.0) | 49.5 (9.0) | 44.1 (10.7) | 41.2 (11.1) |
| Mental HRQOL, mean (SD) | 47.8 (9.9) | 48.4 (10.3) | 46.9 (9.2) | 46.1 (11.0) | 47.2 (9.9) | 49.2 (9.4) |
DSA, donor-specific antibody; CNI, calcineurin inhibitor (tacrolimus/ciclosporin); MPA, mycophenolic acid; MPS, mycophenolate sodium; mTOR, mammalian target of rapamycin inhibitor (everolimus/sirolimus).
Percentages of available data:
Total: primary cause of kidney failure (98%); use of anti-diabetic drugs (90%); use of anti-hypertensive drugs (47%); recent eGFR (78%); dnDSAs (present vs absent/not tested) (84%); donor type (98%); pre-transplant kidney replacement therapy (94%); SES (99%); type of immunosuppression (91%).
Men; women: recent eGFR (79%; 76%); pre-emptive kidney transplantation (97%; 98%); primary cause of kidney failure (98%; 97%); use of anti-diabetic drugs (91%; 90%); use of anti-hypertensive drugs (46%; 48%); dnDSAs (present vs absent/not tested) (82%; 86%); donor type (98%; 99%); SES (99%; 100%); type of immunosuppression (92%; 90%).
Age categories 18 to <50; 50 to <65; ≥65 years: recent eGFR (85%; 79%; 74%); pre-emptive kidney transplantation (96%; 99%; 97%); primary cause of kidney failure (99%; 98%; 97%); use of anti-diabetic drugs (92%; 89%; 91%); use of anti-hypertensive drugs (64%; 46%; 43%); dnDSAs (present vs absent/not tested) (88%; 89%; 77%); donor type (99%; 99%; 97%); SES (98%; 99%; 100%); type of immunosuppression (95%; 92%; 89%).
Compared with non-responders, responders were older, had more often an eGFR above 30 mL/min/1.73 m2, underwent more often pre-emptive transplantation, had more frequently a living donor, and had higher SES. KTRs with diabetes mellitus as primary cause of kidney failure had the lowest response rate (24%) (Supplementary data, Table S1).
Symptom experience
The median (IQR) experienced amount of symptoms was 14 (7–22) out of 61, and the median total symptom burden was 20 (8–37) out of 244. The most frequently reported symptoms were bruises (62%), feeling tired and lack of energy (62% and 53%), increased urge to urinate at night (48%), dry skin (46%), bone/joint pain (42%), muscle cramps and weakness (40% and 39%), trouble staying asleep and erectile problems (40% and 39%). Sexual problems [mean (SD)] were most burdensome if experienced: decreased interest in sex 2.21 (1.31), difficulty becoming sexually aroused 2.23 (1.28) and erectile problems 2.36 (1.27) (Fig. 2A and B).
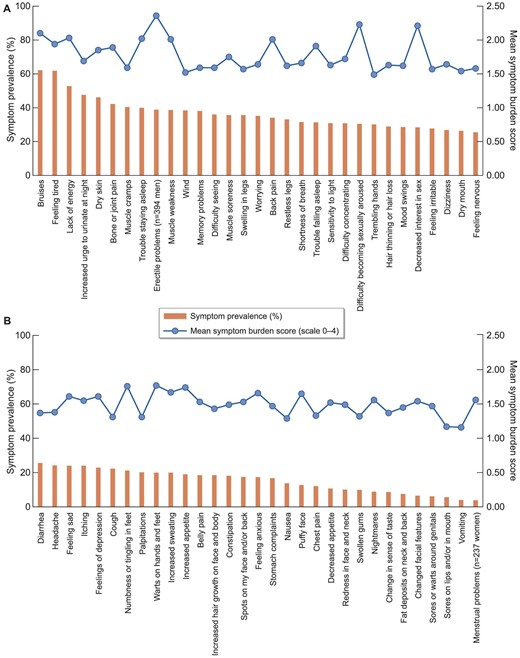
(A, B) Symptom prevalence and mean symptom burden in KTRs. The bar shows the proportion of kidney transplant recipients who experienced the symptom (%, left axes). The line shows the mean symptom burden score given to the symptom by kidney transplant recipients who experienced the symptom (scale 0 “I experience no burden from the symptom at all” to 4 “I experience very much burden,” right axes).
Relationship between symptom experience (prevalence and burden) and HRQOL
Mean (SD) physical and mental HRQOL were 43.7 (11.0) and 47.8 (9.9), respectively (Table 1, Fig. 3; Supplementary data, Fig. S1 shows the HRQOL outcomes of KTRs compared with outcomes of the Dutch general population). The effect of one extra symptom on physical and mental HRQOL was –0.41 (–0.50; –0.31) and –0.51 (–0.59; –0.42), and one extra symptom burden point –0.25 (–0.30; –0.20) and –0.26 (–0.30; –0.21), respectively (all P < .001), in multivariate analysis (Supplementary data, Table S2).
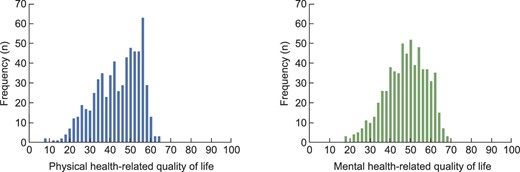
Physical and mental HRQOL outcomes of KTRs.
Gender and age differences in symptom experience (stratified for time post-transplantation)
Women experienced more symptoms [+4.1 (2.4; 5.7), P < .001] and symptom burden [+8.0 (4.9; 11.1), P < .001] than men. The amount of symptoms or symptom burden did not differ between KTRs of different age categories (Table 2).
Gender and age differences in total symptom prevalence and burden, and physical and mental HRQOL (n = 631).
| Symptom prevalence β (95% CI) | P-value | Symptom burden β (95% CI) | P-value | Physical HRQOL β (95% CI) | P-value | Mental HRQOL β (95% CI) | P-value | |
|---|---|---|---|---|---|---|---|---|
| Gender | ||||||||
| Women | 4.1 (2.4; 5.7) | <.001 | 8.0 (4.9; 11.1) | <.001 | –3.5 (–5.2; –1.7) | <.001 | –1.6 (–3.2; 0.0) | .055 |
| Age | ||||||||
| ≥50 to <65 yearsa (c) | 1.3 (–1.0; 3.7) | .270 | 2.4 (–2.1; 7.0) | 0.294 | –5.5 (–7.9; –3.0) | <.001 | 1.1 (–1.2; 3.4) | .347 |
| ≥65 yearsa (d) | 0.2 (–2.2; 2.5) | .892 | 2.2 (–2.3; 6.7) | 0.336 | –8.3 (–10.8; –5.9) | <.001 | 3.1 (0.9; 5.4) | .007 |
| (d) vs (c) | –1.2 (–2.9; 0.6) | .193 | –0.2 (–3.6; 3.1) | 0.901 | –2.9 (–4.7; –1.1) | .002 | 2.0 (0.4; 3.7) | .018 |
| .750b | 0.451b | .007b | .074b | |||||
Age is the age at times of the survey, compared with KTRs aged 18 to <50 years;
Overall P-value for the three age-categories.
The number of symptoms and symptom burden score was not significantly different between KTRs with different timeframes post-transplantation (1–5, 5–15, ≥15years), adjusted for age (Supplementary data, Table S3). Female KTRs 1–5 years post-transplantation experienced more often hair thinning/loss, bruises and dry mouth compared with men. At 5–15 years post-transplantation, women reported more often physical symptoms, sleep-related symptoms and symptoms related to physical appearance. We did not objectify significant differences between genders in KTRs transplanted ≥15 years ago (Table 3).
Gender differences in symptom prevalence in KTRs (A) 1–5 years post-transplantation (n = 158), (B) 5–15 years post-transplantation (n = 312) and (C) 15 or more years post-transplantation (n = 161).
| (A) | |||
|---|---|---|---|
| Men (n = 105) | Women (n = 53) | P-valuea | |
| Hair thinning or hair loss | 18 (17) | 27 (51) | <.001 |
| Bruises | 51 (49) | 40 (75) | .002 |
| Dry mouth | 17 (16) | 21 (40) | .002 |
| Increased sweating | 15 (14) | 19 (36) | .002 |
| (B) | |||
| Men (n = 188) | Women (n = 124) | P-valuea | |
| Bruises | 93 (49) | 95 (77) | <.001 |
| Hair thinning or hair loss | 40 (21) | 54 (44) | <.001 |
| Bone or joint pain | 64 (34) | 70 (56) | <.001 |
| Back pain | 46 (24) | 57 (46) | <.001 |
| Belly pain | 22 (12) | 38 (31) | <.001 |
| Increased sweating | 21 (11) | 34 (27) | <.001 |
| Muscle soreness | 52 (28) | 58 (47) | .001 |
| Trouble falling asleep | 48 (26) | 55 (44) | .001 |
| Headache | 34 (18) | 43 (35) | .001 |
| Puffy face | 11 (6) | 21 (17) | .002 |
| Lack of energy | 90 (48) | 82 (66) | .002 |
| Trouble staying asleep | 65 (35) | 63 (51) | .005 |
| Decreased appetite | 12 (6) | 20 (16) | .007 |
| Fat deposits on neck and back | 3 (2) | 11 (9) | .007 |
| Sensitivity to light | 50 (27) | 50 (40) | .011 |
| Worrying | 57 (30) | 55 (44) | .012 |
| Increased hair growth on face/body | 26 (14) | 31 (25) | .014 |
| Feeling nervous | 37 (20) | 39 (32) | .019 |
| Muscle cramps | 64 (34) | 58 (47) | .025 |
| Decreased interest in sex | 46 (25) | 45 (36) | .025 |
| Dry skin | 76 (40) | 66 (53) | .027 |
| Feeling tired | 112 (60) | 89 (72) | .028 |
| Feeling irritable | 46 (25) | 44 (36) | .036 |
| (C)b | |||
| Men (n = 101) | Women (n = 60) | P-valuea | |
Data are presented as n (%).
Corrected for multiple testing using Benjamini and Hochberg's procedure. Significant differences after correction for multiple testing are shown. Symptoms are ordered from smallest to largest P-value.
No differences in symptom prevalence were observed.
At 1–5 years post-transplantation, older KTRs experienced more often bone/joint pain (18–50 < 50–65 < ≥65 years). Headaches and spots occurred more in younger KTRs. At 5–15 years post-transplantation, older KTRs experienced more often bruises, erectile problems, dry mouth, muscle sourness and difficulty seeing. Feelings of depression (although not significant after correction for multiple testing) were more prevalent in younger KTRs. In KTRs transplanted ≥15 years ago, no significant differences in symptom prevalence were objectified between KTRs of different age categories (Table 4).
Differences in symptom prevalence between age-categories in KTRs (A) 1–5 years post-transplantation (n = 158), (B) 5–15 years post-transplantation (n = 312) and (C) 15 or more years post-transplantation (n = 161).
| (A) | ||||
|---|---|---|---|---|
| Age ≥18 to <50 years (n = 36) | Age ≥50 to <65 years (n = 70) | Age ≥65 years (n = 52) | P-valuea | |
| Bone or joint pain | 6 (17) | 23 (33) | 27 (52) | .001 |
| Headache | 14 (39) | 25 (36) | 4 (8) | .001 |
| Spots on my face and/or back | 13 (36) | 15 (21) | 5 (10) | .004 |
| (B) | ||||
| Age ≥18 to <50 years (n = 51) | Age ≥50 to <65 years (n = 120) | Age ≥65 years (n = 141) | P-valuea | |
| Symptoms that are less prevalent in KTRs in older age categories | ||||
| Decreased appetite | 9 (18) | 16 (13) | 7 (5) | .005 |
| Difficulty concentrating | 15 (29) | 49 (41) | 24 (17) | .005 |
| Nausea | 14 (28) | 19 (16) | 16 (11) | .011 |
| Increased hair growth on face and body | 7 (19) | 9 (13) | 3 (6) | .014 |
| Stomach complaints | 15 (29) | 23 (19) | 19 (14) | .014 |
| Feelings of depression | 18 (35) | 27 (23) | 26 (18) | .022b |
| Symptoms that are more prevalent in KTRs in older age categories | ||||
| Bruises | 20 (39) | 67 (56) | 101 (72) | .000 |
| Erectile problems (only men) | 9 (26) | 24 (32) | 43 (55) | .005 |
| Muscle soreness | 11 (22) | 39 (33) | 60 (43) | .005 |
| Dry mouth | 7 (14) | 26 (22) | 45 (32) | .006 |
| Difficulty seeing | 11 (22) | 40 (33) | 59 (42) | .009 |
| (C)c | ||||
| Age ≥18 to <50 years (n = 14) | Age ≥50 to <65 years (n = 74) | Age ≥65 years (n = 73) | P-valuea | |
Data are presented as n (%).
Corrected for multiple testing using Benjamini and Hochberg's procedure. Significant differences after correction for multiple testing are shown. Symptoms are ordered from smallest to largest P-value.
First value that is not significant after correction for multiple testing.
No differences in symptom prevalence were observed.
The ratings of symptom burden (0–4) per individual symptom that KTRs gave to their experienced symptoms did not significantly (after correction for multiple testing) differ between genders or age categories (not shown).
DISCUSSION
This study showed an overview of KTRs’ symptom experience. Higher amount of symptoms and increased symptom burden were negatively associated with mental and physical HRQOL, which is in line with previous findings in KTRs and patients on dialysis [13, 14, 27]. Experienced symptoms differed between patient groups. With the knowledge that we gain with our study concerning symptom experience in KTRs, we take the first steps towards identification of subgroups of KTRs that would benefit most from additional support strategies aimed at improving symptom experience and consequently HRQOL. To the best of our knowledge, this is the first large study that provides a detailed overview of experienced symptoms and symptom burden in a large population of KTRs, captured using (e)PROMs. It adds to results from a relatively smaller study (n = 110) that studied 26 symptoms [15], in particular by our elaborate exploration of gender and age differences.
The lower HRQOL found in female versus male KTRs is consistent with previous research in the general population [28] and in KTRs [13]. Additionally, women experienced higher symptom burden, which has been described before in KTRs [29], in other solid transplant recipients [30] and by other large-scale population-based studies amongst others in patients with malignancies [31, 32]. No clear explanation for increased symptom experience in women KTRs has been described yet. Neurobiological mechanisms might be involved [33].
The prevalence of feelings of depression was increased in younger KTRs. This might be explained by the fact that younger KTRs face more years of symptom burden, and might experience problems at work or concerns about fertility. These suggestions have been previously described in research in young women with breast cancer [34]. Additionally, symptom prevalence concerning changes in physical appearance was larger in younger KTRs (spots, hair growth on face/body, swollen gums) which might negatively influence psychological status. Another explanation could be that older patients are more likely to approach their illness in a “matter-of-fact” manner associated with the expected ageing process [35]. These findings emphasize the importance of adequate and timely psychological support and the likely important value of peer-support groups in young KTRs [36].
We found that sexual symptoms were the most burdensome. Prevalence of sexual problems in our study was lower than previously found in KTRs [37]. An explanation could be that sexually inactive KTRs were included in our analysis in contrary to other studies, who were consequently not experiencing sexual problems. Prevalence of impaired sexual function is negatively associated with KTRs’ HRQOL [38]. On top of patients’ personal burden, these symptoms also affect KTRs’ partners [39]. Despite its relevance, this topic is often undervalued in daily clinical practice. Healthcare providers often do not inquire about sexual problems during consultation; they might underestimate the issue, might not be aware of therapeutic options or do not feel comfortable discussing it [40, 41]. The etiology of impaired sexual function is often multifactorial, especially in KTRs [40]. Until now, we are not aware of multidisciplinary treatment protocols for sexual symptoms specifically post-kidney transplantation, leading to undertreatment and adverse outcomes [41].
As far as we know, our study is the largest to date that focused on a wide range of symptoms [15]. Another strength is that our study population consists of KTRs covering an extensive time span from 1 to over 15 years post-transplantation. Furthermore, the used PROMs are validated and similar to PROMs used in routine Dutch dialysis care (SF-12 and DSI). Tailoring PROMs to their target population's needs is important and hence the MTSOSD-59R was added in order to include immunosuppressive treatment-specific side-effects.
This study also has its limitations. Due to the cross-sectional design, patients were surveyed at different times following their transplantation procedure and causal relations could not be identified. We adjusted for different timeframes post-transplantation by analyzing symptom experience separately for KTRs with different time spans post-transplantation (1–5, 5–15, ≥15 years). Survivor bias might have played a role in KTRs who were transplanted ≥15 years ago. The number of symptoms and symptom burden was not significantly higher in this group of KTRs compared with more recently transplanted patients. Furthermore, 42% of the invited patients participated in the study and hence, this might have led to selection bias.
Responders had amongst others higher SES and had more often a kidney function above 30 mL/min/1.73 m2 (Supplementary data, Table S1). This could have biased towards more favorable PROs since higher monthly income and lower creatinine levels are positively correlated with mental and physical HRQOL [14]. Moreover, KTRs with diabetes mellitus as primary cause of kidney failure responded less, which might indicate lower representation of KTRs with non-European backgrounds since diabetes tends to occur more in non-western immigrants [42]. Potential explanation could be that non-Dutch-speaking patients were not able to fill out the Dutch PROMs In order to make PROMs accessible for non-Dutch-speaking KTRs and to improve the generalizability of results, future studies should use PROMs in multiple languages. KTRs with diabetes might also be less able to read the questionnaires due to visual symptoms caused by diabetes. Although the percentage of KTRs in our center is below the 30%–50% cause of end-stage renal disease which diabetes globally accounts for, the percentage of KTRs with diabetes as primary cause of renal failure in our center (10% of all KTRs) is close to the total percentage in the Netherlands (about 13% in 2020) [43, 44]. The higher number of people being treated with anti-diabetic drugs at the time of the study can be explained by the development of diabetes from treatment with immunosuppressive drugs post-transplantation.
Additionally, these PROMs were filled out during the COVID-19 pandemic, which might have influenced how KTRs perceived their mental health. Nevertheless, recent literature has shown that KTRs’ mental health does not seem to have suffered particular negative consequences due to the COVID-19 pandemic and isolation [45]. Lastly, treatment regimens were different between different age categories; KTRs ≥65 years were more often on dual instead of triple therapy and younger KTRs were treated more with an mTOR inhibitor; this might have influenced outcomes between age categories since different treatment regimens might lead to different side effects, which could also influence mental or physical HRQOL. Although KTRs are treated more often with tacrolimus instead of cyclosporin nowadays, there was no difference between the age categories.
Since the use of PROMs is new in our center in post-transplantation care, KTRs as well as healthcare providers will have to get used to working with PROMs. We are delighted by the 47% response rate of the first sent ePROMs (437 out of 1142). This is a higher rate compared with the first ePROMs that were sent to Dutch dialysis patients [11]. Since not all KTRs had access to the internet, or were able to work with an electronic device or had an e-mail address available, we sent 351 KTRs paper PROMs. We know from previous research that the willingness to fill out PROMs could decline over time [46]. Future endeavors by amongst others healthcare providers through discussing the PROs during consultations or by facilitating tablets for completion of the PROMs are necessary to successfully integrate the use of ePROMs in routine post-transplantation care and to enroll KTRs that are less agile with electronic devices [3, 47].
The clinical use of PROMs in KTRs is relatively new and subsequently the future perspectives are wide-ranging. On an individual patient level, implementation of PROMs could aid in revealing under-addressed symptoms and in tailoring care; sexual or depressive symptoms are often under-identified and underestimated, and consequently undertreated in KTRs [41, 48]. On a population level, outcomes of this overview could provide a basis for initiation of designing novel treatment protocols [3]. Future research could also focus on comparison of PROs in KTRs with waitlisted patients on dialysis. The outcomes of this study, except for the findings of the added questionnaire regarding immunosuppressive treatment-related side-effects (MTSOSD-59R), could be compared with findings in Dutch dialysis patients since the questionnaires used are complementary. This could facilitate the shared decision-making process between the two treatment options by improved patient counselling on the merits and expectancies of kidney replacement therapy (dialysis/transplantation). Recent qualitative analysis showed that KTRs’ expectations influence their satisfaction with their transplantation [49]. Recently, a large cohort study showed a strong association between functional status and HRQOL in dialysis patients [50]. Future studies might explore this association in KTRs as well, which might add valuable information to the decision-making process.
CONCLUSION
We found that KRTs’ number of experienced symptoms and symptom burden is high and significantly associated with HRQOL. Symptom experience differed depending on gender and age. Women experienced more symptoms and symptom burden compared with men. Younger KTRs experienced more often feelings of depression (18–50 > 50–65 ≥65years). Female and younger KTRs reported more often symptoms concerning changes in physical appearance. Sexual symptoms were considered the most burdensome. Insight into KTRs’ symptom experience, captured by (e)PROMs, is necessary to successfully develop and implement tailored interventions aimed at reducing symptom experience and subsequently improving HRQOL in KTRs.
ACKNOWLEDGEMENTS
We would like to thank data manager Danny van der Helm for extracting data concerning patient characteristics from the electronic patient dossier.
FUNDING
Y.M. is supported by a grant from the Dutch Kidney Foundation (21OM + 002).
AUTHORS’ CONTRIBUTIONS
D.M.J.V.: concept/design, data collection, analysis, interpretation and drafting article; Y.W.: interpretation, and critical review of the article; Y.M.: analysis, interpretation, critical review of the article and supervision; F.W.D.: critical review of the article; W.M.M.: analysis, interpretation and critical review of the article; P.J.M.B.: concept/design, data collection, analysis, interpretation, critical review of the article and supervision; and A.P.J.V.: concept/design, data collection, analysis, interpretation, critical review of the article and supervision;
DATA AVAILABILITY STATEMENT
The data used for this analysis are available upon request. E-mail: [email protected]
CONFLICT OF INTEREST STATEMENT
The authors have declared no conflicts of interest. The results presented in this article have not been published previously in whole or part, except in abstract format.
ETHICS STATEMENT
The studies involving human participants were reviewed and approved by the institutional review board of Leiden University Medical Center for non-WMO research. The patients/participants provided their written informed consent to participate in this study.


Comments