


ABSTRACT
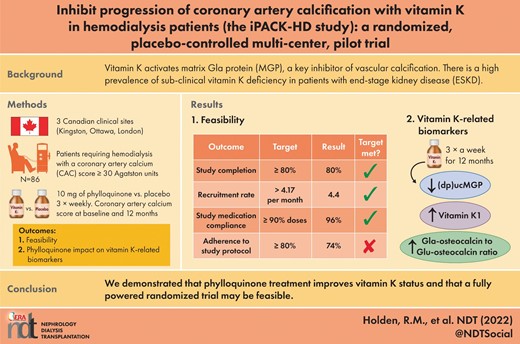
Vitamin K activates matrix Gla protein (MGP), a key inhibitor of vascular calcification. There is a high prevalence of sub-clinical vitamin K deficiency in patients with end-stage kidney disease.
A parallel randomized placebo-controlled pilot trial was designed to determine whether 10 mg of phylloquinone thrice weekly versus placebo modifies coronary artery calcification progression over 12 months in patients requiring hemodialysis with a coronary artery calcium score (CAC) ≥30 Agatston Units (ClinicalTrials.gov identifier NCT01528800). The primary outcome was feasibility (recruitment rate, compliance with study medication, study completion and adherence overall to study protocol). CAC score was used to assess calcification at baseline and 12 months. Secondary objectives were to explore the impact of phylloquinone on vitamin K-related biomarkers (phylloquinone, dephospho-uncarboxylated MGP and the Gla-osteocalcin to Glu-osteocalcin ratio) and events of clinical interest.
A total of 86 patients with a CAC score ≥30 Agatston Units were randomized to either 10 mg of phylloquinone or a matching placebo three times per week. In all, 69 participants (80%) completed the trial. Recruitment rate (4.4 participants/month) and medication compliance (96%) met pre-defined feasibility criteria of ≥4.17 and ≥90%, respectively. Patients randomized to phylloquinone for 12 months had significantly reduced levels of dephospho-uncarboxylated MGP (86% reduction) and increased levels of phylloquinone and Gla-osteocalcin to Glu-osteocalcin ratio compared with placebo. There was no difference in the absolute or relative progression of coronary artery calcification between groups.
We demonstrated that phylloquinone treatment improves vitamin K status and that a fully powered randomized trial may be feasible.
What is already known about this subject?
Vitamin K is critical to the function of matrix Gla protein, an important inhibitor of calcification.
There is a high prevalence of sub-clinical vitamin K deficiency in patients with end-stage kidney disease (ESKD).
Vitamin K supplementation improves vitamin K status in patients with ESKD.
What this study adds?
This is the largest randomized, placebo-controlled trial of vitamin K supplementation in patients with ESKD.
There is biological plausibility for a protective role of vitamin K in preventing cardiovascular disease, however, this study was not powered to determine whether vitamin K modifies the progression of calcification.
A fully powered randomized controlled trial designed to evaluate whether vitamin K supplementation attenuates the progress of coronary artery calcification is feasible.
What impact this may have on practice or policy?
There is insufficient evidence at present to support routine vitamin K supplementation in patients with ESKD.
If a trial supports the hypothesis that vitamin K prevents calcification progression then a simple nutrient strategy could reduce morbidity and mortality in patients with ESKD.
INTRODUCTION
In patients with end-stage kidney disease (ESKD), cardiovascular disease (CVD) accounts for more than 50% of deaths and the age-adjusted mortality is at least 10 times higher than in the general population [1, 2]. This is due, in part, to the consequences of vascular calcification which are linked to disorders of divalent ion metabolism and accompanied by alterations in bone turnover and increased fracture risk.
Vitamin K is part of a group of fat-soluble vitamins which activate vitamin K-dependent proteins involved in the inhibition of vascular calcification [e.g. matrix Gla protein (MGP)] and in the maintenance of bone health (e.g. osteocalcin) [3]. These proteins are functional only when carboxylated, a step which requires vitamin K. Sub-clinical vitamin K deficiency is consistently observed in patients with chronic kidney disease (CKD) and antagonizing vitamin K with warfarin has been linked to the progression of arterial and valvular calcification as well as calcific uremic arteriopathy [4–10]. Pre-clinical and clinical studies have suggested a role for vitamin K in modifying vascular calcification in animals and humans with CKD. However, clinical trials conducted in the CKD population are small, single-center studies with relatively short follow-up, heterogeneous with regards to the type of vitamin K administered, dose received, population studied and outcomes measured, and do not uniformly support the benefit of vitamin K treatment [11–14]. Further, a causal pathway linking the benefit to an improvement in the carboxylation status of MGP has not been demonstrated [10].
In 2009, Kidney Disease: Improving Global Outcomes (KDIGO) specifically recommended that ‘to determine the efficacy of calcification inhibitors in the prevention or delay of arterial calcification, a prospective, randomized, placebo-controlled trial evaluating the administration of vitamin K in CKD stages 4–5D should be conducted’ [15]. Given the cost and patient burden associated with a large trial, we have conducted a randomized, double-blind, placebo-controlled multi-center pilot to determine the feasibility of conducting a phase II trial determining the efficacy of vitamin K in the prevention or delay or arterial calcification [16]. The over-arching hypothesis is that a causal pathway exists between vitamin K and reduced CVD that operates through enhanced MGP carboxylation and is responsive to vitamin K treatment. Thus, the primary objective of the inhibit progression of coronary artery calcification with vitamin K in hemodialysis patients (iPACK-HD) was to determine the feasibility of conducting a trial designed to determine whether vitamin K supplementation with phylloquinone, compared with placebo, reduces the 1-year progression of coronary artery calcification in patients with ESKD [16]. The secondary objectives are to explore the impact of phylloquinone on (i) vitamin K-related biomarkers and (ii) coronary artery calcium (CAC) progression, to aid in the determination of sample size estimates for a fully powered phase II trial.
MATERIALS AND METHODS
This was an investigator-initiated, multi-center, parallel, randomized, placebo-controlled, pilot clinical study (ClinicalTrials.gov identifier NCT01528800). This trial began as a single-center pilot study in 2012 in Kingston, Ontario, Canada and expanded to two additional clinical sites in Ontario, Canada in 2016 (Ottawa) and 2017 (London) as funding permitted. The study design is illustrated in Fig.1. Based on the experience with the single-center pilot study (n = 33), changes were made to the protocol for the multi-center pilot phase and these changes are detailed in Supplementary data, Table S1.
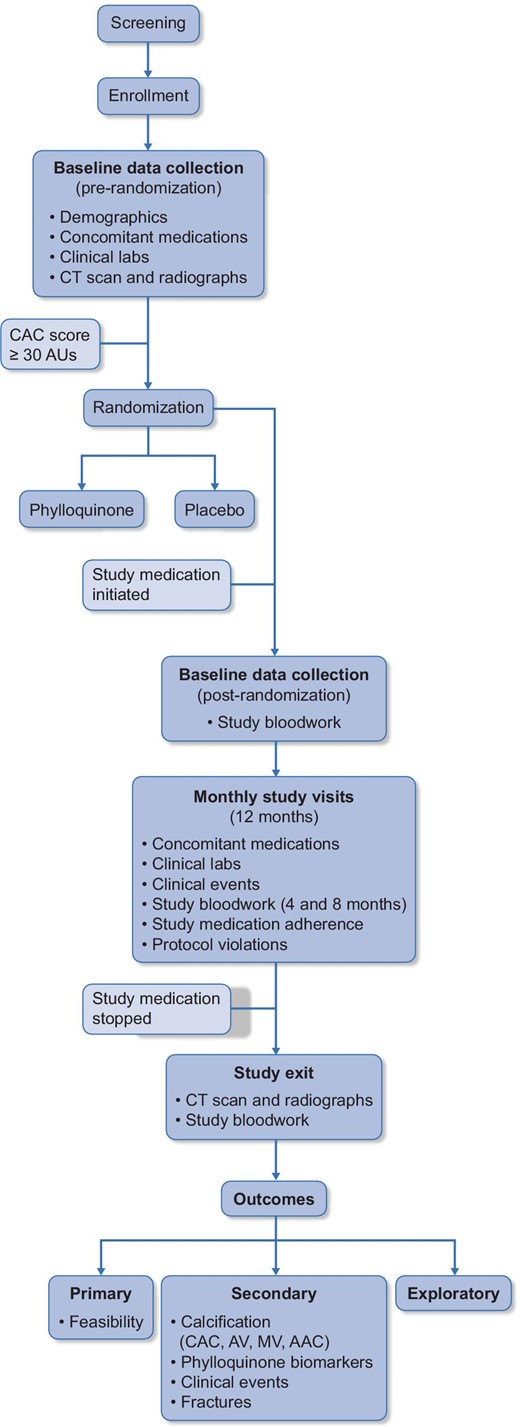
Study design of the iPACK-HD trial. AV, aortic valve; MV, mitral valve; AAC, abdominal aortic calcification.
The research ethics board at each participating site approved the trial, which adhered to the Declaration of Helsinki. Written informed consent was obtained from all participants.
Trial participants
Adult patients on hemodialysis (≥18 years of age) were screened for eligibility. Patients were eligible if they had irreversible ESKD and required hemodialysis. We excluded patients with medical conditions that required warfarin treatment, potentially reversible kidney injury, previous coronary artery bypass grafting or coronary stents, pregnant, severe comorbid conditions (e.g. malignancy, disabling stroke), life expectancy <1 year, or currently enrolled in another interventional trial. After obtaining informed consent, a computed tomography (CT) scan of the heart was performed to assess the baseline level of coronary artery calcification. If the coronary artery calcium (CAC) score was score ≥30 Agatston Units (AUs), the participant was randomized. A secure centralized web-based randomization system at the Clinical Evaluation Research Unit (CERU) at Kingston Health Sciences Center was used to allocate patients to study groups. Randomization was 1:1 and stratified by study center and diabetes mellitus using permuted blocks of random size. The randomization list was computer-generated by a study statistician who was uninvolved with study enrollment and unaware of which patients were assigned to which treatment until the study was unblinded and after the finalized statistical analysis plan was posted at ClinicalTrials.gov.
Trial interventions
Patients with a total CAC score of ≥30 AUs were randomized to receive either two 5 mg phylloquinone capsules or two matching placebo capsules post-hemodialysis three times per week for 12 months, administered by their treating nurse. The phylloquinone and placebo were manufactured in the United States by Biotech Pharmacal, Inc. (Fayetteville, AR, USA). The placebo capsule contained microcrystalline cellulose and was identical in appearance to the phylloquinone. All research and clinical personnel, with the exception of the local site pharmacists, were blinded to treatment allocations.
All study participants received a conventional hemodialysis prescription (3–4 h thrice weekly, high flux dialysis membrane). Study sites were instructed to control parameters of the chronic kidney disease-mineral bone disease (CKD-MBD) according to local practice informed by guidelines [17, 18]. Hypertension and dyslipidemia were managed according to the participants’ treating physicians. Patients could receive a general or dialysis-specific multivitamin (B and C vitamins) according to their wishes or the nephrologist's prescription. In the multi-center phase, participants who were transferred to peritoneal dialysis continued in the study with self-administration of the study drug at home and in those exiting the trial before 12 months, an exit CT scan for CAC was requested at the time of withdrawal.
Data collection
The following baseline demographic data were collected: age, sex, ethnicity, the primary cause of CKD, dialysis vintage, weight, height, waist circumference (WC), comorbidities, Charlson comorbidity index (CCI), smoking history, history of parathyroidectomy, hemodialysis access (site, type, installation date), hemodialysis start date and medication use (calcium-based phosphate binders, non-calcium based phosphate binders, calcitriol, vitamin D, calcium-sensing receptor antagonists, HMG-CoA-reductase inhibitors). Laboratory results were obtained from routine dialysis care at baseline and then as per standard of care at each dialysis unit. These included hemoglobin, albumin, creatinine, Kt/V, total cholesterol (TC), low-density lipoprotein-C (LDL), high-density lipoprotein-C (HDL), triglycerides, phosphate, calcium, parathyroid hormone (PTH) and alkaline phosphatase (ALP). Participants were reviewed monthly by the Research Coordinator and the following data were collected: medication changes, study medication compliance (i.e. missed doses), hospitalizations and reason for hospitalization, cardiovascular events, hemodialysis access complications, serious adverse events and protocol violations.
Biomarker assessment
Biomarkers of vitamin K and vitamin D and fibroblast growth factor-23 (FGF-23) were measured at baseline, 4 months, 8 months and 12 months/study exit. Serum phylloquinone was measured using high performance liquid chromatography in the Vitamin K Laboratory at Tufts University (intra- and inter-assay CV were 4.2% and 4.9%, respectively). The lower limit of quantification for phylloquinone was 0.1 pmol/L. All samples for phylloquinone were above the limit of quantification (LOQ). Plasma dephospho-uncarboxylated MGP [(dp)ucMGP] was measured using a commercially available automated sandwich ELISA, which uses two anti-MGP monoclonal antibodies directed against dephosphorylated uncarboxylated MGP (Immunodiagnostics Systems; inter- and intra-assay CV 4.0% and 4.5%). The lower limit of detection (dp)ucMGP was 300 pmol/L. A total of 15/275 samples of (dp)ucMGP were below the LOQ. Gla-type Osteocalcin (GlaOC) and Glu-type Osteocalcin (GluOC) were measured in serum using commercially available ELISA kits (Takara Bio Inc, Ann Arbor, MI, USA: MK111 and MK118; all samples were run in duplicate with an intra-assay precision cut off of <15%). Intact FGF-23 was measured in plasma using a commercially available ELISA (Immunotopics, San Clemente, CA, USA: 60–6600, intra- and inter-assay CV <10%). Serum 25-hydroxyvitamin D and 1,25-dihydroxyvitamin D were measured by LC-MS/MS (Model Acquitey LC/Xevo, TQ-S system; Waters Corp.). Samples were prepared by liquid-liquid extraction, immunoextraction and derivatization with DMEQ-TAD as previously described [19, 20].
Imaging procedure
Participants underwent imaging of the chest at baseline and study exit using an MDCT scanner with a minimum of 64 detector slices. Scans covered from the aortic arch through to the base of the heart. Scans were acquired with ECG-gating and reconstructed at 50% cardiac cycle, 2.5 mm slice thickness. Technical parameters included rotation speed of 350 msec, 120 kV and 430 mA. Calcium scoring was performed on Circle cvi42 software by two experienced independent radiologists blinded to all patient data. Foci of attenuation with density ˃130 Hounsfield units were selected. Total calcium scores represent the aggregate score for all calcified lesions in the area of interest. Calcium scores were calculated according to Agatston method and by the volume method [21, 22].
Outcomes
The primary outcome of this pilot trial was feasibility. The five pre-defined feasibility outcomes were recruitment [specified as ≥4.17 patients per month (total from any site) on average over 12 months, compliance with study medication (specified as ≥90% of doses being administered), completion rate (specified as ≥80% of patients completing the trial) and adherence to the study protocol (specified as ≥80% of patients adhering overall to the study protocol (≥90% study medication compliance and study exit CT scan completed)]. Secondary outcomes included the effect of phylloquinone treatment versus placebo on vitamin K-related biomarkers (phylloquinone, dp(uc)MGP, GlaOC:GluOC). We also recorded absolute and relative progression of coronary artery calcification and events of clinical interest including all-cause mortality, all-cause hospitalization, cardiovascular events and episodes of thrombosis (pulmonary embolism, deep vein thrombosis) for the purpose of planning a future larger trial.
Statistical analysis
The sample size for this pilot trial was targeted to assess the feasibility of a fully powered definitive phase II trial and to provide precision to estimate the progression rate of CAC over 12 months. With 80 participants, the chance of meeting recruitment and adherence targets was 99.7% and 98%, respectively, if the true monthly recruitment rate followed a Poisson distribution with a mean of 6 and the true adherence rate was 95%. A sample size of 80 participants would provide at least a 94% probability of estimating any binary outcome including the pooled CAC progression rate to within ± 10%. Therefore, we believe the final pilot sample size of 86 was adequate to thoroughly pilot the trial procedures and obtain acceptable accurate estimates for the key study outcomes.
All analyses were modified intention-to-treat using all available data, except for one patient who was excluded post-randomization without study intervention. Categorical variables were described by counts and percentages and compared between groups using Fisher's exact test. Continuous variables were reported as medians and quartiles and compared between groups using the Van Elteren test stratified by site and diabetes. The Wilcoxon signed-rank test was used to test within-group change. We used non-parametric percentile-based bootstrapping to generate 95% confidence intervals (95% CI) for the differences in median changes of CAC scores between arms. All P-values are two-sided without adjustment for multiplicity. A P < .05 was considered statistically significant. The analysis was performed using SAS Version 9.4 (SAS Institute Inc., Cary, NC, USA).
RESULTS
A total of 1041 patients were screened for eligibility in this trial (Fig.2) and 498 were excluded. In all, 202 patients declined to participate and 221 eligible patients were not approached. In total, 120 patients were enrolled and 86 were randomized. Reasons for non-randomization included a CAC score <30 AUs (n = 17), the initial CT scan not performed (n = 13) and withdrawal of consent (n = 4).
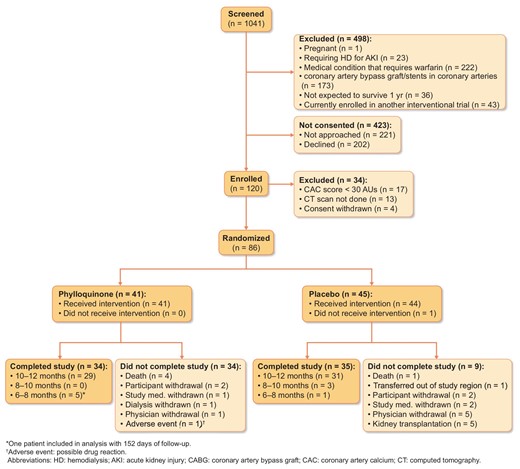
Patient flow diagram.
Primary outcome: feasibility
A total of 37% of eligible patients approached by the trial agreed to participate and 27% were randomized. The following outcomes met the target: rate of recruitment was 4.4 participants/month, medication compliance was 96% and study completion was 80%; however, only 74% adhered to the study protocol overall. Quality measures regarding adherence to study protocols and adherence to the intervention are reported in Table 1. The mean duration of intervention was 10.7 months. In all, nine patients exited the study between 6 and 10 months.
Primary outcome: feasibility
| Outcome | Pre-specified primary outcome | Target | iPACK result |
|---|---|---|---|
| Rates of eligible patients consented and randomized | Proportion of eligible patients approached who were: | No target | 37% |
| (i) Consented and | 27% | ||
| (ii) Randomized to the study | |||
| Recruitment rate in single-center trial | # patients/recruited/month | 1.2 | |
| Recruitment rate in multi-center trial | # patients recruited/montha | > 4.17 per month | 4.4 |
| Study completion | Proportion of patients with exit CAC scoreb | ≥80% | 80% |
| Compliance with study medication | Proportion of prescribed doses received | ≥90% prescribed | 96% |
| Adherence to study protocol | Proportion of participants who had exit CAC score and ≥90% adherence to study medicationc,d | ≥80% | 74% |
aExcluding first phase of incident patients only;
bearly exits included;
c1% of randomized patients who either have a known date of death during the study period OR have a non-missing CAC value measured at least 6 months after randomization;
d90% medication compliance and study completed; all pooled.
CAC, coronary artery calcification.
Participants
A total of 41 participants were randomized to phylloquinone and 45 were randomized to placebo. All participants randomized to phylloquinone received the intervention whilst one participant randomized to placebo did not (Fig.1).
The demographic characteristics of the trial population are shown in Table 2. As expected with a small sample, there were some imbalances between groups. The phylloquinone group was older with more males while the placebo group had more current smokers and a longer dialysis vintage. Most participants were taking calcium-based phosphate binders. A greater proportion of participants randomized to placebo were prescribed calcitriol (Table 3).
Patient demographics at baseline
| Phylloquinone | Placebo | |
|---|---|---|
| Characteristic | (n = 41) | (n = 44) |
| Age, years | 63 [60, 76] | 61 [48, 70] |
| Sex, % male | 27 (66%) | 21 (48%) |
| Ethnicity | ||
| White | 37 (90%) | 38 (86%) |
| Black | 3 (7%) | 2 (5%) |
| Asian | 1 (2%) | 0 |
| Indigenous | 0 | 2 (5%) |
| Other | 0 | 2 (5%) |
| Primary cause of ESKD | ||
| Diabetes type 1 | 1 (2%) | 2 (5%) |
| Diabetes type 2 | 18 (44%) | 14 (32%) |
| Hypertension | 4 (10%) | 8 (18%) |
| Glomerulonephritis | 7 (17%) | 10 (23%) |
| PCKD | 1 (2%) | 3 (7%) |
| Interstitial nephritis | 1 (2%) | 0 (0) |
| Analgesic nephropathy | 2 (5%) | 0 (0) |
| Other | 7 (17%) | 7 (16%) |
| Charlson Comorbidity Index | 3 [2, 4] | 3 [1.5, 4] |
| BMI, kg/m2 | 28.6 [25.4, 32.3] | 28.9 [24.4, 32.5] |
| Waist circumference (cm) | 109.2 [96.5, 118.0] | 102.0 [94.0, 116.0] |
| Smoking history | ||
| Never | 15 (37%) | 12 (27%) |
| Former | 19 (46%) | 20 (45%) |
| Current | 7 (5%) | 12 (27%) |
| History of parathyroidectomy | 2 (5%) | 4 (9%) |
| Dialysis vintage (days) | 278 [144, 757] | 413 [150, 1329] |
Variables are reported as median [IQR] and categorical variables are reported as count (% of total column).
PCKD, polycystic kidney disease; BMI, body mass index; ESKD, end-stage kidney disease.
Medication use at baseline and study exit
| Phylloquinone | Placebo | |||
|---|---|---|---|---|
| Baseline | Study end | Baseline | Study end | |
| n (%) | (n = 41) | (n = 39) | (n = 44) | (n = 37) |
| PO4 binder | ||||
| Calcium | 40 (98%) | 36 (92%) | 36 (82%) | 32 (86%) |
| NCPB | 1 (2%) | 6 (15%) | 5 (11%) | 8 (22%) |
| Sevelamer | 1 (2%) | 3 (8%) | 4 (9%) | 6 (16%) |
| Calcimimetic | 2 (5%) | 1 (3%) | 0 (0%) | 1 (3%) |
| Calcitriol | 15 (37%) | 14 (36%) | 26 (59%) | 21 (57%) |
| Vitamin D | 6 (15%) | 6 (15%) | 8 (18%) | 6 (16%) |
| HMG Co-A reductase | 23 (56%) | 22 (56%) | 22 (50%) | 21 (57%) |
| Average dose/day | ||||
| Calcium (mg/day) | 1500 [1000, 2279] | 1248 [600, 1889] | ||
| Calcitriol (ug/day) | 0.00 [0.00, 0.11] | 0.11 [0.00, 0.17] | ||
Data presented as count (n, % of column) and median [Q1, Q3]. No between group differences were statistically significant by Fisher's exact test (binary) or Van-Elteren (continuous) test.
NCPB, non-calcium-based phosphate binder; HMG Co-A, hydroxymethylglutaryl coenzyme A (HMG-CoA) reductase inhibitors.
The baseline and ‘on treatment’ average values for laboratory results are presented in Supplementary data, Table S2. The level of 1,25(OH)2D was lower in the phylloquinone group at baseline. Otherwise, groups were similar at baseline and in response to treatment.
Of 41 participants randomized to phylloquinone, 34 completed the study. In all, four participants died and three participants were withdrawn due to participant (n = 2) or physician withdrawal (n = 1, adverse drug reaction). The second CAC score was obtained between 6 and 10 months in five participants due to kidney transplantation (n = 2), CABG (n = 1) and withdrawal of consent (n = 1).
Of 45 participants randomized to placebo, 35 completed the study. One participant never received study intervention as he recovered kidney function shortly after randomization; one participant died, one transferred out of the region, two withdrew from the study and there were five withdrawals due to kidney transplantation. The second CAC score was obtained between 6 and 10 months in 4 participants due to transfer from the study region (n = 1), development of a condition requiring warfarin (n = 1), kidney transplantation (n = 1) and missing ˃ 2 consecutive weeks of study treatment (n = 1).

Individual patient changes in CAC scores (AUs) from baseline to study exit.
Secondary outcomes
Vitamin K biomarkers at baseline and in response to treatment
The baseline value and the ‘on treatment’ average values for biomarkers of vitamin K metabolism are presented in Table 4. As expected, there was a significant increase in phylloquinone and GlaOC:GluOC and a decrease in (dp)ucMGP (indicative of improved vitamin K status) in the phylloquinone group (P < .01 for all between-group differences in change from baseline). There were no changes in vitamin K biomarkers across the duration of the study in the placebo group.
(ii) CAC progression
Vitamin K biomarkers: baseline, on-treatment average, final and change from baseline at study exit in the phylloquinone group
| Phylloquinone | |||||
|---|---|---|---|---|---|
| Variable | Baseline | On treatment average | Study exit | Absolute change from baseline | % change from baseline |
| Phylloquinone (nmol/L) | 1.4 [0.9, 2.0] | 9.98 [6.0, 13.1] | 7.7 [3.8, 12.6] | 7.7 [3.8, 12.6] | 481.8 [227.2, 933.3] |
| cOC:ucOC | 6.0 [2.9, 12.6] | 54.0 [31.5, 81.1] | 54.4 [36.7, 76.9] | 46.3 [26.2, 61.4] | 709.5 [247.8, 1131.9] |
| (dp)ucMGP (pmol/L) | 1022.0 [819.9, 1368.0] | 479.3 [399.6, 612.6] | 481.3 [382.8, 635.6] | −548.0 [−833, −146] | −86.1 [−90.8, −69.3] |
| Placebo | |||||
| Phylloquinone (nmol/L) | 1.0 [0.5, 1.8] | 0.95 [0.5, 1.7] | 0.8 [0.5, 1.5] | 0.8 [0.5, 1.5] | 0 [−54.5, 109.1] |
| cOC:ucOC | 6.3 [3.8, 13.1] | 7.09 [4.93, 11.50] | 6.4 [3.7, 20.8] | 0.3 [−6.2, 15.2] | 4.1 [−59.8, 232.0] |
| (dp)ucMGP (pmol/L) | 1022.0 [786.6, 1369.0] | 1009.0 [888.5, 1373.0] | 1021.0 [756.2, 1423.0] | −4.3 [−273.0, 255.6] | −0.8 [−21.9, 33.1] |
Data reported as median [Q1, Q3]. All post baseline values (on treatment average, final, absolute % change from baseline) were significantly different between the phylloquinone and placebo group, with P < .01 by the Van Elteren test stratified by site and diabetes.
cOC, carboxylated osteocalcin; ucOC, uncarboxylated osteocalcin; (dp)ucMGP, dephospho-uncarboxylated matrix Gla protein.
Baseline CAC scores tended to be higher in the treatment group (Table 5). There was no difference between groups in the absolute or relative change in the CAC score at study exit. The CAC score increased significantly over baseline in both groups (Fig.3). The rate of change of CAC volume between baseline and endpoint was almost identical between the two groups (23.9 mm3/month in placebo and 23.3 mm3/month in phylloquinone). Bootstrapped 95% CI for differences in the median change in CAC score between phylloquinone and placebo were wide and did not indicate a significant difference between arms (Table 5).
(iii) Clinical outcomes
Coronary artery calcium (CAC) scores (AUs) and volume (mm3) at baseline, study exit, absolute change, relative change. Bootstrapped 95% confidence intervals for differences in median changes for CAC scores (AUs) and volumes (mm3)
| Variable | Phylloquinone | Placebo | P-value* |
|---|---|---|---|
| Baseline CAC score | |||
| N | 41 | 44 | |
| (n) AUs | (41) 754.0 [349.0, 1701.0] | (44) 442 [153.5, 1119.0] | |
| (n) Volume (mm3) | (41) 647.0 [302.0, 1415.0] | (42) 326.5 [131.0, 957.0] | |
| Study exit CAC score | |||
| N | 34 | 35 | |
| (n) AUs | (34) 811.5 [405.0, 1729.0] | (35) 681.0 [211.0, 1197.0] | 0.61 |
| (n) Volume (mm3) | (32) 669.5 [346.5, 1390.0] | (33) 581.0 [222.3, 956.0] | 0.60 |
| 12-month absolute change from baseline | |||
| (n) AUs | (34) 101.3 [28.0, 421.0]** | (35) 114.0 [6.0, 461.0]** | 0.79 |
| (n) Volume (mm3) | (32) 106.6 [32.0, 354.8]** | (31) 95.0 [2.0, 381.0]** | 0.96 |
| 12-month relative change from baseline | |||
| (n) AUs | (34) 22% [9%, 47%]** | (35) 18% [3%, 82%]** | 0.50 |
| (n) Volume (mm3) | (32) 23% [10%, 51%]** | (31) 24% [1%, 62%]** | 0.70 |
| 95% CI limits for difference between arms in CAC change variablesa | |||
| Change variable | Difference in medians | Lower 95% CI | Upper 95% CI |
| Agatston absolute change | −12.7 | −187.1 | 96.1 |
| Agatston relative change, n (%) | 4 | −29 | 19 |
| Volume absolute change | 11.5 | −199.4 | 111.8 |
| Volume relative change, n (%) | 1 | −24 | 22 |
Data reported as median [Q1, Q3]
*Comparison between groups analyzed using the Van Elteren test stratified by site and diabetes.
**All within group changes were significant at P < .001 by Wilcoxon signed rank test.
CAC, coronary artery calcium; CI, confidence interval.
aAll differences shown in terms of phylloquinone arm — placebo arm.
There were more deaths in the group assigned to phylloquinone (four and one in the phylloquinone and placebo, respectively) (Table 6). All deaths were expected and due to stroke (n = 1), infective endocarditis related to line sepsis (n = 2), pneumonia/sacral wound (n = 1) and heart failure (n = 1). No participant had a pulmonary embolism or a deep vein thrombosis and there was no difference between groups in episodes of access thrombosis. Hospitalizations and cardiovascular events were similar between groups.
Clinical outcomes; mortality, hospitalizations, cardiovascular events, thrombosis and pulmonary embolism
| Phylloquinone | Placebo | |
|---|---|---|
| Mortality | 4 (10%) | 1 (2%) |
| Any hospitalization | 15 (37%) | 18 (41%) |
| Total hospitalizations | ||
| 0 | 26 (63%) | 26 (59%) |
| 1 | 10 (24%) | 12 (27%) |
| 2 | 1 (2%) | 3 (7%) |
| 3 | 2 (2%) | 1 (2%) |
| 4 | 3 (7%) | 2 (5%) |
| Any cardiovascular event | 7 (17%) | 6 (14%) |
| Any ACS | 4 (10%) | 0 (0%) |
| Any CHF | 0 (0%) | 0 (0%) |
| Any stroke | 1 (2%) | 0 (0%) |
| Any TIA | 0 (0%) | 0 (0%) |
| Any amputation | 0 (0%) | 0 (0%) |
| Any cardiac revascularization procedure | 2 (5%) | 4 (9%) |
| Any cerebral revascularization procedure | 1 (2%) | 0 (0%) |
| Any peripheral revascularization procedure | 0 (0%) | 0 (0%) |
| Total cardiovascular events | ||
| Missing | 0 | 1 (2%) |
| 0 | 34 (83%) | 37 (84%) |
| 1 | 5 (125) | 5 (11%) |
| 2 | 0 | 1 (2%) |
| 3 | 2 (%) | 0 |
| Any access thrombosis | 2 (5%) | 2 (5%) |
| Total access thrombosis | ||
| Missing | 3 (7%) | 4 (9%) |
| 0 | 36 (88%) | 38 (86%) |
| 1 | 2 (5%) | 1 (2%) |
| 2 | 0 | 1 (2%) |
| Pulmonary embolism | 0 (0%) | 0 (0%) |
| Deep vein thrombosis | 0 (0%) | 0 (0%) |
Data reported as count (n, % of total column). ACS, acute coronary syndrome; CHF, congestive heart failure; TIA, transient ischemic attack.
Adverse events
One adverse reaction was reported in the trial and this occurred in a participant randomized to phylloquinone. The participant reported fever, chills, malaise and dizziness with a rash. A skin biopsy demonstrated small vessel vasculitis and eosinophilia suggesting drug hypersensitivity. The patient recovered after discontinuation of the treatment.
DISCUSSION
The results of this multi-center pilot study indicate that a definitive trial is feasible. With modifications informed by the single-center experience, three of four pre-defined feasibility criteria were met. We have demonstrated that phylloquinone treatment is well-tolerated by dialysis patients and that nurse administration of study medication, which conveniently aligned with participants’ dialysis schedules, translates into very high compliance. Phylloquinone increased the carboxylation status of key vitamin K-dependent proteins compared with placebo. This multi-center pilot trial was not powered to detect differences in calcification progression or clinical outcomes and no significant differences or trends were observed between treatment groups. This is the largest randomized trial examining the impact of vitamin K on a surrogate CVD outcome in a hemodialysis population.
Almost half of the screened patients met the exclusion criteria for participation, a finding in line with similar trials conducted in the dialysis population [23]. Of eligible patients who were approached, 37% consented to participate suggesting a willingness of the dialysis population to actively address this study question. We restricted randomization to participants with a baseline CAC score of ≥30 AUs and 17 enrolled participants could not be randomized on this basis. The Renagel in New Dialysis Patients (RIND) trial demonstrated that calcification did not progress over 1 year in those without significant calcification at baseline regardless of phosphate binder choice [24].
The overall study completion rate was comparable to similar studies conducted in the same population [23, 24]. The design of trials in this population must account for lower rates of study completion than might be desirable when powering studies with surrogate outcomes. Earlier time points could be considered, however the cost of the additional scan can be prohibitive and radiation exposure must be considered [24]. We determined a priori that missing >2 weeks of consecutive treatment was a reason for withdrawal from the trial. The vitamin K biomarker data suggest that saturation occurs prior to 4 months, indicating that such a restrictive approach was likely unnecessary.
No patient in this trial had a thrombotic event and access complications were similar between groups. One adverse drug reaction was reported in a patient receiving phylloquinone. Skin reactions are recognized to occur when phylloquinone is administered subcutaneously [25]. To the best of our knowledge, no similar reactions have been reported with the oral administration of phylloquinone. Three patients withdrew from the study because they did not tolerate the treatment, however, this occurred more frequently in the placebo group.
The level of (dp)ucMGP decreased by 86% in the phylloquinone group. To date, no clear threshold has been identified for (dp)ucMGP that indicates an increased risk for CVD and/or mortality in dialysis patients. However, all-cause mortality was lower in participants of the Chronic Renal Insufficiency Cohort, with a (dp)ucMGP ≤450 pmol/L [26]. Although higher (dp)ucMGP has been reported with worse calcification [27–29] and phylloquinone treatment reduces (dp)ucMGP [30], no trial to date has demonstrated that this approach is calcification protective. In this trial, the change in CAC score over 12 months was not different by group either in absolute or relative terms despite the marked and sustained decrease in (dp)ucMGP in the phylloquinone group. Although this finding is in line with the three other vitamin K trials conducted in dialysis patients [13, 31, 32], the wide CI around the difference in the median change in CAC scores between groups indicates that conclusions regarding whether vitamin K is effective cannot be made as the study is under-powered to answer this question. No trial yet has been adequately powered to test the impact of phylloquinone treatment on CVD events or mortality, thus clinical relevance remains uncertain.
CAC scores have limitations as they are only a proxy measure of CVD and cannot discriminate between calcification associated with atherosclerotic plaque versus medial vessel wall calcification, yet both forms are present in many hemodialysis patients. A second limitation is the large inter-scan variability of 8.2% when CAC scores are ≥400 AUs [33]. The severity of CAC in participants of this trial was substantial; it is conceivable that studying patients earlier in the disease course could yield different results. Indeed, in our study, the CAC scores were higher at baseline in the phylloquinone treated group which is a drawback. Despite the acknowledged limitations, a CAC score predicts major adverse cardiovascular events and is an accepted standard for comparing different therapies [34].
This trial had a number of strengths. It was conducted in three different dialysis centers and only one patient was lost to follow-up. It had excellent fidelity given the lack of indication for vitamin K prescription by other healthcare providers and the absence of over-the-counter formulations preventing cross-over and study contamination. We delivered a treatment with a very high compliance rate of 96% that resulted in a marked separation between the groups in vitamin K status assessed longitudinally by three different biomarkers. The placebo-controlled randomized study design is a significant strength over the majority of vitamin K treatment trials conducted in this population. Weaknesses include the lack of race or ethnic diversity, which could be important as differences in vitamin K status have been reported in different races and ethnic groups [35, 36]. The CAC outcome could not be assessed in 20% of the patients due to death and lost to follow-up. Although 12 months is a short observation period, calcium scores increased significantly during this time period, suggesting that this period of observation was sufficient. Two previous randomized trials conducted in prevalent dialysis patients utilizing CAC scores as the primary outcome demonstrated the treatment benefits of therapies targeting CKD-MBD over the same timeframe [23, 37].
In summary, the results suggest that a fully powered clinical trial is feasible. There remains biological plausibility for a protective role for vitamin K in preventing CVD; however, this study and others have been insufficiently powered to determine whether vitamin K modifies the progression of calcification. In addition, no trial has been powered sufficiently to determine whether there may be certain sub-groups that benefit the most, such as those with vitamin K deficiency at baseline. Until a fully powered placebo-controlled randomized trial is conducted, and the results support this hypothesis that vitamin K has a protective role in preventing CVD, there continues to remain insufficient evidence to support routine vitamin K supplementation in this population.
ACKNOWLEDGEMENTS
The authors gratefully acknowledge the contributions of Ms Frances MacLeod, Ms Sandra Belanger and Ms Lisa Bartsch. The authors gratefully acknowledge the Canadian Institute for Health Research and the Southeastern Ontario AHSC AFP Innovation Fund for providing the funding to conduct this trial.
FUNDING
Canadian Institute for Health Research, Southeastern Ontario AHSC AFP Innovation Fund and USDA Agricultural Research Service under Cooperative Agreement No. 58-8050-9-004. Any opinions, findings, conclusions or recommendations expressed in this publication are those of the authors and do not necessarily reflect the views of the USDA.
AUTHORS’ CONTRIBUTIONS
R.M.H. and D.K.H. conceived the study design and conducted the trial; S.L.B., X.F. and M.K.S. performed the vitamin K biomarker analysis; D.Z. and L.M. were site principal investigators; P.N. and A.G.D. conducted the statistical analysis; A.M. and R.N. conducted the radiological assessments; M.E.T., E.W., M.K. and M.A.A. conducted the laboratory analyses. Each author contributed to the manuscript writing.
DATA AVAILABILITY STATEMENT
The data underlying this article will be shared on reasonable request to the corresponding author.
CONFLICT OF INTEREST STATEMENT
All authors declare no competing interests.


Comments