


ABSTRACT
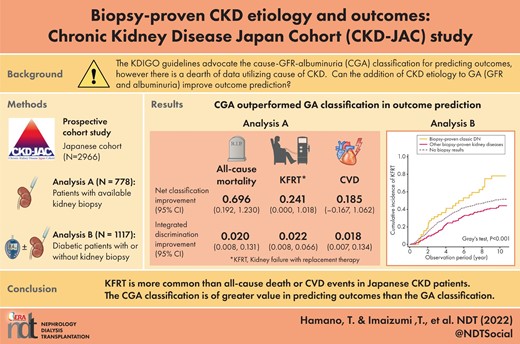
The Kidney Disease: Improving Global Outcomes guidelines advocate the cause–glomerular filtration rate (GFR)–albuminuria (CGA) classification for predicting outcomes. However, there is a dearth of data supporting the use of the cause of chronic kidney disease. This study aimed to address how to incorporate a prior biopsy-proven diagnosis in outcome prediction.
We examined the association of biopsy-proven kidney disease diagnoses with kidney failure with replacement therapy (KFRT) and all-cause death before KFRT in patients with various biopsy-proven diagnoses (n = 778, analysis A) and patients with diabetes mellitus labeled with biopsy-proven diabetic nephropathy (DN), other biopsy-proven diseases and no biopsy (n = 1117, analysis B).
In analysis A, adding biopsy-proven diagnoses to the GFR–albuminuria (GA) classification improved the prediction of 8-year incidence of KFRT and all-cause death significantly regarding integrated discrimination improvement and net reclassification index. Fine–Gray (FG) models with KFRT as a competing event showed significantly higher subdistribution hazard ratios (SHRs) for all-cause death in nephrosclerosis {4.12 [95% confidence interval (CI) 1.11–15.2)], focal segmental glomerulosclerosis [3.77 (95% CI 1.09–13.1)]} and membranous nephropathy (MN) [2.91 (95% CI 1.02–8.30)] than in immunoglobulin A nephropathy (IgAN), while the Cox model failed to show significant associations. Crescentic glomerulonephritis had the highest risk of all-cause death [SHR 5.90 (95% CI 2.05–17.0)]. MN had a significantly lower risk of KFRT than IgAN [SHR 0.45 (95% CI 0.24–0.84)]. In analysis B, other biopsy-proven diseases had a lower risk of KFRT than biopsy-proven DN in the FG model, with death as a competing event [SHR 0.62 (95% CI 0.39–0.97)].
The CGA classification is of greater value in predicting outcomes than the GA classification.
What is already known about this subject?
The Kidney Disease: Improving Global Outcomes (KDIGO) guidelines advocate the cause–glomerular filtration rate–albuminuria classification for predicting outcomes.
Instead of using the etiology of chronic kidney disease, only estimated glomerular filtration rate (eGFR) and albuminuria are usually used in risk stratification.
What this study adds?
Past kidney biopsy results contribute additional value to conventional risk stratification by eGFR and urinary albumin:creatinine ratio in predicting important outcomes for patients with CKD.
What impact this may have on practice or policy?
The results will pave the way for incorporating the ‘C’ element by medical chart review in predicting outcomes, which was advocated in the 2012 KDIGO guidelines.
INTRODUCTION
The Kidney Disease: Improving Global Outcomes (KDIGO) guidelines advocate that causes of chronic kidney disease (CKD) (C), glomerular filtration rate (GFR) category (G) and albuminuria category (A), collectively referred to as ‘CGA staging,’ can be used to inform the need for specialist referral, general medical management and indications for investigation and therapeutic interventions [1]. The cause of disease was included because of its fundamental importance in predicting the outcome of CKD and choosing cause-specific treatments. For example, diabetic kidney disease, which affects the kidneys of patients with diabetes, is the leading cause of kidney failure with replacement therapy (KFRT) in many countries [2–4], and growing evidence supports the importance of differentiating classic diabetic nephropathy (DN) from other forms of kidney disease based on histology [5–8]. However, the etiology of CKD is rarely used in risk stratification in most real-world clinical settings [9–11]. Instead, only estimated glomerular filtration rate (eGFR) and albuminuria are usually used, despite the potential importance of the cause of CKD [12–14].
Part of the reason lies in the dearth of data regarding the relationship of the cause of CKD with outcomes independent of eGFR and albuminuria [15, 16]. A few studies have investigated the relationship between biopsy-proven kidney diseases and CKD progression [17–19]. In all of these studies, day 0 in the survival analyses was set at the time point when kidney biopsy was performed or immunosuppressive agents were initiated. To the best of our knowledge, no study has investigated whether past kidney biopsy information is useful for predicting future outcomes among patients with advanced CKD.
The Chronic Kidney Disease Japan Cohort (CKD-JAC) Study has a well-characterized nationwide Japanese CKD cohort with enriched clinical information and adjudicated outcome data [20, 21]. The cohort provided us with an unprecedented chance to examine the relationship between biopsy-proven kidney disease and CKD progression, since approximately one-third of the enrolled patients had undergone kidney biopsy before baseline. This study aimed to examine whether adding past kidney biopsy information to established risk factors [11] increases risk prediction ability and, if so, to investigate how we can use biopsy information to predict future outcome events.
MATERIALS AND METHODS
Participants
The CKD-JAC Study is a multicenter, prospective observational cohort study of 2966 participants enrolled at 17 clinical facilities across Japan between April 2007 and December 2008. Details of the study are described elsewhere [21]. The protocol was approved by the ethics committee of each participating medical institution and the study was conducted under the Declaration of Helsinki. All patients provided written informed consent.
Classification and definition of kidney biopsy results
Although detailed histopathological findings or biopsy specimens were not accessible in this study, we obtained enriched clinical information, including biopsy-proven classification of kidney diseases diagnosed by physicians at each clinical site. Based on the information in case report files, we reclassified the pathological diagnoses into the following categories: immunoglobulin A nephropathy (IgAN), membranous nephropathy (MN), DN, focal segmental glomerulosclerosis (FSGS), crescentic glomerulonephritis (GN), nephrosclerosis, other and unknown. Mesangial proliferative glomerulonephritis is a histopathological diagnosis, and this histological diagnosis is common in IgAN. Therefore we categorized mesangial proliferative glomerulonephritis as ‘probable IgAN’. We studied the pathological categories in at least 40 cases. Five nephrologists independently adjudicated the pathological classification for 988 patients. In cases of disagreement, the conclusion was derived from discussion among the nephrologists.
In this study, participants were divided into two analytical groups: those with available kidney biopsy results (analysis A, n = 778) and those with a medical history of diabetes mellitus (DM; analysis B, n = 1117). For analysis A, we investigated six biopsy-proven kidney diseases that had a sufficient number of patients (>40), namely, IgAN, MN, FSGS, crescentic GN, classic DN and nephrosclerosis. For analysis B, participants were classified into three groups: those who had no documented kidney biopsy results (n = 880), those with biopsy-proven classic DN (n = 46) and those with other biopsy-proven kidney diseases (n = 191) (Fig. 1). Biopsy-proven diagnoses are shown in Fig. 2.
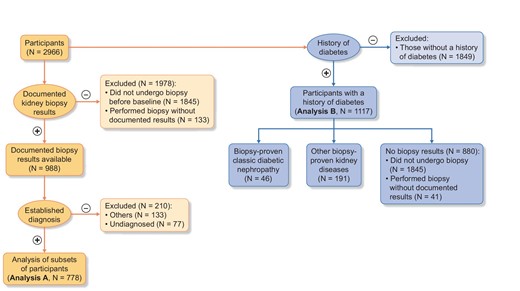
Study population. Of 2966 participants, 988 had documented biopsy results and 133 had undergone kidney biopsy before baseline but did not have documented results. Of the 988 participants, after excluding 210 participants with other kidney diseases or no diagnosis, analysis A had 778 participants. Analysis B had 1117 participants who had a medical history of DM. Analysis A was composed of six disease categories: IgAN, MN, focal segmental glomerulosclerosis FSGS, crescentic GN, classic DN and nephrosclerosis. Analysis B was composed of three groups: biopsy results not available (n = 880), DN (n = 46) and other pathological diagnoses (n = 191)
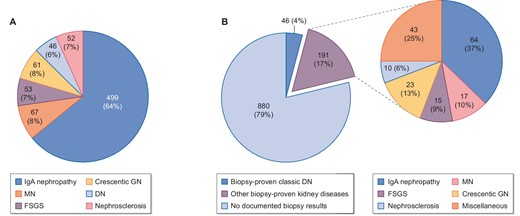
Kidney disease diagnoses based on past kidney biopsy results in (A) analysis A and (B) analysis B.
Follow-up and censoring events
The CKD-JAC Study enrolled participants from April 2007 to December 2008 and phase I ended on 31 March 2013. Phase II was the extension study of the CKD-JAC, which followed most of the participants until 30 June 2018 and recorded subsequent cardiovascular disease (CVD) events, all-cause death and KFRT. Sixteen of the 17 clinical sites participated in the phase II study. Follow-up was censored at death, KFRT, transfer to another facility, refusal to participate in the study or administrative censoring. Administrative censoring was performed on 31 March 2013 for one clinical site with 139 participants and 30 June 2018 for the rest of the clinical sites in the CKD-JAC Study. Cardiovascular events were defined as any of the following events: fatal and nonfatal myocardial infarction, angina pectoris, sudden death, congestive heart failure (CHF), arrhythmias, cerebrovascular disorder, chronic arteriosclerosis obliterans and aortic dissection. All cardiovascular events in 17 facilities in the CKD-JAC Study were evaluated by the Independent Cardiac Function Evaluation Committee [22]. However, we could not adjudicate the cause of death for participants who were transferred to another facility.
Covariates
Clinical data, including medical history and anthropometric measurements, were collected at enrollment and laboratory parameters of blood and urine samples were measured centrally using standardized assays, as reported previously [20]. Central measurement of serum creatinine was performed by the isotope dilution-mass spectrometry calibrated enzymatic method using a creatinine auto-analyzer (model 7180, Hitachi, Tokyo, Japan) at LSI Medience (Tokyo, Japan). The eGFR was calculated using the Japanese formula derived from Japanese patients with CKD: eGFR (mL/min/1.73 m2) = 194 × age−0.287 × [serum creatinine (mg/mL)]−1.094 × [0.739, if female] [23]. Urinary albumin was also measured centrally at LSI Medience using an immunoturbidimetric assay.
Biometric data, such as height, weight and blood pressure, were obtained using standardized procedures. Hypertension was defined as a systolic blood pressure ≥140 mmHg, diastolic blood pressure ≥90 mmHg or the use of any antihypertensive drugs, including diuretics. Diabetes was defined as a fasting blood glucose ≥126 mg/dL, blood glucose at any time ≥200 mg/dL or the use of antidiabetic drugs, including insulin injection. The prior history of CVD consisted of four components: coronary artery disease (CAD), CHF, peripheral artery disease (PAD) and stroke. Those with any CVD had at least one CVD subcategory.
Statistical analysis
Descriptive data are expressed as the mean [standard deviation (SD)] and median [interquartile range (IQR)] for normally and nonnormally distributed continuous variables, respectively. Between-group differences for categorical, normal and nonnormally distributed continuous variables were assessed using the chi-squared test, Student's t-test and the Wilcoxon rank sum test, respectively.
We examined the net reclassification improvement (NRI) and integrated discrimination improvement (IDI) indexes to assess whether the prognostic prediction can be improved by adding the past biopsy information to the following combinations of the established risk factors: a four-variable model including age, sex, eGFR and natural log-transformed urinary albumin:creatinine ratio (lnUACR); a six-variable model with the factors in the four-variable model plus DM and hypertension; and a seven-variable model with the factors in the four-variable model plus serum calcium, phosphate and albumin, based on the risk prediction equations previously published [11]. In our data, since bicarbonate was not available, we omitted bicarbonate from the eight-variable model and generated a seven-variable model instead. The NRI and IDI were calculated based on the 8-year cumulative incidence of KFRT or all-cause death before KFRT. In the sensitivity analysis we also calculated the NRI and IDI for CVD and a composite of CVD and all-cause death. In addition, we conducted likelihood ratio tests to evaluate the improvement of goodness-of-fit by adding biopsy information to each model.
In the survival analysis we employed cumulative incidence and Gray's test to consider the other endpoint as a competing risk event and the Fine–Gray (FG) test to consider competing–risk events. Multivariable models were adjusted for age, sex, eGFR and lnUACR (four-variable model), plus hypertension and DM (six-variable model) and variables contained in the four-variable model plus serum calcium, phosphate and albumin (seven-variable model). The proportional subhazard assumption was evaluated using scaled Schoenfeld residuals. We used multiple imputation to handle missing data. Covariates included in our imputation models were baseline age, sex, eGFR, log-transformed body mass index (BMI), systolic and diastolic blood pressure, lnUACR, hypertensive medication, history of DM and CVD, biopsy results, use of renin–angiotensin system inhibitors and the outcome variables. We conducted chained equations with 20 imputations with logistic regressions for categorical variables and linear regressions for continuous variables in each and then combined the results across the 20 imputed datasets using Rubin's formula [24]. Multivariable Cox proportional hazards models were performed as sensitivity analyses. All statistical tests were two-sided. Statistical significance was defined as P < 0.05. All analyses were performed using Stata version 17.0 software (StataCorp, College Station, TX, USA).
RESULTS
Baseline characteristics
Of the 2966 CKD-JAC Study participants, 1121 (37.8%) had undergone kidney biopsy before enrollment. Among them, 133 (11.9%) did not have their results documented in the medical charts. The baseline characteristics of those with biopsy results and those without are described in Supplementary data, Table S1. Those who did not undergo kidney biopsy were more likely to be older and to have DM, a lower eGFR and an antiplatelet prescription than those who underwent kidney biopsy.
The baseline characteristics in analysis A are presented in Table 1. Participants with IgAN were younger, less likely to be diabetic and less likely to have prior CVD than those with one of the five other biopsy-proven kidney diseases. Participants with MN were the oldest and had a high UACR. Patients with crescentic GN had the highest prevalence of stroke and respiratory diseases. No one received active immunosuppressive therapy from study enrollment through the end of follow-up. Participants with classic DN had the highest UACR and the highest prevalence of CVD history (CAD, CHF and peripheral vascular disease); they were characterized by severe anemia and low vitamin D status. Prescriptions for erythropoiesis-stimulating agents (ESAs), antiplatelets, β-blockers, renin–angiotensin system inhibitors and diuretics were most frequent in patients with classic DN.
Baseline characteristics in analysis A
| Characteristics | N | Total (N = 788) | IgAN (n = 499) | MN (n = 67) | FSGS (n = 53) | Crescentic GN (n = 61) | Classic DN (n = 46) | Nephrosclerosis (n = 52) |
|---|---|---|---|---|---|---|---|---|
| Age (years), mean (SD) | 778 | 56 (12) | 54 (12) | 66 (7) | 55 (12) | 63 (10) | 60 (12) | 56 (11) |
| Male, n (%) | 778 | 426 (54.8) | 246 (49.3) | 48 (71.6) | 34 (64.2) | 32 (52.5) | 27 (58.7) | 39 (75.0) |
| History of DM, n (%) | 778 | 175 (22.5) | 64 (12.8) | 17 (25.4) | 15 (28.3) | 23 (37.7) | 46 (100.0) | 10 (19.2) |
| eGFR, (mL/min/1.73 m2), mean (SD) | 778 | 32 (12) | 32 (13) | 32 (10) | 31 (11) | 28 (12) | 27 (12) | 32 (13) |
| CKD stage, n (%) | 778 | |||||||
| 3a | 115 (14.8) | 85 (17.0) | 9 (13.4) | 4 (7.5) | 5 (8.2) | 5 (10.9) | 7 (13.5) | |
| 3b | 307 (39.5) | 198 (39.7) | 31 (46.3) | 23 (43.4) | 19 (31.1) | 13 (28.3) | 23 (44.2) | |
| 4 | 274 (35.2) | 161 (32.3) | 23 (34.3) | 22 (41.5) | 28 (45.9) | 22 (47.8) | 18 (34.6) | |
| 5 | 82 (10.5) | 55 (11.0) | 4 (6.0) | 4 (7.5) | 9 (14.8) | 6 (13.0) | 4 (7.7) | |
| UACR, n (%) | 723 | 514 (167–1219) | 423 (164–1001) | 778 (137–3159) | 945 (551–1775) | 185 (46–349) | 1931 (727–3481) | 569 (165–986) |
| <30 | 49 (6.8) | 29 (6.3) | 7 (10.9) | 1 (2.0) | 10 (17.9) | 1 (2.3) | 1 (2.1) | |
| 30–300 | 222 (30.7) | 154 (33.5) | 12 (18.8) | 7 (13.7) | 27 (48.2) | 4 (9.1) | 18 (37.5) | |
| ≥300 | 452 (62.5) | 277 (60.2) | 45 (70.3) | 43 (84.3) | 19 (33.9) | 39 (88.6) | 29 (60.4) | |
| History of any CVD, n (%) | 778 | 110 (14.1) | 52 (10.4) | 11 (16.4) | 12 (22.6) | 14 (23.0) | 15 (32.6) | 6 (11.5) |
| History of CAD, n (%) | 778 | 60 (7.7) | 28 (5.6) | 8 (11.9) | 8 (15.1) | 6 (9.8) | 6 (13.0) | 4 (7.7) |
| History of CHF, n (%) | 778 | 13 (1.7) | 6 (1.2) | 1 (1.5) | 0 (0.0) | 1 (1.6) | 4 (8.7) | 1 (1.9) |
| History of stroke, n (%) | 778 | 36 (4.6) | 15 (3.0) | 4 (6.0) | 3 (5.7) | 8 (13.1) | 6 (13.0) | 0 (0.0) |
| History of PAD, n (%) | 778 | 16 (2.1) | 8 (1.6) | 0 (0.0) | 1 (1.9) | 1 (1.6) | 5 (10.9) | 1 (1.9) |
| History of respiratory diseases, n (%) | 778 | 85 (10.9) | 36 (7.2) | 10 (14.9) | 8 (15.1) | 16 (26.2) | 5 (10.9) | 10 (19.2) |
| Medication, n (%) | ||||||||
| Any antihypertensive agents | 778 | 727 (93.4) | 462 (92.6) | 63 (94.0) | 52 (98.1) | 54 (88.5) | 46 (100.0) | 50 (96.2) |
| ACEi/ARB | 778 | 684 (87.9) | 441 (88.4) | 61 (91.0) | 46 (86.8) | 47 (77.0) | 43 (93.5) | 46 (88.5) |
| Diuretics | 778 | 172 (22.1) | 75 (15.0) | 32 (47.8) | 9 (17.0) | 16 (26.2) | 31 (67.4) | 9 (17.3) |
| ESA | 778 | 77 (9.9) | 35 (7.0) | 10 (14.9) | 3 (5.7) | 10 (16.4) | 13 (28.3) | 6 (11.5) |
| Active vitamin D | 778 | 68 (8.7) | 39 (7.8) | 8 (11.9) | 7 (13.2) | 8 (13.1) | 5 (10.9) | 1 (1.9) |
| Antiplatelet | 778 | 100 (12.9) | 46 (9.2) | 11 (16.4) | 8 (15.1) | 13 (21.3) | 14 (30.4) | 8 (15.4) |
| Laboratory data | ||||||||
| Albumin (g/dL) | 758 | 4.0 (0.4) | 4.0 (0.4) | 3.6 (0.6) | 3.9 (0.4) | 3.9 (0.3) | 3.7 (0.5) | 4.1 (0.4) |
| Hemoglobin (g/dL), mean (SD) | 763 | 12.3 (1.9) | 12.3 (1.7) | 12.0 (1.8) | 12.8 (2.0) | 11.9 (1.7) | 10.9 (1.9) | 13.3 (2.4) |
| Phosphate (mg/dL), mean (SD) | 682 | 3.5 (0.6) | 3.5 (0.6) | 3.5 (0.6) | 3.3 (0.5) | 3.4 (0.7) | 4.0 (0.6) | 3.3 (0.6) |
| Intact PTH (pg/mL), median (IQR) | 725 | 70 (50–106) | 70 (49–102) | 63 (40–87) | 80 (57–127) | 72 (59–104) | 89 (64–171) | 68 (47–99) |
| 25-hydroxy vitamin D (ng/ml), median (IQR) | 715 | 15.4 (9.6–23.0) | 16.6 (9.9–25.0) | 12.4 (7.3–17.7) | 13.9 (8.4–21.0) | 19.2 (11.6–24.9) | 10.3 | |
| (6.1–15.4) | 15.1 | |||||||
| (12.0–21.7) |
ACEi, angiotensin-converting enzyme inhibitor; ARB, angiotensin receptor blocker.
Table 2 shows the baseline characteristics in analysis B. Participants with no biopsy results available were older, more likely to have diabetic retinopathy and CVD history and had higher hemoglobin A1c (HbA1c) levels than those with a biopsy-proven diagnosis. Participants with biopsy-proven classic DN had a higher prevalence of diabetic retinopathy and were more likely to receive diuretics, ESAs, β-blockers and calcium channel blockers. They also had higher UACR, phosphate and intact parathyroid hormone (PTH) and lower 25-hydroxy vitamin D levels than those with other biopsy-proven kidney diseases.
Baseline characteristics in patients with DM (analysis B)
| Variables | N | Biopsy results (n = 880) | Biopsy results documented (n = 237) | P-valuea | Biopsy-proven classic DN (n = 46) | Other biopsy-proven kidney diseases (n = 191) | P-valueb |
|---|---|---|---|---|---|---|---|
| Age (years), mean (SD) | 1117 | 64 (9) | 61 (10) | <0.001 | 60 (12) | 61 (10) | 0.6 |
| Male, n (%) | 1117 | 623 (70.8) | 138 (58.2) | <0.001 | 27 (58.7) | 111 (58.1) | 0.9 |
| eGFR (mL/min/1.73 m2), mean (SD) | 1117 | 27 (12) | 29 (11) | 0.056 | 27 (12) | 30 (11) | 0.1 |
| UACR (mg/g), median (IQR) | 1013 | 777 (149–2099) | 710 (169–1853) | 0.90 | 1931 (727–3481) | 546 (114–1442) | <0.001 |
| <30, mean (SD) | 0.78 | 1 (2.3) | 17 (9.5) | 0.004 | |||
| 30–300, mean (SD) | 76 (9.6) | 18 (8.1) | 4 (9.1) | 50 (27.9) | |||
| ≥300, mean (SD) | 186 (23.5) | 54 (24.2) | 39 (88.6) | 112 (62.6) | |||
| BMI (kg/m2), mean (SD) | 1018 | 24.6 (3.8) | 24.2 (4.0) | 0.13 | 24.8 (3.3) | 24.0 (4.1) | 0.2 |
| Systolic blood pressure (mmHg), mean (SD) | 1104 | 136 (20) | 133 (18) | 0.022 | 138 (20) | 131 (18) | 0.03 |
| Diastolic blood pressure (mmHg), mean (SD) | 1102 | 73 (12) | 77 (11) | <0.001 | 76 (11) | 77 (11) | 0.6 |
| Diabetic retinopathy, n (%) | 1117 | 385 (43.8) | 37 (15.6) | <0.001 | 26 (56.5) | 11 (5.8) | <0.001 |
| History of any CVD, n (%) | 1117 | 342 (38.9) | 61 (25.7) | <0.001 | 15 (32.6) | 46 (24.1) | 0.2 |
| History of CAD, n (%) | 1117 | 185 (21.0) | 34 (14.3) | 0.022 | 6 (13.0) | 28 (14.7) | 0.8 |
| History of CHF, n (%) | 1117 | 69 (7.8) | 12 (5.1) | 0.14 | 4 (8.7) | 8 (4.2) | 0.2 |
| History of stroke, n (%) | 1117 | 140 (15.9) | 17 (7.2) | <0.001 | 6 (13.0) | 11 (5.8) | 0.09 |
| History of PAD, n (%) | 1117 | 65 (7.4) | 11 (4.6) | 0.14 | 5 (10.9) | 6 (3.1) | 0.03 |
| Medication, n (%) | |||||||
| Any antihypertensive drugs | 1117 | 830 (94.3) | 228 (96.2) | 0.25 | 46 (100.0) | 182 (95.3) | 0.1 |
| ACEi/ARB | 1117 | 748 (85.0) | 208 (87.8) | 0.28 | 43 (93.5) | 165 (86.4) | 0.2 |
| β-blocker | 1117 | 230 (26.1) | 46 (19.4) | 0.033 | 15 (32.6) | 31 (16.2) | 0.01 |
| Calcium channel blocker | 1117 | 596 (67.7) | 125 (52.7) | <0.001 | 34 (73.9) | 91 (47.6) | 0.001 |
| Diuretic | 1117 | 438 (49.8) | 93 (39.2) | 0.004 | 31 (67.4) | 62 (32.5) | <0.001 |
| Antiplatelet | 1117 | 322 (36.6) | 58 (24.5) | <0.001 | 14 (30.4) | 44 (23.0) | 0.3 |
| ESA | 1117 | 166 (18.9) | 30 (12.7) | 0.026 | 13 (28.3) | 17 (8.9) | <0.001 |
| Active vitamin D | 1117 | 57 (6.5) | 34 (14.3) | <0.001 | 2 (4.3) | 32 (16.8) | 0.03 |
| Laboratory data | |||||||
| Albumin (g/dL), mean (SD) | 1081 | 3.9 (0.5) | 3.8 (0.5) | 0.29 | 3.7 (0.5) | 3.9 (0.5) | 0.03 |
| Hemoglobin (g/dL), mean (SD) | 1106 | 11.7 (1.8) | 12.0 (1.9) | 0.048 | 10.9 (1.9) | 12.3 (1.8) | <0.001 |
| Phosphate (mg/dL), mean (SD) | 987 | 3.7 (0.7) | 3.5 (0.7) | 0.012 | 4.0 (0.6) | 3.4 (0.6) | <0.001 |
| Intact PTH (pg/mL), median (IQR) | 1017 | 86 (55–137) | 73 (56–116) | 0.033 | 89 (64–171) | 71 (51–108) | 0.004 |
| 25-hydroxy vitamin D (ng/mL), median (IQR) | 1006 | 13.6 (8.7–19.7) | 14.4 (9.2–21.4) | 0.29 | 10.3 (6.1–15.4) | 15.8 (9.8–22.2) | <0.001 |
| HbA1c (%), median (IQR) | 1017 | 6.6 (6.0–7.3) | 6.3 (5.7–6.8) | <0.001 | 6.5 [6.0–7.5] | 6.2 [5.6–6.7] | 0.003 |
Comparison between biopsy-proven DN and other kidney diseases.
Comparison between those with biopsy-proven diagnosis and those without.
Incidence of death, CVD event and KFRT
The median follow-up periods were 6.6 years (IQR 3.3–9.8) in analysis A and 4.2 years (IQR 2.3–8.7) in analysis B. The median follow-up periods for those who had not developed events were 9.6 years (IQR 4.0–10.2) in analysis A and 7.5 years (IQR 3.8–10.0) in analysis B.
In analysis A, the incidence rate of KFRT was higher than those of all-cause death and CVD before KFRT in all participants. This was also true regardless of the etiology of CKD. Patients with crescentic GN had the highest incidence of death (23.1/1000 person-years), followed by patients with MN (14.5/1000 person-years) (Fig. 3A). Patients with classic DN had the highest incidence of KFRT (137/1000 person-years), followed by patients with FSGS (70/1000 person-years) (Fig. 3A). KFRT was much more dominant than all-cause death or CVD before KFRT in participants with IgAN and FSGS, while the proportion of death among the three outcomes was relatively high in participants with MN and crescentic GN (Fig. 3B). CVD was more common in participants with classic DN and MN than those with IgAN (24.5, 17.8 and 4.8/1000 person-years, respectively).
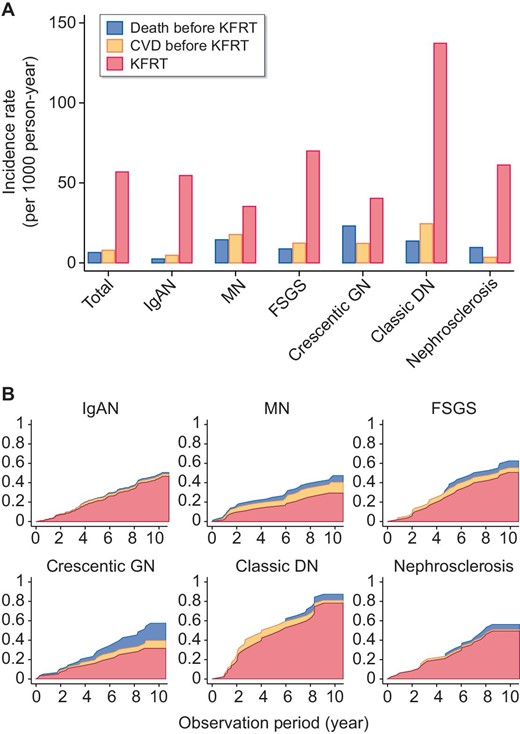
Cumulative incidence of CVD, all-cause death and KFRT. (A) The incidence rates of CVD, all-cause death and KFRT for each cause of kidney disease. (B) The cumulative incidence functions of CVD, all-cause death other than fatal CVD and KFRT in analysis A.
Even among diabetic patients, the incidence of KFRT was much higher than those of all-cause death and CVD (Fig. 4A). While participants with DN, other GN and no biopsy results were not significantly different in all-cause death, as assessed by the Kaplan–Meier curve (data not shown) or cumulative incidence functions (Fig. 4B), the incidence of KFRT was highest in the biopsy-proven DN group (Fig. 4C), whereas the incidence of CVD was highest in the no biopsy result group (Fig. 4D).
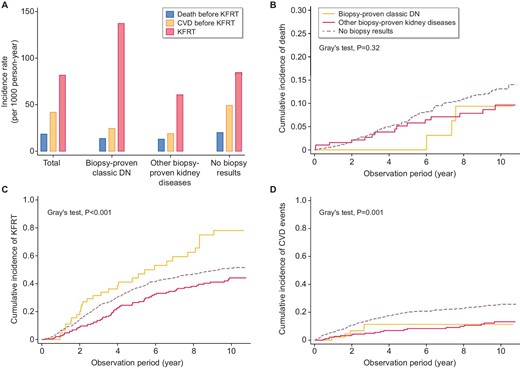
Incidence of CVD, all-cause death and KFRT. (A) The incidence rates of CVD, all-cause death and KFRT in each group. Cumulative incidence of (B) all-cause death before KFRT, (C) KFRT and (D) CVD event before KFRT.
Reclassification of prognostic prediction in analysis A
To examine whether the prediction of all-cause mortality and KFRT at 8 years would be improved, we assessed how the reclassification of risks would change with the addition of past biopsy results to the three different models (four-variable model: age, sex, eGFR and UACR; six-variable model: age, sex, eGFR, UACR, DM and hypertension; and seven-variable model: age, sex, eGFR, UACR, serum calcium, phosphate and albumin) using reclassification indices, i.e. the NRI and IDI. The four-variable model corresponds to the GA classification (heat map) by the KDIGO guidelines. We found significant improvements in both all-cause mortality and KFRT in the four, six and seven-variable models (Table 3). We also performed the analyses regarding CVD and composite of CVD and all-cause death (Supplementary data, Table S3). We found significant improvements in prediction for a composite of CVD and all-cause death, whereas no improvement of NRI was observed in CVD. The likelihood ratio test showed significant results in all-cause death and KFRT; however, no significant result was observed in CVD and composite outcome in the four-variable or six-variable model.
Improvement of reclassification indices by adding causes of kidney disease to combinations of established risk factors (analysis A)
| Reclassification indices and models | All-cause death | KFRT |
|---|---|---|
| Statistics (95% CI) | Statistics (95% CI) | |
| NRI | ||
| Four-variable model | 0.696 (0.192, 1.230) | 0.241 (0.000, 1.018) |
| Six-variable model | 0.552 (0.049, 1.231) | 0.234 (0.030, 0.838) |
| Seven-variable model | 0.627 (0.160, 1.308) | 0.292 (0.011, 0.810) |
| IDI | ||
| Four-variable model | 0.020 (0.008, 0.131) | 0.022 (0.008, 0.066) |
| Six-variable model | 0.021 (0.010, 0.147) | 0.020 (0.006, 0.057) |
| Seven-variable model | 0.011 (0.004, 0.145) | 0.020 (0.007, 0.056) |
Variables included in the four-variable model: age, sex, eGFR and lnUACR; Six-variable model: age, sex, eGFR, lnUACR, DM and hypertension; and seven-variable model: age, sex, eGFR, lnUACR, serum calcium, phosphate and albumin.
Survival analysis
In the conventional multivariable Cox model we could not find significant results except for crescentic GN in analysis A (Supplementary data, Table S2). However, multivariable FG models considering mortality as a competing event showed that MN was associated with a lower risk of developing KFRT than IgAN (reference) {subdistribution hazard ratio [SHR] 0.45 [95% confidence interval (CI) 0.24–0.84]} in the GA classification of the four-variable model (Table 4). Crescentic GN had the highest SHR for all-cause death [SHR 5.90 (95% CI 2.05–17.0)] in the four-variable model, followed by nephrosclerosis [SHR 4.12 (95% CI 1.11–15.2)], FSGS [SHR 3.77 (95% CI 1.09–13.1)] and MN [SHR 2.91 (95% CI 1.02–8.30)], compared with IgAN.
FG models for all-cause death and KFRT
| Four-variable model | Six-variable model | Seven-variable model | |||||
|---|---|---|---|---|---|---|---|
| Analysis group and outcome | Incidence rate (/1000 person-years) | SHR (95% CI) | P-value | SHR (95% CI) | P-value | SHR (95% CI) | P-value |
| Analysis A (n = 778) | |||||||
| All-cause death | |||||||
| IgAN | 2.5 | Reference | Reference | Reference | |||
| MN | 14.5 | 2.91 (1.02, 8.30) | 0.05 | 2.73 (0.96, 7.77) | 0.06 | 2.54 (0.84, 7.70) | 0.1 |
| FSGS | 8.8 | 3.77 (1.09, 13.1) | 0.04 | 3.63 (1.02, 13.0) | 0.05 | 3.58 (1.06, 12.2) | 0.04 |
| Crescentic GN | 23.1 | 5.90 (2.05, 17.0) | <0.001 | 5.69 (1.98, 16.3) | <0.001 | 6.05 (2.13, 17.2) | <0.001 |
| Classic DN | 13.7 | 2.67 (0.70, 10.2) | 0.2 | 2.45 (0.54, 11.2) | 0.3 | 2.11 (0.44, 10.2) | 0.4 |
| Nephrosclerosis | 9.7 | 4.12 (1.11, 15.2) | 0.03 | 3.98 (1.08, 14.7) | 0.04 | 3.91 (1.16, 13.2) | 0.03 |
| KFRT | |||||||
| IgAN | 54.6 | Reference | Reference | Reference | |||
| MN | 35.3 | 0.45 (0.24, 0.84) | 0.01 | 0.43 (0.23, 0.81) | 0.009 | 0.41 (0.22, 0.77) | 0.006 |
| FSGS | 70 | 0.82 (0.53, 1.26) | 0.4 | 0.8 (0.51, 1.24) | 0.3 | 0.86 (0.56, 1.35) | 0.5 |
| Crescentic GN | 40.4 | 0.82 (0.43, 1.56) | 0.5 | 0.78 (0.40, 1.51) | 0.5 | 0.79 (0.41, 1.51) | 0.5 |
| Classic DN | 137 | 1.42 (0.85, 2.38) | 0.2 | 1.29 (0.73, 2.28) | 0.4 | 1.23 (0.72, 2.11) | 0.5 |
| Nephrosclerosis | 61.2 | 0.96 (0.60, 1.53) | 0.9 | 0.95 (0.59, 1.50) | 0.8 | 0.95 (0.59, 1.52) | 0.8 |
| Analysis B (n = 1117) | |||||||
| All-cause death | |||||||
| Biopsy-proven Classic DN | 13.7 | Reference | Reference | Reference | |||
| Other biopsy-proven kidney diseases | 13 | 1.14 (0.33, 3.92) | 0.8 | 1.15 (0.34, 3.93) | 0.8 | 1.12 (0.32, 3.97) | 0.9 |
| No. of biopsy results | 20.1 | 1.32 (0.43, 4.11) | 0.6 | 1.33 (0.43, 4.14) | 0.6 | 1.36 (0.43, 4.31) | 0.6 |
| KFRT | |||||||
| Biopsy-proven Classic DN | 137 | Reference | Reference | Reference | |||
| Other biopsy-proven kidney diseases | 60.7 | 0.62 (0.39, 0.97) | 0.04 | 0.62 (0.39, 0.98) | 0.04 | 0.72 (0.45, 1.16) | 0.2 |
| No. of biopsy results | 84.4 | 0.72 (0.49, 1.05) | 0.09 | 0.72 (0.49, 1.06) | 0.09 | 0.79 (0.53, 1.17) | 0.3 |
Multivariable models were adjusted for age sex, eGFR and lnUACR (four-variable model), plus hypertension and DM (six-variable model), and the four-variable model plus serum calcium, phosphate and albumin (seven-variable model). Values in bold are statistically significant.
In analysis B, other biopsy-proven kidney diseases were associated with a lower risk of KFRT than biopsy-proven classic DN in the GA classification of the four-variable model. The SHR did not change substantially in the six-variable or seven-variable model.
DISCUSSION
Our study demonstrated that KFRT was a more common outcome than all-cause mortality and CVD events for Japanese patients with CKD, as all-cause mortality and CVD incidence were very low in this population. Moreover, we found that past kidney biopsy results (diagnoses) contribute additional value to conventional risk stratification by eGFR and UACR in predicting important outcomes for patients with CKD. This indicates that CGA classification is much better than GA classification, which is often used as a risk stratification tool in clinical practice. We found that past kidney biopsy information was especially useful in risk stratification of all-cause death, showing extremely high HRs for several kidney diseases. Notably, we did not use detailed histological information, such as interstitial fibrosis and tubular atrophy, percentage of glomerular sclerosis and infiltration of inflammatory cells. Such detailed histological information is useful for predicting the near future, although it is uncertain that it could help predict later future events since prior studies followed patients only ≤5 years after kidney biopsy [17–19, 25].
Previous epidemiological studies in Western countries have shown that mortality risk is high in patients with advanced CKD [26]. However, in our cohort, the mortality rate was extremely low despite the substantial number of enrolled patients with advanced CKD. On the other hand, the incidence of KFRT does not greatly deviate from that in previous studies conducted in other countries [27]. This means that a longer observation period is required to see whether the events of interest occur in Japanese patients with CKD. Estimation of the prognosis of patients with CKD over such a long period may be challenging with only the combination of baseline eGFR and UACR, i.e. the GA classification, because both markers change tremendously over time.
In our cohort, IgAN was the most common kidney disease, which was similar to a literature review that included Asia, Africa and Europe [28]. Patients with crescentic GN had the highest mortality. The prevalence of respiratory diseases and any CVD at baseline was higher in this population than in patients with other kidney diseases, suggesting that either the original disease or susceptible age for this disease may be associated with damage to other organs [29–31], which might have led to death before KFRT. MN was associated with a lower risk of developing KFRT, which was in line with a previous nationwide study of nephrotic syndrome in Japan [32]. In patients with MN, we found an even higher incidence of all-cause death than another nationwide nephrotic syndrome cohort study in Japan [18]. This difference may stem from differences in conditions at enrollment. In the nephrotic syndrome cohort study, participants were enrolled in the early phase of the disease, i.e. active nephrotic syndrome under immunosuppressive therapy, and some may have had a concomitant malignant disease, while in the present study, participants with MN were older and may have had a long-term adverse effect due to past immunosuppressive therapy. Unfortunately, detailed information about the cause of death other than cardiovascular death was not available in the present study. In this study, there was no significant association between biopsy-proven kidney diseases and CVD events, and the past kidney biopsy information was not useful in predicting CVD events, possibly because we could not capture fatal CVD events perfectly. Given the usefulness of biopsy-proven kidney disease in predicting all-cause death and KFRT, this does not undermine the importance of kidney biopsy information. Herein, it should be noted that the types of CVD are different between CKD patients in Japan and those in Western countries. The prevalence of stroke is higher in Japanese patients with CKD than in US patients, while CHF and CAD are more prevalent in US patients than in Japanese patients [33].
We demonstrated that past kidney biopsy information was also useful for stratifying the risk of KFRT in patients with DM. KFRT was a more common outcome than all-cause mortality in this population. Other biopsy-proven kidney diseases had a lower risk of KFRT than biopsy-proven classic DN. This may be because we can treat certain types of kidney disease with specific treatments, such as corticosteroids, tonsillectomy and immunosuppressive agents, which can delay the progression of CKD. In our results, the Kaplan–Meier curve of those who did not have biopsy information lay between the curves of those with biopsy-proven classic DN and those with other biopsy-proven kidney diseases. This means that if these patients had undergone a kidney biopsy, they might have been classified into either group. If their diagnoses had been kidney diseases other than DN, we could have treated the disease and prevented the progression of CKD in some of these patients. Hence we should consider performing a kidney biopsy when the likelihood of DN is low [34, 35].
There are some important limitations of this study. First, enriched histological information and the precise time of kidney biopsy were not available. However, our study results suggested that past biopsy results were useful for long-term risk stratification for patients with CKD. Second, DN superimposed by other biopsy-proven forms of kidney disease was classified into other biopsy-proven kidney disease categories. Despite its heterogeneity in this category, patients with other biopsy-proven kidney diseases were less likely to develop KFRT after adjustment for age, sex, eGFR and UACR. Third, data on death after the initiation of dialysis were not available in our study. However, our research interest was the prognosis of predialysis CKD patients, and information on death after dialysis initiation would not have changed our results much since dialysis patients in Japan show lower mortality than those in other countries [36, 37]. Fourth, the cause of death after transfer to another facility was unknown; therefore, CVD events could not be fully captured. Hence the analysis on CVD events was considered supplementary in this study. Further research is needed to clarify the association between past kidney biopsy results and CVD. Finally, due to the observational nature and its limited sample size, there should be residual confounders of the association between kidney disease and prognosis. In particular in the present study we used data from patients who had undergone kidney biopsy, therefore it was inevitable for us to perform analyses in a limited number of patients, which would have led to sampling bias. However, the scope of the present study was not to provide accurate and absolute risk for each disease, but to examine whether the additional information of previous kidney biopsy can improve prediction of hard outcomes by GA classification alone.
In conclusion, our study demonstrated that past kidney biopsy diagnoses can be useful to assess prognosis in patients with CKD even after adjustment for GFR and albuminuria (GA classification). The results will pave the way for incorporating the ‘C’ element by medical chart review in predicting outcomes, which was advocated in the 2012 KDIGO guidelines [1].
ACKNOWLEDGEMENTS
We thank all the investigators and participants of the CKD-JAC Study for their contributions. The details of participating facilities are described in the Supplementary data.
CONFLICT OF INTEREST STATEMENT
T.I., T.H., M.N. and Y.I. received lecture fees from Kyowa Kirin Company (KKC). T.H., M.N. and Y.I. received grants for research from KKC and T.H. participated on the advisory board and received consulting fees from KKC. All remaining authors have nothing to disclose.
AUTHORS’ CONTRIBUTIONS
T.H. and T.I. analyzed data and wrote the paper. N.F. and M.A. analyzed data. T.H., H.K., M.N., K.N., H.H., Y.I., T.W. and S.M. interpreted data. M.F. led the project and interpreted data. All authors reviewed and approved the final version of the manuscript.
FUNDING
The CKD-JAC Study was financially supported by KKC.
DATA AVAILABILITY STATEMENT
The data underlying this article cannot be shared publicly to maintain the study participants’ privacy. The data will be shared upon reasonable request to the corresponding author.
REFERENCES
Author notes
The first and second authors contributed equally to the study.


Comments