


ABSTRACT
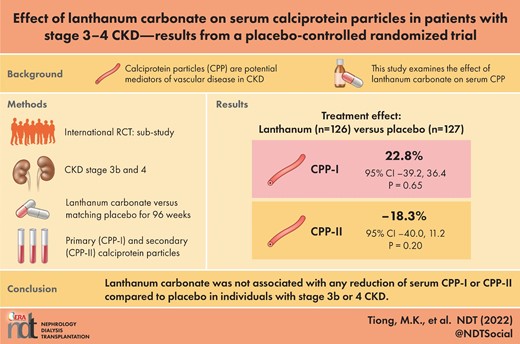
Calciprotein particles (CPP) are colloidal aggregates of calcium phosphate and the mineral-binding protein fetuin-A, and are potential mediators of cardiovascular disease in chronic kidney disease (CKD). Emerging evidence suggests non-calcium-containing phosphate binders may reduce serum CPP in patients with kidney failure who require dialysis; however, it is unclear whether similar interventions are effective in patients with earlier stages of CKD.
The IMpact of Phosphate Reduction On Vascular End-points in CKD (IMPROVE-CKD) was a multi-centre, placebo-controlled, randomized trial of lanthanum carbonate on cardiovascular markers in 278 participants with stage 3b/4 CKD. In this pre-specified exploratory analysis, primary (CPP-I) and secondary CPP (CPP-II) were measured in a sub-cohort of participants over 96 weeks. Treatment groups were compared using linear mixed-effects models and the relationship between serum CPP and pulse wave velocity (PWV) and abdominal aortic calcification (AAC) was examined.
A total of 253 participants had CPP data for baseline and at least one follow-up timepoint and were included in this analysis. The mean age was 62.4 ± 12.6 years, 32.0% were female and the mean estimated glomerular filtration rate (eGFR) was 26.6 ± 8.3 mL/min/1.73 m2. Baseline median serum CPP-I was 14.9 × 10⁴ particles/mL [interquartile range (IQR) 4.6–49.3] and median CPP-II was 3.3 × 10³ particles/mL (IQR 1.4–5.4). There was no significant difference between treatment groups at 96 weeks in CPP-I [22.8% (95% confidence interval −39.2, 36.4), P = 0.65] or CPP-II [−18.3% (95% confidence interval −40.0, 11.2), P = 0.20] compared with a placebo. Serum CPP were not correlated with baseline PWV or AAC, or with the progression of either marker.
Lanthanum carbonate was not associated with a reduction of CPP at 96 weeks when compared with a placebo in a CKD cohort.
What is already known about this subject?
Calciprotein particles (CPP) are colloidal aggregates of calcium phosphate and the mineral-binding protein fetuin-A. CPP have emerged as potential mediators of cardiovascular disease in chronic kidney disease (CKD).
Previous studies have suggested that non-calcium-containing phosphate binders may reduce serum CPP in patients with dialysis-dependent CKD. It is unclear whether similar interventions are effective in patients with earlier stages of CKD, who tend to also have less advanced cardiovascular disease and may benefit from early intervention.
What this study adds?
Use of the non-calcium-containing phosphate binder lanthanum carbonate was not associated with any change in serum CPP in patients with non-dialysis-dependent CKD.
We were unable to confirm previous associations between serum CPP and surrogate markers of cardiovascular disease in this large, multinational cohort of individuals with CKD stage 3b/4.
What impact this may have on practice or policy?
Intestinal phosphate binders may not be an effective strategy to lower serum CPP in patients with non-dialysis-dependent CKD.
INTRODUCTION
Patients with chronic kidney disease (CKD) are at increased risk of cardiovascular disease and mortality. This risk is highest in patients with kidney failure who require dialysis, however, vascular pathology often begins much earlier in the course of CKD [1]. Patients with CKD have a high burden of traditional risk factors for cardiovascular disease, however, non-traditional risk factors, such as abnormalities in mineral metabolism, may also be important. Abnormalities in mineral metabolism are intrinsic to CKD and disturbances in serum phosphate, parathyroid hormone (PTH), as well as vitamin D metabolism, are almost universally present by the time patients reach kidney failure. However, abnormalities in mineral homeostasis are detectable much earlier in CKD [2] and it is conceivable that early intervention may prevent or reduce the progressive burden of cardiovascular disease as CKD advances.
Calciprotein particles (CPP) are nanoscale mineral protein colloids that are emerging as novel markers of mineral and cardiovascular pathology in CKD [3, 4]. In biological fluids, nascent clusters of calcium and phosphate ions are bound by the liver-derived glycoprotein fetuin-A, forming calciprotein monomers (CPM). These mineral–protein clusters may then self-aggregate to form primary calciprotein particles (CPP-I) before transforming into larger and denser secondary calciprotein particles (CPP-II). In health, the formation of CPM and CPP appear to have a physiological role in facilitating the bulk transport of mineral ions without extraosseous precipitation. However, elevated levels of serum CPM and CPP may be a marker of ‘mineral stress’ in CKD and have been shown to positively correlate with a range of intermediate cardiovascular endpoints such as aortic stiffness [5] and coronary artery calcification [6, 7], as well as with patient outcomes such as cardiovascular events [8] and mortality [9]. Laboratory studies have also suggested that CPP directly mediate a range of toxic effects such as induction of vascular smooth muscle cell calcification and expression of inflammatory mediators, as well as causing vascular luminal and endothelial lesions [10–12]. Consequently, elevated levels of CPP have been suggested not only to be a correlate of vascular pathology in CKD, but may also be directly involved as a mediator of these processes [4].
Reduction of gastrointestinal phosphate load has been suggested as a potential strategy to reduce elevated levels of serum CPP in CKD. While the exact determinants of CPP in circulation are yet to be fully elucidated, animal models have shown that dietary phosphate loading leads to increased CPP in the serum of CKD model rats [13]. Additionally, in patients with kidney failure requiring dialysis, it has been shown that non-calcium-based intestinal phosphate binders are associated with lower levels of serum CPM and CPP than calcium-based binders [14, 15]. In these studies, however, it was not clear if reductions in CPM and CPP were predominantly related to a reduction in intestinal phosphate absorption per se, or the avoidance of exogenous calcium loading associated with calcium-based binders. Given that previous studies have been in patients requiring dialysis, it is also unclear whether phosphate binders can be used to lower serum CPP in patients with earlier stages of CKD, who notionally tend to also have less advanced cardiovascular disease and so may ultimately benefit more from intervention.
The IMpact of Phosphate Reduction On Vascular End-points in CKD (IMPROVE-CKD) trial [16] was a placebo-controlled, randomized trial assessing the effect of the non-calcium-based phosphate binder lanthanum carbonate on cardiovascular markers over 96 weeks in 278 participants with stage 3b/4 CKD. In this pre-specified exploratory analysis, we examined the effect of lanthanum carbonate on serum CPP in a non-dialysis-dependent CKD population. We included all participants who had CPP data at baseline and at least one follow-up measure.
MATERIALS AND METHODS
Full details of the study protocol [17], participant characteristics [18] and the primary trial results [16] from IMPROVE-CKD have been reported. In brief, IMPROVE-CKD was an international study, conducted across 17 sites in Australia, New Zealand and Malaysia and coordinated by the Australasian Kidney Trials Network (AKTN). Ethical approval was obtained by each local institutional ethics committee and the trial was prospectively registered (ACTRN12610000650099) and conducted in accordance with the declaration of Helsinki.
All participants provided written informed consent, were at least 18 years of age, had stage 3b or 4 CKD [estimated glomerular filtration rate (eGFR) 15–44 mL/min/1.73 m2] and had at least one recording of serum phosphate ≥1.00 mmol/L in the 6 months prior to enrolment. Potential participants were excluded if they had a serum phosphate ≤0.8 mmol/L at screening, or if they had a kidney transplant, a medical condition that may affect calcium and phosphate metabolism (apart from CKD), a gastrointestinal disorder, were pregnant or breast-feeding, or had been hospitalized or had a cardiovascular event within 1 month of screening.
Participants were randomized to receive either 500 mg lanthanum carbonate or a matching placebo three times a day with meals for 96 weeks. Study medication was up-titrated by local investigators if serum phosphate remained persistently >1.60 mmol/L, to a maximum total dose of six tablets per day. Other phosphate binders were ceased for 2 weeks prior to the commencement of the study medication; however, other phosphate binders could be prescribed during the study for persistent hyperphosphataemia if the study medication had already been maximally titrated.
Outcome measures
For this sub-study, blood samples for CPP were collected at baseline and after 24, 48, 72 and 96 weeks. Blood was collected via standard venepuncture techniques and allowed to clot for 30 min before centrifugation. Serum aliquots were stored at −80°C until blinded batch-analysis at a central laboratory. Serum CPP-I and CPP-II were measured using a fluorescent probe-based assay running on a BD FACSVerse flow cytometer as previously described [13, 14].
Surrogate cardiovascular markers
As previously described [16–18], vascular stiffness was assessed using pulse wave velocity (PWV), which was measured as the mean of two carotid-femoral measurements at each time-point using a SphygmoCor device (AtCor, PWV Inc., Sydney, Australia), while abdominal aortic calcification (AAC) was determined by Agatston score from computed tomography at baseline and 96 weeks. Agatston score was calculated from the density and total size of calcification in the abdominal aortic wall over a length of 10 cm below the upper end plate of the L2 lumbar vertebral body. As well as PWV and AAC, the binary variables of ‘PWV >10 m/s’ as well as ‘presence of AAC’ were also included as variables at baseline and 96 weeks. PWV ≥10 m/s was used as it is considered as the threshold where risk of cardiovascular events is significantly increased [19]. Presence of AAC was defined as Agatston score greater than zero.
Statistical analysis
The main outcome of interest was the effect of lanthanum carbonate on CPP-I and CPP-II at 96 weeks. Between-group differences for both CPP-I and CPP-II were analysed by fitting linear mixed effects models with repeated measurements (MMRM). For each model, treatment group, categorical time, group–time interaction and baseline values were fitted as fixed effects and an unstructured covariance structure was used to model within-patient correlation. Missing baseline values (six participants for CPP-I and seven participants for CPP-II) were replaced by mean imputation. Values for both CPP-I and CPP-II were natural log-transformed before fitting each model to ensure normal distribution of residuals. To aid interpretation, the regression coefficients and 95% confidence limits were exponentiated to obtain estimates of the percentage change. Models for CPP-I and CPP-II were repeated after (i) adjusting for medication compliance, (ii) restricting the analysis to participants with at least 80% compliance, (iii) adjusting for CKD stage, age and diabetes. For these analyses, compliance was defined as the number of study follow-up visits for which the participant was taking the randomized treatment.
In further exploratory analyses, we used Pearson correlation to examine the relationship between baseline serum CPP and demographic and biochemical variables. We also examined correlations between baseline CPP and both baseline and change in surrogate cardiovascular markers, as well as change in eGFR.
No adjustments for multiple comparisons were made. All statistical hypothesis testing was two-sided with P < 0.05 considered statistically significant. Analyses were performed using SAS software (version 9.4; SAS Institute Inc., Cary, NC, USA).
RESULTS
Participant characteristics and medication use
A total of 278 participants were enrolled in IMPROVE-CKD. Of these, 253 had CPP data for baseline and at least one follow-up timepoint and were included in this analysis. Participant demographic, biochemical and clinical characteristics at baseline were well-matched between groups (Tables 1 and 2 and Supplementary data, Table S1). Overall, the mean age of the cohort was 62.4 ± 12.6 years, 32.0% were female, 67.2% had stage 4 CKD and 91% were normophosphataemic (serum phosphate ≤1.50 mmol/L). At baseline, median serum CPP-I was 14.9 × 10⁴ particles/mL [interquartile range (IQR) 4.6–49.3] and median CPP-II was 3.3 × 10³ particles/mL (IQR 1.4–5.4).
Participant demographics and characteristics at baseline
| Overall | Placebo | Lanthanum | |
|---|---|---|---|
| (n = 253) | (n = 127) | (n = 126) | |
| Age (yrs) | 62.4 ± 12.6 | 61.8 ± 13.1 | 63.1 ± 12.1 |
| Female sex, n (%) | 81 (32.0) | 41 (32.3) | 40 (31.7) |
| Country of study site, n (%) | |||
| Australia | 182 (71.9) | 92 (72.4) | 90 (71.4) |
| New Zealand | 30 (11.9) | 15 (11.8) | 15 (11.9) |
| Malaysia | 41 (16.2) | 20 (15.7) | 21 (16.7) |
| Ethnicity, n (%) | |||
| White/Caucasoid | 157 (62.1) | 85 (66.9) | 72 (57.1) |
| Australian Aboriginal or Torres Strait Islander | 1 (0.4) | 0 | 1 (0.8) |
| New Zealand Māori or Pasifika | 6 (2.4) | 1 (0.8) | 5 (4.0) |
| Asian | 62 (24.5) | 29 (22.8) | 33 (26.2) |
| Other | 27 (10.7) | 12 (9.4) | 15 (11.9) |
| Body mass index (kg/m2) | 29.8 ± 6.0 | 30.1 ± 6.2 | 29.6 ± 5.8 |
| Waist circumference (cm) | 102.4 ± 15.8 | 103.0 ± 16.0 | 101.9 ± 15.7 |
| CKD stage, n (%) | |||
| Stage 3b | 83 (32.8) | 42 (33.1) | 41 (32.5) |
| Stage 4 | 170 (67.2) | 85 (66.9) | 85 (67.5) |
| Primary cause of kidney disease, n (%) | |||
| Diabetic nephropathy | 78 (30.8) | 41 (32.3) | 37 (29.4) |
| Hypertension/vascular | 42 (16.6) | 19 (15.0) | 23 (18.3) |
| Glomerulonephritis | 36 (14.2) | 21 (16.5) | 15 (11.9) |
| Reflux nephropathy | 9 (3.6) | 5 (3.9) | 4 (3.2) |
| Polycystic kidney disease | 12 (4.7) | 4 (3.1) | 8 (6.3) |
| Other | 38 (15.0) | 17 (13.4) | 21 (16.7) |
| Unknown | 38 (15.0) | 20 (15.7) | 18 (14.3) |
| Diabetes mellitus, n (%) | 113 (44.7) | 54 (42.5) | 59 (46.8) |
| Hypertension, n (%) | 228 (90.1) | 114 (89.8) | 114 (90.5) |
| Dyslipidaemia, n (%) | 198 (78.3) | 100 (78.7) | 98 (77.8) |
| Cardiovascular disease, n (%) | 75 (29.6) | 35 (27.6) | 40 (31.7) |
| Peripheral vascular disease, n (%) | 21 (8.3) | 10 (7.9) | 11 (8.7) |
| Cerebrovascular disease, n (%) | 16 (6.3) | 9 (7.1) | 7 (5.6) |
| Smoking status, n (%) | |||
| Never | 123 (48.6) | 65 (51.2) | 58 (46.0) |
| Former | 115 (45.5) | 57 (44.9) | 58 (46.0) |
| Current | 15 (5.9) | 5 (3.9) | 10 (7.9) |
Mean ± SD or number (percentage).
Biochemical and clinical parameters at baseline
| Overall | Placebo | Lanthanum | |
|---|---|---|---|
| (n = 253) | (n = 127) | (n = 126) | |
| Haemoglobin (g/L) | 124.1 ± 16.4 | 123.2 ± 16.4 | 125.1 ± 16.4 |
| Albumin (g/L) | 39.0 ± 4.4 | 38.7 ± 4.2 | 39.2 ± 4.6 |
| Bicarbonate (mmol/L) | 23.4 ± 3.4 | 23.5 ± 3.2 | 23.3 ± 3.7 |
| Urea (mmol/L) | 15.9 ± 5.1 | 15.6 ± 4.8 | 16.2 ± 5.4 |
| Creatinine (µmol/L) | 221.2 ± 59.9 | 218.9 ± 58.6 | 223.5 ± 61.4 |
| eGFR (mL/min/1.73 m2) | 26.6 ± 8.3 | 27.0 ± 8.3 | 26.2 ± 8.2 |
| Uric acid (mmol/L) | 0.5 ± 0.11 | 0.5 ± 0.1 | 0.5 ± 0.1 |
| Glucose (mmol/L) | 6.3 ± 3.0 | 6.3 ± 2.8 | 6.4 ± 3.2 |
| Calcium (mmol/L) | 2.3 ± 0.1 | 2.3 ± 0.1 | 2.3 ± 0.1 |
| Phosphate (mmol/L) | 1.3 ± 0.2 | 1.3 ± 0.2 | 1.2 ± 0.2 |
| ALP (U/L) | 88.9 ± 31.3 | 92.4 ± 30.3 | 85.4 ± 32.0 |
| Bone specific ALP (µg/L) | 14.2 (10.4–18.1) | 14.8 (10.9–18.2) | 13.3 (9.8–17.9) |
| PTH (pmol/L) | 12.1 (7.2–17.8) | 11.8 (7.9–16.4) | 12.9 (6.4–19.4) |
| 25-hydroxyvitamin D (nmol/L) | 70.3 ± 31.2 | 68.8 ± 30.0 | 71.8 ± 32.4 |
| 1,25-dihydroxyvitamin D (pmol/L) | 77.8 ± 26.8 | 75.5 ± 26.7 | 80.3 ± 26.9 |
| C-terminal FGF23 (RU/mL) | 222.0 (155.7–334.1) | 225.8 (161.0–328.2) | 220.7 (151.7–353.1) |
| Intact FGF23 (pg/mL) | 133.0 (89.1–202.0) | 136.1 (89.1–202.0) | 124.8 (88.9–208.5) |
| Urinary phosphate excretion (mmol/24 h) | 24.1 ± 11.6 | 25.8 ± 12.9 | 22.4 ± 9.9 |
| Cholesterol (mmol/L) | 4.5 ± 1.1 | 4.5 ± 1.1 | 4.6 ± 1.2 |
| Triglyceride (mmol/L) | 2.1 ± 1.3 | 2.0 ± 1.1 | 2.2 ± 1.5 |
| C-reactive protein (mg/L) | 4.8 ± 6.4 | 4.6 ± 6.3 | 5.0 ± 6.5 |
| Protein excretion (mg/24 h) | 805 (209–1765) | 920 (310–1880) | 570 (120–1730) |
| Urine ACR (mg/mmol) | 73 (20–138) | 86 (23–147) | 53 (16–137) |
| Pulse-wave velocity (m/s) | 10.7 ± 3.6 | 10.8 ± 3.6 | 10.7 ± 3.5 |
| Pulse wave velocity ≥10 m/s | 115 (47.7%) | 55 (45.5%) | 60 (50.0%) |
| Aortic calcification | 174 (80.6%) | 81 (76.4%) | 93 (84.5%) |
| Agatston score (HU) | 1288 (58–5178) | 710 (8–3373) | 1975 (257–5744) |
Mean ± SD, number (percentage) or median (interquartile range).
eGFR calculated using CKD–Epidemiology Collaboration equation.
ACR, albumin-to-creatinine ratio; ALP, alkaline phosphatase; FGF23, fibroblast growth factor-23; PTH, parathyroid hormone.
There was no significant group difference in the median number of study medication tablets consumed per day (2.69 for placebo; 2.55 for lanthanum) and the proportion of participants using a non-study phosphate binder during the study was low in each group (8.7% for placebo; 7.9% for lanthanum). The use of cholecalciferol (22.5% overall) and calcitriol (9.1% overall) was similar in each group.
Primary outcome
Summary data for CPP-I and CPP-II at each time point are displayed in Figure 1. After 96 weeks, lanthanum carbonate was not associated with a significant difference in CPP-I {22.8% [95% confidence interval (CI) −39.2, 36.4], P = 0.65} or CPP-II [−18.3% (95% CI −40.0, 11.2), P = 0.20] compared with placebo (Table 3). Adjustment for medication compliance, participants with at least 80% compliance and for CKD stage, age and diabetes, did not significantly alter the results of these analyses. There was notable variation in the observed distribution of values of CPP-I and CPP-II between sites (Supplementary data, Figure S1), however further adjustment for the study site yielded similar estimates of treatment effect (not shown).
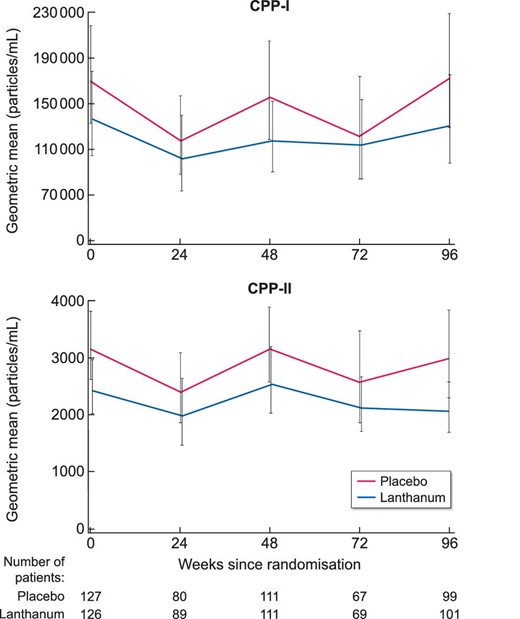
Serum primary (CPP-I) and secondary (CPP-II) calciprotein particles over 96 weeks by treatment group (geometric mean and 95% confidence interval).
Calciprotein particles (CPP) at baseline and after 96 weeks, with between-group differences
| Baseline | Week 96 | Treatment effect versus placebo at Week 96 | ||||
|---|---|---|---|---|---|---|
| N | Median (IQR) | N | Median (IQR) | % change (95% CI) | P-value | |
| CPP-I (×104 particles/mL) | ||||||
| Placebo | 127 | 16.3 (6.5–59.7) | 99 | 17.6 (6.0–54.8) | – | – |
| Lanthanum | 12.4 (3.7–48.5) | 15.2 (4.6–35.8) | 22.8 (−39.2, 36.4) | 0.648 | ||
| CPP-II (×103 particles/mL) | ||||||
| Placebo | 126 | 3.8 (1.5–5.8) | 99 | 3.5 (1.3–5.8) | – | – |
| Lanthanum | 3.0 (1.3–5.1) | 2.6 (1.0–4.0) | −18.3 (−40.0, 11.2) | 0.198 | ||
Change in calciprotein particles (CPP) compared with baseline, estimated from mixed effects models with repeated measurements. Models were fitted to natural log transformed data in order to ensure normal distribution of residuals; thereafter the regression coefficients have been exponentiated into percentage change to aid interpretation.
Correlation between CPP and other variables
There were no correlations between serum CPP-I or CPP-II and markers of vascular stiffness (PWV and PWV > 10 m/s) or vascular calcification (AAC Agatston score and binary presence of AAC) at baseline, nor was there any correlation between baseline levels of CPP-I or CPP-II and change in PWV, Agatston score, or eGFR at 96 weeks (Supplementary data, Table S2). There were few correlations between patient baseline demographics and conventional biochemistry with serum CPP (Supplementary data, Table S3).
DISCUSSION
In this planned exploratory analysis of a large, international, randomized clinical trial, we found that the use of lanthanum carbonate, a non-calcium containing phosphate binder, in patients with stage 3b and 4 CKD was not associated with any significant change in serum CPP-I or CPP-II over 96 weeks. This finding was not altered by adjusting the analysis for medication compliance, or other potential confounders, including CKD stage and diabetes. Our findings suggest that intestinal phosphate binders may not be an effective strategy to lower serum CPP in patients with non-dialysis-dependent CKD.
The lack of effect of lanthanum carbonate on serum CPP is perhaps not unexpected given that in the IMPROVE-CKD trial, lanthanum carbonate was also not associated with a reduction in serum phosphate when compared with placebo [16]. While serum phosphate is arguably an insensitive marker of total phosphate balance, other measures of phosphate metabolism, including 24-h urinary phosphate excretion, serum PTH and serum fibroblast growth factor-23, were also unaltered by lanthanum carbonate in IMPROVE-CKD [16]. In the absence of other measurable effects of lanthanum carbonate on mineral metabolism in this cohort, the lack of a treatment effect on CPP would appear consistent with these other null observations.
Our results do, however, contrast with previous smaller and shorter trials in haemodialysis patients, which reported that alterations of phosphate binders were associated with changes in serum CPP, as well as its precursor serum CPM, despite an absence of change in serum phosphate. In an open-label randomized control trial of 31 haemodialysis patients, Smith et al. found that sevelamer carbonate was associated with significant reductions in CPP-I compared to calcium carbonate at 24 weeks [14]. In a separate study measuring CPM by gel-filtration method [20], Nakamura et al. demonstrated that changing patients from calcium carbonate to lanthanum carbonate resulted in lower levels of CPM in a 16-week crossover study of 24 haemodialysis patients [15].
Notably, though, both previous studies were in the setting of kidney failure requiring dialysis, and participants in these studies had numerically higher baseline values of conventional markers of mineral metabolism, including serum phosphate, than in our cohort. Additionally, recent evidence has suggested that CPM appears to be predominantly cleared by the kidneys [21]. A reasonable prediction may be that as CKD progresses, CPM and as a result CPP, progressively accumulate. It is plausible that in more severe stages of CKD, as the homeostatic role of the kidneys is progressively lost, that gastrointestinal mineral load may become a more prominent determinant of serum CPP and perhaps also more responsive to therapeutic interventions with phosphate binders.
Another potential explanation for the differing results between IMPROVE-CKD and previous studies by Smith et al. and Nakamura et al. is that the latter two studies used calcium carbonate as the comparator, rather than a placebo. Given that calcium is a significant component of CPP, it is conceivable that in these studies the exogenous calcium load from calcium carbonate [22] may have contributed to elevated levels of CPP, making it challenging to isolate the effects of intestinal phosphate binding in these studies. Given the divergent results of previous studies and our study, carefully designed future trials are required to separate and characterize the individual effect of phosphate-binding from calcium load, as well as to clarify whether the severity of CKD modifies any effect of phosphate binders on serum CPP.
It is notable that we found a lack of correlation between serum CPP and two surrogate cardiovascular markers. Previous clinical studies suggested a positive correlation between serum CPP (and its precursor CPM) and vascular endpoints in CKD, such as vascular stiffness [5] coronary artery calcification [6, 7] the risk of cardiovascular events [8] and mortality [9]. Additionally, in vitro data suggest that CPP directly mediate a range of cellular responses that typify pathological processes in CKD, including expression of inflammatory mediators and calcification [10, 23, 24]. In this regard, it was unexpected that we found no correlation between CPP and markers of arterial stiffness or aortic vascular calcification at baseline, nor was the baseline level of CPP associated with progression of either of these surrogate cardiovascular measures at 96 weeks. Interestingly though, in the overall study cohort, conventional markers of mineral metabolism, including serum phosphate, calcium and PTH, were also not predictive of these measures [18]. We acknowledge that the majority of participants in this study already had evidence of advanced vascular stiffness and calcification at baseline, given a mean carotid-femoral PWV of the cohort greater than 10 m/s and 81% of participants with AAC on CT. This relative lack of heterogeneity may have reduced our ability to properly assess the association between serum CPP and arterial stiffening and calcification than in a more diverse population.
There was also a general lack of correlation between serum CPP and other demographic and biochemical markers. We utilized a next-generation flow-cytometric assay, which allows discrimination of CPP from other mineral containing components in blood, as well as separately quantifying CPP-I and CPP-II subtypes [13]. This method uses a rapid freeze protocol and avoids prolonged incubation, minimizing ex vivo generation of mineral precipitation artefact, and readouts have been shown to be stable after a freeze–thaw cycle [14]. In addition, post hoc analyses did not show any correlation between the storage time of samples and levels of either CPP-I or CPP-II (not shown). We adopted the same collection protocols with centralized batch analysis that has reliably been used in several recent single-centre [14, 25, 26] and multicentre [27] studies. We did observe unexpected variation in the distribution of CPP values between sites. However, there was no suggestion of a centre effect when our main MMRMs were refitted with adjustment for the study site and results were consistent when analyses were restricted to data from the largest study site, which contributed 48 participants (19%) to the overall study cohort (not shown). These additional analyses provide some reassurance that variation in sample collection and processing between sites is unlikely to be the explanation for our null findings, although we acknowledge that this is not possible to definitively exclude in retrospect. Nevertheless, future studies utilizing this assay may help to clarify the relationship of serum CPP with other markers of mineral metabolism, as well as vascular risk, in patients with non-dialysis-dependent CKD.
Strengths and limitations
IMPROVE-CKD was a multi-national randomized controlled trial that, in comparison with other studies assessing serum CPP using the flow-cytometric assay, had large participant numbers and long follow-up. In comparison with previous trials assessing the effect of phosphate binders on serum CPM and CPP, our study was the only trial to use placebo as the comparator and so we were able to exclude potential confounding from exogenous calcium loading.
We acknowledge that this sub-study had several limitations. IMPROVE-CKD was designed to test the effect of lanthanum carbonate on surrogate cardiovascular markers rather than serum CPP and so our analysis is exploratory by nature. Another permutation of the design is that trial medication was titrated against serum phosphate, rather than serum CPP, and so we are unable to answer whether an alternative strategy to titrate lanthanum carbonate directly to serum CPP would have been more effective. However, given that the median number of lanthanum tablets taken by participants was 3 per day, even if higher doses of lanthanum achieved reductions in serum CPP, it would be questionable whether such a therapeutic regimen would be feasible in routine clinical practice.
It is also important to note that blood draws were not standardized to time of day or in relation to meals. It is unclear whether serum CPP, as measured using the flow cytometric method, is liable to diurnal or post-prandial variation. Data about last food intake and time of sample collection were not routinely collected in this study, and so it was not possible to examine for these possible effects; however, a previous study estimating serum CPP by the earlier fetuin-A ELISA-based method in a small group of diabetic patients suggested that post-prandial spikes may be seen [28]. Finally, we utilized surrogate cardiovascular markers of vascular stiffness and calcification, as assessed by PWV and AAC and it is not clear if serum CPP levels ascertained using this second-generation assay may still hold value in assessing the risk of hard patient outcomes in this population, such as cardiovascular events and death.
CONCLUSION
Our study found that the use of the non-calcium-containing phosphate binder lanthanum carbonate was not associated with any reduction of serum CPP-I or CPP-II in participants with stage 3b or 4 CKD over 96 weeks when compared with placebo. Further, we were unable to confirm the purported relationship between CPP and the surrogate cardiovascular markers of PWV and AAC.
ACKNOWLEDGEMENTS
The authors would like to acknowledge the IMPROVE-CKD Trial Steering Committee, Data and Safety Monitoring Board, the Australasian Kidney Trials Network (AKTN) Project management team, the AKTN Executive Committee Members and collaborating sites and investigators from Australia, New Zealand and Malaysia. We thank Dana Jackson and Kenneth Lau (Monash Imaging, Monash Health, Australia), who performed all CT analyses for calculation of AAC, and Belinda Wigg (Department of Nephrology, The Royal Melbourne Hospital, Australia) for technical assistance with the CPP assay.
FUNDING
This investigator-initiated research work was supported by National Health and Medical Research Council of Australia research grants APP1044302, APP1092957 and ID 631731, RMH Home Lottery Project Grant PG-004-2018 and by Shire (a member of the Takeda group of companies) grant IST-AUS-000108. None of the funding organizations had any role in study design, collection, analysis and interpretation of data, writing of the report, or the decision to submit the report for publication.
AUTHORS’ CONTRIBUTIONS
All authors were involved in study design and concept. M.K.T., E.R.S., E.M.P. and N.D.T. analysed the data. M.K.T. drafted the manuscript; all authors reviewed and edited the manuscript and approved the final version.
CONFLICT OF INTEREST STATEMENT
G.J.E. has received honoraria, travel support and research funding from Amgen, Shire and Sanofi. C.M.H. reports research grants from National Health and Medical Research Council of Australia; research funding to her institution from Baxter Healthcare, Fresenius Medical Care and Shire; and consultancy fees from GlaxoSmithKline, Janssen and Otsuka paid to her institution; and personal fees from Otsuka and grants from Shire, outside the submitted work. S.G.H. reports receiving nonfinancial support from Amgen; personal fees from AstraZeneca; other from Baxter; personal fees from Otsuka; grants from Sanofi; and honoraria, travel support and research funding from Amgen, AstraZeneca, Baxter and Sanofi, outside the submitted work. N.M.L. reports support for research from the Australian Commonwealth with an RTP scholarship, outside the submitted work. E.P. reports honoraria, travel support and research funding from Amgen, Shire, Sanofi and AstraZeneca, outside the submitted work. E.R.S. owns stock in Calciscon AG, which commercializes the T50 test and reports research funding from Amgen and Sanofi, outside the submitted work. M.K.T. is supported by funding from the Haydn and Henrietta Williams Memorial Trust and the Australian Commonwealth Government through a Research Training Program Scholarship. N.D.T. reports research funding and honoraria from Amgen, Sanofi and Shire Pharmaceuticals. All remaining authors have nothing to disclose. The authors declare that the results presented in this paper have not been published previously in whole or part, except in abstract format.


Comments