


ABSTRACT
Fabry disease (FD) is an X-linked lysosomal storage disorder caused by deficient α-galactosidase A activity. The spectrum of disease includes phenotypes ranging from “classic” to “later-onset,” with varying kidney disease progression. Identifying patterns of declining kidney function and involvement of other major organs in patients with FD is important to guide therapy decisions.
Clusters of patients with FD and similar estimated glomerular filtration rate (eGFR) decline and age were created using agglomerative clustering of data captured between 2007 and 2020 in the United States Optum Market Clarity database. Male patients with a diagnosis of FD and two or more eGFR values ≥6 months apart were included. Disease progression was compared with a control cohort of patients without an FD diagnosis.
eGFR values from 234 male patients with FD were analysed, yielding seven clusters. Five clusters demonstrated disease progression from “natural” eGFR decline, with a slight decrease in kidney function and eGFR usually within the normal range, to rapid, early decline in eGFR and cardiac complications. When compared with the control cohort, a more rapid decline and a higher percentage of cardiac hypertrophy, heart failure, arrhythmias and stroke were noted in the study group. An inflection point was observed in each cluster when deterioration of kidney function accelerated.
Clustering of male patients with FD by decline in kidney function, organ involvement and phenotype through analysis of real-world data provides a reference that could help determine the optimal time for initiation of FD-specific treatment and facilitate management decisions made by healthcare professionals.
What is already known about this subject?
Fabry disease (FD) is an inherited, progressive lysosomal storage disorder affecting multiple organ systems.
Due to the heterogeneous spectrum of clinical manifestations, an individualised approach to patient care is needed.
There is a lack of consensus regarding optimal timing of FD-specific therapy initiation.
What this study adds?
Modelling disease progression can help physicians to consider timely initiation of treatment by identifying common sequences of FD manifestations and organ class involvement in patients.
To our knowledge, this is the first study clustering patients with FD according to decline in kidney function and phenotype through analysis of real-world data.
What impact this may have on practice or policy?
Better understanding of how decline in kidney function and organ involvement may be associated with varying phenotypes.
Defining patterns of decline could inform therapeutic decision-making.
INTRODUCTION
Fabry disease (FD; OMIM #301500) is an X-linked lysosomal storage disorder caused by a variety of pathogenic GLA variants [1, 2]. The resultant deficiency in α-galactosidase A (α-Gal A) activity results in accumulation of globotriaosylceramide (GL-3) and its derivatives in many cell types throughout the body. Progressive cellular damage due to this accumulation leads to dysfunction of vital organs and reduced life expectancy [1].
The spectrum of FD is broad, and phenotype definitions range from the “classic,” with paediatric onset and multi-organ involvement, to “later-onset,” with often single-organ involvement and a predominantly cardiac phenotype. Both men and women can exhibit either phenotype; however, the most severe classic phenotype, associated with extremely low, or no, α-Gal A activity, presents more frequently in men than in women. Patients with varying levels of residual α-Gal A activity develop the later-onset phenotype characterised by slower and less consistent disease progression. Typically, increased genotype–phenotype variability is found in women relative to men due to random X-chromosome inactivation of the GLA gene [1, 3].
Due to this phenotypic variability, a proportion of patients diagnosed with FD remain untreated due to the limited availability of data on the disease course of untreated FD, particularly in patients with later-onset phenotypes, and the absence of prognostic information on the optimal timing of initiation of FD-specific treatment [3, 4]. The heterogeneity of the spectrum of clinical manifestations suggests that a tailored approach to patient care is needed.
The primary objective of this study is to identify the patterns of progression of decline in kidney function and involvement of other major organs in male patients with FD prior to treatment initiation. The study aims to assist therapeutic decision-making and disease management by modelling clustered patterns of FD progression for a more comprehensive view of the differences in the disease's natural history and the opportunities for timely intervention.
MATERIALS AND METHODS
Data sources and analysis
Data from 1 January 2007 to 30 June 2020 were retrospectively analysed from the Optum Market Clarity database, which combines data from more than 50 integrated delivery networks in the USA and includes the electronic health records (EHR) of more than 100 million patients from generalised care settings. Due to clinical phenotype heterogeneity in females, only male patients with at least two International Classification of Diseases, Tenth Revision (ICD-10) diagnostic codes for FD [5], or at least one prescription for FD-specific treatment (agalsidase beta [6] or migalastat [7]) or mention of FD diagnosis in physicians’ notes, were included. From this group, the following patients were excluded to form the study cohort of patients with FD (herein referred to as study cohort): (Step 1) patients diagnosed with another lysosomal disorder or with a disease from a list of potential misdiagnoses (Gaucher disease, Krabbe disease, Niemann–Pick disease, Tay–Sachs disease, metachromatic leukodystrophy, Sandhoff disease, Farber disease, multiple sclerosis or juvenile rheumatoid polyarthritis); (Step 2) patients with incoherent timelines in their EHR; (Step 3) patients younger than 5 years of age with manifestations reported as attributable to FD; and (Step 4) patients with disease progressions considered too heterogeneous, and patients without two estimated glomerular filtration rate (eGFR) values at least 6 months apart prior to treatment initiation. Only data prior to treatment initiation were analysed in the study. A broad control cohort of patients without an FD diagnosis matched only on sex and duration of follow-up (herein referred to as non-FD control cohort) was also created from the database.
To detect potential bias within the study cohort, demographic and clinical characteristics such as signs, diseases and symptoms were compared with those of a control cohort of patients with FD (herein referred to as the FD control cohort) composed of patients who were excluded at Step 4 (disease progression too heterogeneous, or insufficient eGFR data). These included a subset of FD-related renal signs, cardiac signs and symptoms, and/or comorbidities such as diabetes mellitus, hypertension, hyperlipidaemia and obesity (definitions provided in Supplementary data, Table S1), but did not include patient-specific information on the type of GLA variant as this was not available in the Optum database. The data were compiled using information from: (i) diagnoses (ICD-9 and ICD-10 codes); (ii) procedures (ICD-9, ICD-10, Healthcare Common Procedure Coding System, Current Procedural Terminology codes); (iii) treatments (National Drug Code Directory); (iv) lab measurements; and (v) provider notes (Supplementary data, Table S2) [5, 8–10].
eGFR was used to stratify disease progression. Male patients with FD were required to have a minimum of two eGFR values at least 6 months apart recorded in the database. The Mayo Clinic Quadratic Equation (MCQE) formula was used for all patients at all ages to estimate GFR to avoid changes in measure due to a switch in the formula [11]. The MCQE considers factors such as body mass (not included in the statistics), sex and age, making its estimation of eGFR one of the most accurate currently available [11, 12].
Analytical methodology
The analysis consisted of a four-step process. The first step involved the construction of sequences of events characteristic of FD kidney dysfunction and comorbidities for each patient followed by the modelling of eGFR slopes for each patient. During the second step, eGFR measures were processed to automatically exclude acute kidney injury (AKI) events, defined as an eGFR drop of ≥30 mL/min/1.73 m² within 3 weeks, and individuals without eGFR measures 6 months apart, to focus on the chronic component in kidney function decline. Values post-kidney transplant and post-FD treatment were censored and the eGFR values were smoothed before fitting a linear regression to approximate the speed of progression. The age of patients at chronic kidney disease (CKD) stage 2 and end-stage renal disease (ESRD) was extrapolated using their regression.
The third step consisted of clustering patients based on similarity of eGFR slopes and age. An agglomerative hierarchical clustering algorithm was chosen to cluster progressions and was applied on a patient distance matrix [13]. The distance between every patient was computed based on the difference in eGFR slopes and difference in age at CKD stage 2 and ESRD {distance = Wage[abs(Δage_stage_2) + abs(Δage_stage_5)] + Wslope[abs(Δslope)]; where Wage was the weight given to the age difference (set to 0.7), Δage_stage_2 the age difference at CKD stage 2, Δage_stage_5 the age difference at CKD stage 5, Wslope the weight given to the slope difference (set to 0.3) and Δslope the slope difference} [13]. Outliers were removed and the smallest clusters were merged with the nearest larger cluster. Symptoms and organ involvement including renal, cardiac, neurological and FD hallmarks were described within each cluster to compare patterns of progression.
Finally, clusters were compared with the control cohorts to isolate the impact of FD from that of other comorbidities on kidney dysfunction. Comparison with the non-FD control cohort was used to censor hallmarks occurring after the average age in the general population and to differentiate signs and symptoms due to the ageing process from classical hallmarks of FD typically occurring early in life (acroparaesthesia, anhidrosis, autonomic disorders, corneal deposit, dysautonomia, fasciculation, neuropathic pain, paraesthesia, poly- and mono-neuropathies, sensorineural hearing impairment, tinnitus).
The type of GLA variant and associated level of residual α-Gal A activity (if any) are important factors that influence the prognosis and the rate of decline in renal function [1, 3]. The lack of genotype data in the Optum Market Clarity database prohibited stratification of patients based on predicted phenotype.
RESULTS
Fabry disease study cohort
From the global population of 938 male patients with FD in the Optum database, 753 individuals remained following exclusion of patients with differential diagnosis, missing data or <5 years of age. From this cohort, 234 patients had the required eGFR natural history data (a minimum of two eGFR values at least 6 months apart prior to treatment initiation or kidney transplant) and formed the study cohort. The 519 patients who were excluded because of disease progressions considered to be too heterogeneous or due to insufficient eGFR data formed the FD control cohort to detect any potential bias in the study cohort (Fig. 1).

Creation of the Fabry cohort. M, million; Min, minimal; MS, multiple sclerosis; Q, quarter; SDS, safety data sheet.
The study cohort had an average age at index of 46 years compared with 40 years in the FD control cohort, a longer period in the database (9.16 years vs 6.24 years) and a higher prevalence in all FD manifestations (except for anhidrosis 0.43% vs 3.08%). Average years of follow-up was similar in both groups (3.98 in the study cohort vs 3.14 in the FD control cohort). Mortality was slightly higher in the study cohort vs the FD control cohort (10% vs 8%). However, the mean age of death was 60 years in both groups. The study cohort had more manifestations common to FD than the FD control cohort (mean total 7.97 vs 3.9) with more than twice as many renal or cardiac signs (mean total renal: 1.25 vs 0.44; mean total cardiac: 2.19 vs 0.93). Fewer than half (42%) of the patients in the FD control cohort and less than a quarter of the study cohort (23%) had been initiated on FD-specific treatment, with a mean age of initiation of 43 years in the study cohort compared with 39 years in the FD control cohort (Supplementary data, Tables S3–S6).
Cluster creation
The analyses yielded seven patient clusters. Patient manifestations noted during clustering spanned from the later-onset to classic phenotypes. Within each phenotypic group, variations of declining kidney function patterns were captured. There was a spectrum of progression of decline in kidney function and age of onset between the clusters, and the clusters were defined and grouped as follows (Fig. 2). In Cluster 1 (n = 36; mean age 52 years), defined as “natural” eGFR decline, patients were characterised by a slight decrease in kidney function, and patients in Cluster 2 (n = 29; mean age 55 years) demonstrated slow eGFR decline. Slow progressive eGFR decline across time with a notable accelerated decline of kidney, cardiac and cerebrovascular function from the sixth decade of life onward was observed in Cluster 3 (n = 42; mean age 61 years). Cluster 4 (n = 50; mean age 48 years) patients experienced faster eGFR decline in the first half of life occurring before cardiac and central nervous system complications. Patients grouped in Cluster 5 (n = 30; mean age 36 years) had rapid, early decline in eGFR and occurrence of cardiac complications, with ESRD around 50 years of age. Finally, Cluster 6 (n = 28; mean age 20 years), defined as young patients entering hyperfiltration, and Cluster 7 (n = 19; mean age 39 years), young patients with hypertensive CKD, were not included in the comparison analyses as they were not describing disease progression.
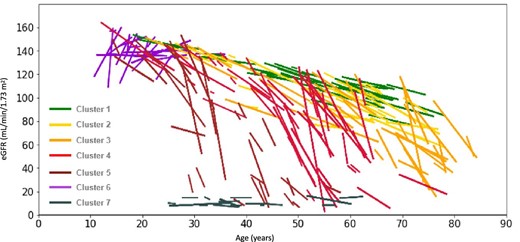
eGFR slopes of individual patients in each of the clusters (linear regression). One line represents one patient.
Cluster comparison
To compare the rate of progression between clusters, the average progression of each cluster was plotted (Fig. 3). A clear progression in the speed of kidney function decline can be observed from Clusters 1 to 5. The average age of onset of each CKD stage was calculated based on the extrapolated regressions of eGFR slopes of all patients inside each cluster, and results showed the eGFR decline was associated with progressive acceleration towards more advanced CKD stages at a younger age (Table 1). CKD and proteinuria (urinary protein excretion of >30 mg/dL or >150 mg/24 h) increased in prevalence from Clusters 1 to 5, with the exception of Cluster 3 where the percentage of patients was greater than Cluster 4 (CKD stages 2–5: Cluster 1, 17%; Cluster 2, 45%; Cluster 3, 71%; Cluster 4, 54%; Cluster 5, 77%; proteinuria: Cluster 1, 8%; Cluster 2, 21%; Cluster 3, 26%; Cluster 4, 24%; Cluster 5, 43%), with Cluster 5 also showing earlier deterioration of kidney function.
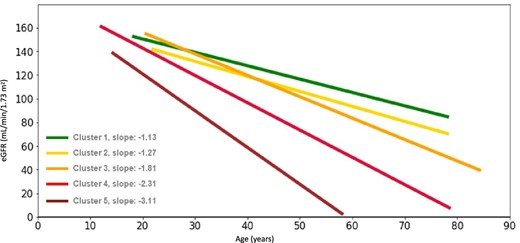
Average eGFR slopes of patients with similar eGFR slopes in Clusters 1–5 (linear regression).
Average age (years) of onset of each CKD stage per cluster.
| CKD stage | |||||
|---|---|---|---|---|---|
| (eGFR range in | Cluster 1 | Cluster 2 | Cluster 3 | Cluster 4 | Cluster 5 |
| mL/min/1.73 m²) | (n = 36) | (n = 29) | (n = 24) | (n = 50) | (n = 30) |
| Age stage 2 (60–89) | 73 | 63 | 56 | 43 | 30 |
| Age stage 3 (30–59) | 86 | 73 | 56 | 40 | |
| Age stage 4 (15–29) | 69 | 49 | |||
| Age stage 5 (<15) | 76 | 54 |
To facilitate comparisons among clusters, a score was created for each organ involved, with the cumulated number of signs, diseases and manifestations shown by each patient presented in a heat map (Fig. 4). A clear progression was observed in the speed of kidney function deterioration, with Cluster 1 showing the slowest progression and Cluster 5 the fastest. Clusters 1 and 2 had the lowest renal involvement and were more impacted by cardiac manifestations. Cluster 1 had neurological manifestations starting in the fourth decade of life. Cluster 3 had late renal manifestations with severe neurological and cardiac manifestations occurring at the same time and the highest mean number of cardiac and neurological manifestations. Cluster 3 had progressive eGFR decline with a significant loss noted around 65 years of age and following AKI onset. Cluster 4 had severe renal and cardiac manifestations occurring in the fourth decade before the onset of neurological manifestations in the fifth decade. Cluster 5 had early deterioration of kidney function and cardiac manifestations, very few neurological symptoms but a high number of FD hallmarks.
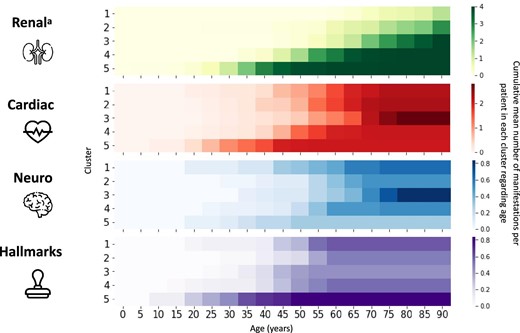
Heat map of organ involvement by cluster. aRenal manifestations are the hypothetic stages when extrapolating the eGFR linear regression.
Clusters were compared with one control cohort per cluster taken from the non-FD control cohort and matched only on period of data availability, age, sex, demographic characteristics and comorbidities (hyperlipidaemia, hypertension, diabetes, obesity), and with a minimum of two eGFR values at least 6 months apart (Table 2). The overall non-FD control cohort consisted of 7724 patients split between the seven clusters. The study cohort had a more rapid decline in eGFR than the non-FD control cohort in each cluster, which was particularly observed in Clusters 3–5; however, this difference was not statistically tested. A higher percentage of cardiac hypertrophy was found in patients in the study cohort compared with the non-FD control cohort, with a statistically significant difference across all the clusters. This finding was the same in patients regarding heart failure and arrhythmias. The study cohort had a higher percentage of valve disorders but the difference between the study cohort and the non-FD control cohort was only significant in Clusters 2–5. A higher percentage of stroke was encountered in the study cohort compared with the non-FD control cohort and the difference between the groups was significant in Clusters 1–4. The percentage of patients with CKD stages 2–5 and proteinuria was greater in the non-FD control cohort than the study cohort in Cluster 1; however, this finding was reversed in Clusters 2–5.
Clinical characteristics of study cohort versus matched non-FD control cohort patients.
| Cluster 1 | Cluster 2 | Cluster 3 | Cluster 4 | Cluster 5 | |||||||||||
|---|---|---|---|---|---|---|---|---|---|---|---|---|---|---|---|
| Study | Control | Chi2 | Study | Control | Chi2 | Study | Control | Chi2 | Study | Control | Chi2 | Study | Control | Chi2 | |
| Number of patients | 36 | 1499 | 29 | 1050 | 42 | 1564 | 50 | 1752 | 30 | 842 | |||||
| eGFR slope, mL/min/1.73 m2/yeara | −1.13 | −1.11 | −1.27 | −1.25 | −1.81 | −1.09 | −2.31 | −0.99 | −3.11 | −0.61 | |||||
| CKD stage 2–5, % | 17 | 41 | ** | 45 | 41 | – | 71 | 49 | ** | 54 | 26 | *** | 77 | 19 | *** |
| Proteinuria, % | 8 | 9 | – | 21 | 7 | * | 26 | 8 | *** | 24 | 5 | *** | 43 | 9 | *** |
| Cardiac hypertrophy, % | 31 | 1 | *** | 21 | 1 | *** | 26 | 2 | *** | 34 | 1 | *** | 40 | 1 | *** |
| Heart failure, % | 25 | 7 | *** | 28 | 9 | ** | 38 | 13 | *** | 24 | 5 | *** | 23 | 3 | *** |
| Valve disorders, % | 22 | 13 | – | 41 | 17 | ** | 50 | 22 | *** | 30 | 10 | *** | 30 | 5 | *** |
| Arrhythmias, % | 78 | 58 | * | 83 | 61 | * | 90 | 61 | *** | 68 | 47 | ** | 73 | 47 | ** |
| Stroke, % | 22 | 7 | ** | 14 | 9 | – | 24 | 10 | * | 18 | 5 | *** | 7 | 2 | – |
P-values: ***P < .001; **P < .01; *P < .05, –, means otherwise. aDifference not statistically tested.
DISCUSSION
To our knowledge, this is the first study using advanced analytical methods to cluster longitudinal progressions of kidney decline in patients with FD, and highlight the spectrum of phenotypes and disease heterogeneity, through analysis of real-world data from a large EHR database representative of the US population. Agglomerative clustering using eGFR measurements of patients with FD revealed seven clusters, of which five show disease progression based on decline in kidney function. These results are in line with previously reported evidence demonstrating that the population of male patients with FD presents a spectrum of phenotypes of variable progression and organ involvement [1, 3]. The different clusters of kidney function decline highlight that FD progression can occur at different stages of life, accelerating or remaining slow, with varying sequences of events. There is indication of an inflection point on the eGFR slopes, observed in individuals from Clusters 2–6, at which decline in kidney function accelerates. This could be an indication of a point of irreversible kidney damage, e.g. a “point of no return,” due to progressive cell loss and glomerulosclerosis. This may be an important finding in helping healthcare professionals make timely treatment-initiation decisions for patients with FD across the disease spectrum. The kidney cluster data, as well as the identification on an inflection point, are consistent with prior data in which a relationship between magnitude of proteinuria and eGFR slope was noted in untreated patients with FD [14]. Moreover, as proteinuria increases over time, the eGFR slope is expected to accelerate over time.
Overall, there was a higher prevalence of all common FD signs and symptoms, notably cardiac manifestations common to later-onset Fabry phenotypes, in the study cohort compared with the FD control cohort, but no greater prevalence of classic FD hallmarks. A mean age of treatment initiation of 43 years in the study cohort compared with 39 years in the FD control cohort are consistent with data from the Fabry Registry [15].
Cluster control patients taken from the non-FD control cohort were matched on key morbidities that can affect kidney function, enabling the share of kidney dysfunction attributable to FD to be determined and thus generating evidence to increase our understanding of the burden of disease caused by FD.
From Cluster 1 (“natural” eGFR decline) to Cluster 5 (rapid, early decline in eGFR), patients’ phenotypes spanned from later-onset to more classic phenotypes and, within each phenotype, variations of declining kidney function patterns were captured. eGFR progression in Clusters 1 and 2 was similar between the clusters and comparable to the control patients. Fewer patients, overall, received FD-specific treatment than patients in the other clusters, which is consistent with their perceived status as later-onset patients who typically are more difficult to diagnose due to a more variable disease course [3]. Age at onset of cardiac signs and the global clinical picture match literature knowledge of a later-onset phenotype with predominant cardiac manifestations [16].
In Cluster 3, patients generally did not develop major organ manifestations until reaching a turning point that triggered an abrupt decline from ∼60 years of age. Kidney damage was particularly apparent, although progressive involvement of all organs was observed. This turning point marked the mean age of first AKI events and suggests slow deterioration of kidney function. This evidence could lead to promising inputs for optimal treatment-initiation time.
Cluster 4 was the first to show steep eGFR decline from early ages in patients with a turning point in the fourth or fifth decade. Cardiac involvement occurred at a similar age to the control population; however, all FD manifestations had a much higher prevalence in the study cohort of this cluster. In contrast to typical males with classic FD, patients from this cluster have few classic symptoms or signs occurring in the third to fifth decade of life. Due to this lack of classic FD manifestations, the age of onset of cardiac manifestations and the abrupt decline of kidney function, the patients in this cluster could be described as having an intermediate phenotype between the classic and the later-onset variant.
In Cluster 5, the age and speed of progression, combined with classic hallmarks, suggested patients with a classic phenotype. This is supported by the relatively young age of these patients (average 36 years of age) and the onset of severe eGFR decline occurring early in life. With many comorbidities apparent at a young age, patients in this cluster followed a more rapid decline in kidney function than those in the control population, which may suggest FD progression. Sudden kidney function decline was followed by cardiac events, indicating a link between cardiac involvement and degradation of kidney function. While cardiac and renal involvement led to the assumption that Cluster 5 patients have an early and aggressive form of the disease, the age at onset of cerebrovascular events and the prevalence of typical classical phenotype features reinforced this hypothesis.
Based on the estimated age at ESRD, kidney outcomes in Clusters 1–5 appear to be better than reports from the Fabry Registry, in which the median age at ESRD was around 40 years [17, 18], and likely corresponded to classic males. The patients in Cluster 7 seem to be more consistent with other reports on patients with classic disease in that they represent patients with ESRD at an early age.
Due to the paucity of information on patients in Clusters 6 and 7, it was difficult to anticipate progression over time, and therefore these clusters were removed from the final analysis. It should be noted that the hyperfiltration observed in Cluster 6 may be an artefact of the serum creatinine–based measurement. A study in young patients with FD concluded that most hyperfiltration eGFRs could not be confirmed by measured GFRs [19]. It may be hypothesized that the observation noted in this cluster may represent decreasing muscle mass of patients due to exercise intolerance and limited digestion as a result of FD manifestations such as acute pain attacks and hypohidrosis, and gastrointestinal symptoms, respectively.
Limitations
Several limitations should be recognised regarding this study. Firstly, the requirement of having a minimum of two eGFR measurements at least 6 months apart not only generated a relatively low number of patients with FD in each cluster but may have biased the study towards better-monitored patients with more severe impairment of kidney function, of an older age than the global FD cohort, and with a higher rate of comorbidities. Secondly, the analysis of eGFR values >60 mL/min/1.73 m² calculated using the serum creatinine–based MCQE formula has been reported to improve, but not exclude, underestimation of GFR [20]. Lastly, the real-world nature of this study with the use of the MCQ database increases the chance of information bias in the disease progression analysis due to the difference in the observation periods from one patient to another, hallmark symptoms of FD only captured in physician notes, the lack of genotypes or predicted phenotypes being available for analysis, and lack of continuous eligibility which afforded potential for loss to follow-up across different care settings. Levels of biomarkers of FD progression [GL-3 and deacylated GL-3 (lyso‐GL‐3)] have been used in the past to measure disease progression; however, this information was not accessible in the database [21].
CONCLUSION
Clustering of male patients with FD by decline in kidney function, organ involvement and phenotype through analysis of a real-world health records dataset could help in determining the optimal time for initiation of FD-specific treatment, promote the use of adjunctive therapies and facilitate management decisions towards improving patient outcomes. The inflection point observed for individuals in Clusters 2–6, followed by acceleration of the decline in kidney function, is of important consideration for FD disease intervention, since it may mark the end of a window of opportunity for prevention or delaying permanent organ damage.
ACKNOWLEDGEMENTS
This study is sponsored by Sanofi. Medical writing support for the development of this manuscript, under the direction of the authors, was provided by Jane Juif of Lucid Group Communications Ltd, UK and Hans Ebels of Sanofi, and funded by Sanofi.
FUNDING
The authors received no financial support for the research, authorship or publication of this article. This research was funded by Sanofi.
AUTHORS’ CONTRIBUTIONS
A.C., E.P., M.B., M.Montmerle, N.L., P.H., P.L. and S.K. helped design the study. P.H., P.L. and S.K. were involved in data acquisition and analysis. A.C., E.P., M.B., M.Maski, M.Montmerle, N.L., P.H., P.L. and S.K. analysed and interpreted the data. All authors wrote and revised the manuscript. All authors read and approved the final article.
DATA AVAILABILITY STATEMENT
The data underlying this article were provided by Optum and Sanofi under licence and with permission. Data will be shared on request to the corresponding author with permission of Optum and Sanofi.
CONFLICT OF INTEREST STATEMENT
S.K., E.P., N.L. and M.Maski are employees of Sanofi and shareholders in the company. A.C., P.H., P.L., M.Montmerle and M.B. are working for Sanofi through a framework contract with Quinten Health.


Comments