


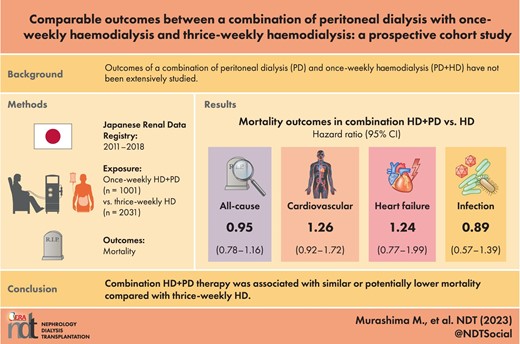
ABSTRACT
Outcomes of a combination of peritoneal dialysis (PD) and once-weekly haemodialysis (PD + HD) have not been extensively studied.
This prospective cohort study using the Japanese Society for Dialysis Therapy Renal Data Registry included those who transitioned from PD to PD + HD therapy or thrice-weekly HD from 2011 to 2018. Exposure was PD + HD therapy compared with thrice-weekly HD. The outcome was time to all-cause or cause-specific death. Associations between PD + HD therapy and outcomes were examined by Cox regression. Sensitivity analyses were performed by propensity score (PS) matching, PS matching with a shared frailty model in which dialysis facilities were treated as a random effect, inverse probability weighting (IPW), PS adjustment, PS stratification, competing risk regression and on-treatment analyses in which data were censored at the transition to thrice-weekly HD for those on PD + HD therapy.
During the study period, 1001 subjects transitioned to PD + HD therapy and 2031 to thrice-weekly HD. During a median follow-up of 3.5 years, 575 subjects died. All-cause, cardiovascular, congestive heart failure–related or infection-related mortality were not significantly different between those on PD + HD and those on thrice-weekly HD [hazard ratio 0.95 (95% confidence interval 0.78–1.16), 1.26 (0.92–1.72), 1.24 (0.77–1.99) and 0.89 (0.57–1.39), respectively]. Sensitivity analyses yielded similar results except that PD + HD therapy was associated with significantly lower all-cause mortality by PS adjustment and PS matching with the shared frailty model and lower infection-related mortality by PS adjustment and IPW.
PD + HD therapy was associated with similar or potentially lower mortality compared with thrice-weekly HD. Considering a flexible lifestyle, PD + HD therapy could be a great option.
What is already known about this subject?
A combination of PD + HD was almost exclusively performed in Japan.
A combination of PD + HD was associated with lower mortality compared with PD alone.
What this study adds?
All-cause and cause-specific mortality were not significantly different between PD + HD therapy and thrice-weekly HD in patients who failed on PD therapy.
What impact this may have on practice or policy?
A combination of PD and once-weekly HD could be a great option for dialysis patients, providing a flexible lifestyle and better quality of life.
INTRODUCTION
A combination of peritoneal dialysis (PD) and once-weekly haemodialysis (HD) has been almost exclusively performed in Japan [1, 2]. In PD + HD therapy, patients usually undergo PD 5 days/week, HD once a week and no dialysis once a week. PD + HD therapy provides clearance and ultrafiltration that are insufficient with PD alone while maintaining a flexible lifestyle and better quality of life.
Previous studies have reported favourable changes after the transition from PD alone to PD + HD therapy. These include better blood pressure control [2–7], a decrease in serum creatinine and β2-microglobulin levels [2–6] and a decline in dialysate:plasma creatinine ratio [2, 5, 7]. However, these studies are limited by small sample sizes and the lack of control groups. Recently we reported that all-cause, cardiovascular (CV) and infection-related mortality were significantly lower among those on PD + HD therapy compared with those on PD alone based on the Japanese Society for Dialysis Therapy Renal Registry (JRDR) [8, 9].
Previous studies have compared PD alone and PD + HD therapy. A clinical question is, is it better to change modality from PD to PD + HD therapy or thrice-weekly HD when it becomes difficult to sustain sufficient ultrafiltration and solute clearance by PD alone. In this study, using data from JRDR, we compared mortality between those who transitioned from PD to PD + HD therapy and those who transitioned to thrice-weekly HD.
MATERIALS AND METHODS
Study design
This is a prospective study using the JRDR database. The JRDR is a nationwide cohort of dialysis patients in Japan. Details about the JRDR were published previously [10]. The Japanese Society for Dialysis Therapy (JSDT) conducts a survey of all dialysis units in Japan at the end of every year. The response rates were >95% throughout the study period. The study protocol was approved by the Medicine Ethics Committee of the Japanese Society for Dialysis Therapy (approval No. 56) and the study was conducted in accordance with the Helsinki Declaration. The waiver of consent for the JRDR was also approved by the Medicine Ethics Committee. Complete de-identification secured the privacy of human subjects in our database, and its secondary or unofficial use (i.e. any distribution to a third party, unauthorized replication or manipulation of the database and deviation from the proposal accepted by the Committee of Renal Data Registry) is strictly prohibited by the provisions of agreements between the principal investigators and the JSDT, by which all rights regarding the database are reserved.
Setting and participants
The inclusion criterion was subjects undergoing PD at some point from 2010 to 2018 who changed their modality from PD to PD + HD therapy or thrice-weekly HD from 2011 to 2018. Prevalent patients were included to select the patients who transitioned from PD to PD + HD therapy or thrice-weekly HD at a similar timing. The observation period terminated at the end of 2019. The exclusion criteria were age <18 years, withdrawal from dialysis or kidney transplantation during the study period, a combination of HD with peritoneal lavage only, a combination of PD with HD twice or more per week, as they might attenuate the difference between PD + HD therapy and thrice-weekly HD, transition from HD to PD or missing values for analyses.
Exposure of interest and outcomes
The exposure of interest was PD + HD therapy, defined as a combination of PD and once-weekly HD, compared with thrice-weekly HD. Outcome variables were all-cause and cause-specific mortality. CV mortality was defined as one of the following: death due to myocardial infarction, valvular heart disease, cardiomyopathy, arrhythmia, pulmonary oedema, sudden cardiac death or stroke. Congestive heart failure (CHF)-related mortality was defined as death due to pulmonary oedema.
Statistical analyses
Data were shown as number (%), mean [standard deviation (SD)] or median [interquartile range (IQR)] as appropriate. In the JRDR database, dates when combination therapy was initiated were not available. Those on PD + HD or thrice-weekly HD at the end of the given year and on PD alone at the end of the preceding year were considered to have initiated PD + HD therapy or thrice-weekly HD in the middle of the given year. Associations between PD + HD therapy and all-cause or cause-specific mortality were examined by Kaplan–Meier analyses and Cox regression models. The main analysis was performed by an intention-to-treat–based approach in which the observation period was until death or the end of 2019. The data were adjusted for age, sex, causes of end-stage kidney disease (ESKD), blood urea nitrogen (BUN), creatinine, albumin, albumin-corrected calcium, phosphate, intact parathyroid hormone (PTH), history of myocardial infarction or coronary artery disease (history of myocardial infarction was collected from 2010 to 2016 and history of coronary artery disease were collected in 2017), haemorrhagic stroke, ischaemic stroke, limb amputation, urine output at the end of the preceding year and the number of events for peritonitis during the preceding year.
Multiple sensitivity analyses were performed including 1:1 PS matching in which subjects were matched by the logit of PS (±0.25 SD), PS matching with shared frailty models in which dialysis facilities were treated as a random effect, inverse probability weighting (IPW; IPW values <1st percentile or >99th percentile were excluded), PS adjustment in which data were adjusted for the logit of PS, PS stratification in which data were stratified by quintiles of PS, competing risk regression in which death from other causes was considered as a competing risk and on-treatment analyses in which data were censored when those on PD + HD therapy transitioned completely to thrice-weekly HD. The PSs for PD + HD therapy were derived from age, sex, causes of ESKD, PD vintage, serum BUN, serum creatinine, albumin, albumin-corrected calcium, phosphate, intact PTH levels, history of cardiovascular morbidities, daily urine volume at the end of the preceding year and the number of events for peritonitis during the preceding year.
For competing risk regression and on-treatment analyses, the data were adjusted for the same covariates as in Cox regression models. Multiple imputations by chained equations were used to replace missing data for covariates using variables in Table 1. Five datasets were imputed. Outcomes were not imputed. Predictive mean matching or logistic regression was used to impute continuous variables or binary variables, respectively. Changes in phosphate, albumin-corrected calcium and intact PTH levels were analysed by mixed-effects models, with time-dependent phosphate or intact PTH levels as dependent variables and covariates, including an interaction term between the cubic term of time and modalities (HD versus PD + HD). For those on PD + HD therapy, values before the transition to thrice-weekly HD were considered. Changes in phosphate, calcium and intact PTH levels were chosen as indicators of solute clearance, as they were less affected by the timing of blood tests in relation to HD therapy compared with BUN and serum creatinine. Statistical analyses were performed using Stata MP version 15.0 (StataCorp, College Station, TX, USA).
Demographics.
| PD + HD (n = 1001) | HD (n = 2031) | P-value | d | |
|---|---|---|---|---|
| Age (years), mean (SD) | 59.8 (11.5) | 64.2 (12.0) | <.001 | −37.4 |
| Male, n (%) | 736 (73.5) | 1387 (68.3) | .003 | 11.5 |
| PD vintage, median (IQR)a | 2.3 (1.1-3.8) | 2.3 (1.0-4.2) | .9 | 1.5 |
| Causes of ESKD, n (%) Glomerulonephritis Diabetesb Hypertension Other | 371 (37.1) 322 (32.2) 130 (13.0) 178 (17.8) | 627 (30.9) 734 (36.1) 282 (13.9) 388 (19.1) | .008 | 13.1 −8.4 −2.6 −3.4 |
| BUN (mg/dl), mean (SD) | 59.4 (14.9) | 56.0 (15.7) | <.001 | 22.1 |
| Creatinine (mg/dl), mean (SD) | 11.6 (3.32) | 9.96 (3.15) | <.001 | 51.2 |
| Albumin (g/dl), mean (SD) | 3.32 (0.47) | 3.18 (0.50) | <.001 | 26.2 |
| Albumin-corrected calcium (mg/dl), mean (SD) | 9.39 (0.81) | 9.40 (0.819 | <.001 | −15.0 |
| Phosphate (mg/dl), mean (SD) | 5.56 (1.29) | 5.27 (1.29) | <.001 | 22.5 |
| Intact PTH (pg/ml), median (IQR)a | 162 (95–278) | 170 (95–269) | .98 | −1.4 |
| Urine output (ml/day), median (IQR)a | 500 (200–1000) | 600 (300–1000) | .007 | −12.7 |
| History of myocardial infarction/coronary artery diseasec, n (%) No Yes Unknown | 841 (84.0) 88 (8.8) 72 (7.2) | 1720 (84.7) 171 (8.4) 140 (6.9) | .87 | −1.8 1.3 1.2 |
| History of haemorrhagic stroke, n (%) No Yes Unknown | 901 (90.0) 30 (3.0) 70 (7.0) | 1842 (90.6) 50 (2.5) 139 (6.9) | .66 | −2.3 3.3 0.6 |
| History of ischaemic stroke, n (%) No Yes Unknown | 846 (84.5) 85 (8.5) 70 (7.0) | 1685 (83.0) 214 (10.5) 132 (6.5) | .19 | 4.2 −7.0 2.0 |
| History of limb amputation, n (%) No Yes Unknown | 923 (92.2) 9 (0.9) 69 (6.9) | 1883 (92.7) 19 (0.9) 129 (6.4) | .84 | −1.9 −0.4 2.2 |
| Peritonitis (events/year), n (%) 0 1 ≥2 | 877 (87.6) 101 (10.1) 23 (2.3) | 1627 (80.1) 303 (14.9) 101 (5.0) | <.001 | 20.5 −14.6 −14.3 |
P-values were by t-test, Mann–Whitney U test or Fisher's exact test.
aStandardized differences were calculated after log transformation.
bDiabetic nephropathy as a primary cause of ESKD.
cHistory of myocardial infarction in the database from 2010 to 2016 and history of ischaemic heart disease in the database in 2017.
d: standardized difference.
RESULTS
Characteristics of patients
Among 29 661 subjects on PD at any point from 2010 to 2018, 2732 and 6008 subjects changed their modality from PD to either PD + HD therapy or thrice-weekly HD, respectively. After exclusion of those with <18 years of age and missing data for analyses, 1001 on PD + HD therapy and 2031 on thrice-weekly HD were available for analyses (Supplementary Fig. 1). There were no clinically significant differences in laboratory data or past histories between included cases and excluded cases except that PD vintage was slightly longer, daily urine output was lower and the use of PD dialysate with a higher glucose concentration was less common among excluded cases (Supplementary Table 1). Demographics are shown in Table 1. Those on PD + HD therapy were significantly younger, had higher serum BUN and creatinine and were less likely to experience peritonitis during the preceding year.
The transition from PD + HD therapy to thrice-weekly HD
A Kaplan–Meier curve for transition to thrice-weekly HD from PD + HD therapy is shown in Fig. 1. The median time on PD + HD therapy was 2 years (IQR 1–5)
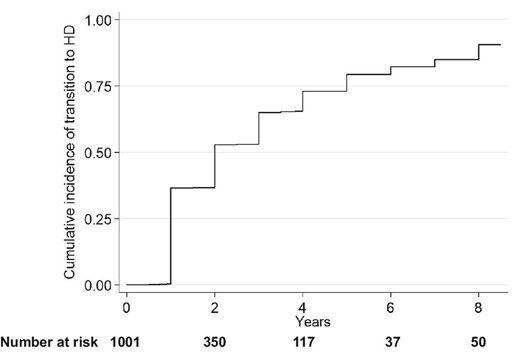
Cumulative incidence of transition to thrice-weekly HD among those on a combination of PD and once-weekly GD.
Association between modalities and all-cause mortality
During a median follow-up of 3.5 years, 143 and 432 subjects died among PD + HD and thrice-weekly HD patients, respectively (incidence rate 3.6 and 5.5 events per 100-patient years, respectively) (Table 2). PD + HD therapy was associated with significantly lower all-cause mortality, likely reflecting the fact that those on PD + HD therapy were younger (Fig. 2). After adjustment for potential confounders, all-cause mortality was similar between the two modalities (Fig. 3). The hazard ratio (HR) for all-cause mortality among those with PD + HD was 0.95 [95% confidence interval (CI) 0.78–1.16] (Table 3).
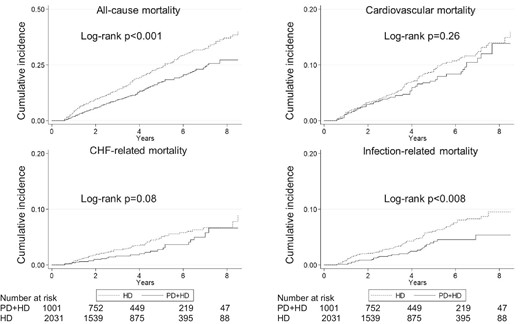
Unadjusted Kaplan–Meier curves for all-cause and cause-specific mortality.
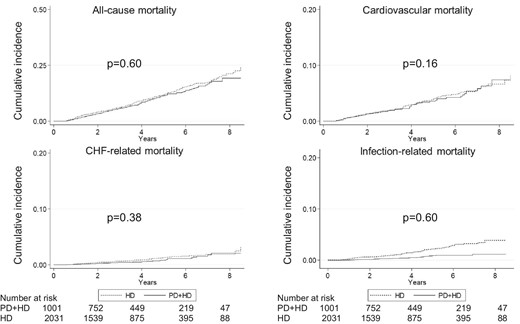
Adjusted Kaplan–Meier curves for all-cause and cause-specific mortality.
Data were adjusted for age, sex, dialysis vintage (log-transformed), causes of ESKD, BUN, serum creatinine, serum albumin, serum albumin-corrected calcium, serum phosphate, serum intact PTH, history of haemorrhagic stroke, ischaemic stroke, myocardial infarction/ischaemic heart disease or limb amputation, daily urine output (log-transformed) and frequency of peritonitis (events/year) at the end of the previous year. P-values were by Cox regression analyses.
The number of events and incidence rate of all-cause and cause-specific mortality.
| Cause of mortality | Number of events | Incidence rate (events/100 patient-years) |
|---|---|---|
| All-cause mortality PD + HD Thrice-weekly HD | 143/1001 432/2031 | 3.6 5.5 |
| CV mortality PD + HD Thrice-weekly HD | 62/1001 145/2031 | 1.6 1.8 |
| CHF-related mortality PD + HD Thrice-weekly HD | 26/1001 76/2031 | 0.7 1.0 |
| Infection-related mortality PD + HD Thrice-weekly HD | 27/1001 94/2031 | 0.7 1.2 |
CV mortality was defined as death due to myocardial infarction, valvular heart disease, cardiomyopathy, arrhythmia, pulmonary oedema, sudden cardiac death or stroke. CHF-related mortality was defined as death due to pulmonary oedema. Infection-related mortality was defined as death due to sepsis, central nervous system infection, pneumonia, influenza virus infection, urinary tract infection, abdominal infection, hepatitis, tuberculosis, human immunodeficiency virus infection or other infection.
Association between PD + HD therapy compared with HD and all-cause or cause-specific death.
| Analysis | All-cause mortality | CV mortality | CHF-related mortality | Infection-related mortality |
|---|---|---|---|---|
| Cox regressiona | 0.95 (0.78–1.16) | 1.26 (0.92–1.72) | 1.24 (0.77–1.99) | 0.89 (0.57–1.39) |
| PS matchingb | 0.80 (0.63–1.01) | 1.04 (0.71–1.53) | 1.27 (0.67–2.38) | 0.84 (0.49–1.45) |
| PS matching with shared frailty modelc | 0.76 (0.60–0.97) | 0.98 (0.65–1.46) | 1.25 (0.66–2.36) | 0.84 (0.49–1.46) |
| IPWd | 0.85 (0.69–1.05) | 0.83 (0.62–1.12) | 0.66 (0.42–1.04) | 0.54 (0.35–0.83) |
| PS adjustmente | 0.69 (0.57–0.83) | 0.90 (0.66–1.22) | 0.78 (0.47–1.16) | 0.58 (0.38–0.90) |
| PS stratificationf | 0.86 (0.70–1.05) | 1.13 (0.83–1.55) | 0.99 (0.62–1.59) | 0.79 (0.50–1.24) |
| Competing risk regressiong | 1.27 (0.93–1.75) | 1.20 (0.75–1.93) | 0.92 (0.60–1.43) | |
| On-treatment analysesh | 0.96 (0.73–1.25) | 1.37 (0.91–2.07) | 1.30 (0.68–2.49) | 0.51 (0.23–1.13) |
| Multiple imputation | 0.89 (0.80–0.99) | 0.99 (0.83–1.18) | 0.81 (0.62–1.05) | 0.84 (0.66–1.07) |
Values are presented as HR (95% CI).
aData were adjusted for age; sex; dialysis vintage (log-transformed); causes of ESKD; BUN; serum creatinine; serum albumin; serum albumin-corrected calcium; serum phosphate; serum intact PTH levels; history of haemorrhagic stroke, ischaemic stroke, myocardial infarction/ischaemic heart disease or limb amputation; daily urine output (log-transformed) and frequency of peritonitis (events/year) at the end of the previous year.
bSubjects were matched by the logit of propensity scores (±0.25 SD).
cDialysis facilities were treated as random effects.
dData were analysed by IPW. IPW values <1st percentile or >99th percentile were excluded.
eData were adjusted for the logit of PSs.
fData were stratified by quintiles of PSs.
gDeath from other causes was considered as a competing risk. The results reported were subhazard ratio. Data were adjusted for age; sex; dialysis vintage (log-transformed); causes of ESKD; BUN; serum creatinine; serum albumin; albumin-corrected calcium; phosphate; intact PTH levels (log-transformed); history of haemorrhagic stroke, ischaemic stroke, myocardial infarction/ischaemic heart disease or limb amputation; daily urine output (log-transformed) and frequency of peritonitis (events/year) at the end of the previous year.
hData were censored when those on PD + HD therapy transitioned completely to thrice-weekly HD. Data were analysed by Cox regression models and adjusted for age; sex; dialysis vintage (log-transformed); causes of ESKD; BUN; serum creatinine; serum albumin; albumin-corrected calcium; phosphate; intact PTH levels (log-transformed); history of haemorrhagic stroke, ischaemic stroke, myocardial infarction/ischaemic heart disease or limb amputation; daily urine output (log-transformed) and frequency of peritonitis (events/year) at the end of the previous year.
The results with p values <0.05 were shown in bold.
Association between modalities and cause-specific mortality
The number of events and incidence rates for cause-specific death are shown in Table 2. PD + HD therapy was associated with significantly lower infection-related mortality, while CV mortality and CHF-related mortality were not significantly different between PD + HD therapy and HD (Fig. 2). After adjustment for potential confounders, CV- and CHF-related mortality and infection-related mortality were similar between the two modalities (Fig. 3). By Cox regression analyses, the HR for CV-, CHF- and infection-related mortality among those on PD + HD was 1.26 (95% CI 0.92–1.72), 1.24 (95% CI 0.77–1.99) and 0.89 (95% CI 0.57–1.39), respectively, and no significant differences were detected (Table 3).
Sensitivity analyses
Sensitivity analyses by PS matching (patient characteristics were well-balanced in the PS-matched cohort but the PS-matched cohort contains more men than the cohorts used for primary analyses; Supplementary Table 2), PS matching with the shared frailty model in which dialysis facilities were treated as random effects, IPW, PS adjustment, and PS stratification yielded similar results except that PD + HD therapy was associated with significantly lower all-cause mortality by PS adjustment and PS matching with the shared frailty model and lower infection-related mortality by PS adjustment and IPW among those on PD + HD therapy (Table 3, Supplementary Fig. 2). Among the various models using PS, we considered that PS matching was most clinically relevant, as there was sufficient overlap in PS distributions among those on PD + HD therapy and those on thrice-weekly HD and patients’ characteristics were well balanced between the two groups among the PS-matched cohort. Results by PS matching were similar to those from primary analyses by Cox regression models [11]. Competing risk regression, in which death from other causes was treated as a competing risk, showed that cause-specific mortalities were not significantly different between those on PD + HD therapy and those on thrice-weekly HD. On-treatment analyses, in which only events before the transition to thrice-weekly HD for those on PD + HD therapy were considered, also demonstrated that all-cause and cause-specific death were similar between PD + HD therapy and thrice-weekly HD (Table 3). Cox regression analyses after multiple imputation showed that PD + HD therapy was associated with marginally lower all-cause mortality while cause-specific mortalities were not significantly different.
Subgroup analyses
Associations between PD + HD therapy and all-cause and cause-specific mortality were similar across age, sex, aetiology of ESKD, daily urine volume and PD vintage before transition (Fig. 4).
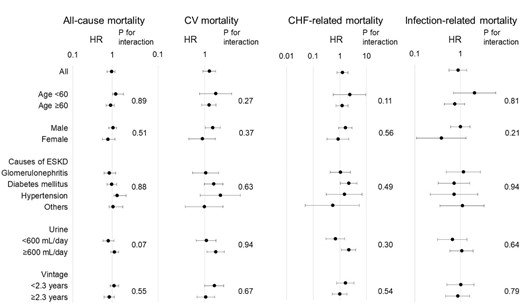
Subgroup analyses. The cut-off points for daily urine output and PD vintage were the median of these values.
Association between modalities and changes in phosphate or intact PTH levels
BUN or creatinine levels were important indicators of solute clearance among dialysis patients. However, it was unclear when these values were measured in relation to the timing of HD among those on PD + HD therapy. As such, the changes in phosphate or intact PTH levels after modality changes were examined as indicators of solute clearance. The changes in phosphate and intact PTH levels among the PS-matched cohort were similar between HD and PD + HD therapy, while albumin-corrected calcium levels were higher among those on PD + HD therapy (Supplementary Fig. 3).
DISCUSSION
In this study we demonstrated that all-cause and cause-specific mortality were not significantly different among those on PD + HD therapy and thrice-weekly HD in the largest cohort of patients on PD + HD therapy to our knowledge.
Comparison of outcomes between PD + HD therapy and thrice-weekly HD was quite limited. So far studies on PD + HD therapy have mainly focused on comparison of the status of PD alone and after transition to PD + HD therapy [2–7] or comparison of PD alone and PD + HD therapy [8, 9]. One study described the outcomes of 47 patients who transitioned to PD + HD therapy and 35 patients who transitioned to thrice-weekly HD from PD [12]. In this study, only six patients died during the study period and the difference in all-cause mortality between the two modalities was unclear. Another study from Taiwan compared the outcomes between combined PD and HD therapy and thrice-weekly HD [13]. That study showed that all-cause admission and mortality were not significantly different between the two modalities [adjusted HR 1.06 (95% CI 0.95–1.19) and 1.02 (95% CI 0.80–1.30), respectively]. The results were consistent with our findings. However, in that study, combined therapy was a combination of PD and two to four sessions per month of HD, and the data were old (from 2000 to 2010). Moreover, residual kidney function or markers of nutritional status such as albumin levels, which are important predictors of mortality among dialysis patients, were not considered. Another problem is that more than half of patients on combined therapy transitioned to thrice-weekly HD within 1 year. The lack of a difference in outcomes could be due to the short duration of combined therapy. Compared with that study, we included a more contemporary cohort, the median time on PD + HD therapy was longer (2 years), the data were adjusted for daily urine output and albumin levels and multiple sensitivity analyses were performed, including on-treatment analyses. Infection-related mortality seemed to be lower among those on PD + HD therapy in the adjusted Kaplan–Meier curve. Moreover, some of the sensitivity analyses showed that infection-related mortality was significantly lower among those on PD + HD therapy. Those on PD + HD therapy had higher albumin and creatinine levels and had experienced peritonitis less frequently in the past. These findings might represent better nutritional status, immune function and personal hygiene, which might not be completely accounted for by covariates adjustment. Alternatively, those on PD + HD therapy attended fewer HD sessions and had a lower chance of infection during a pandemic of contagious diseases [14].
The clinical implication of our results is that PD + HD therapy could be a great option for patients with ESKD, considering the similar mortality. PD is consistently associated with a higher employment rate compared with HD [15–18]. One study showed that the employment rate was 63.9% for those on PD + HD therapy whereas it was 53.4% for those on HD [18]. However, only 36 subjects on PD + HD therapy and 103 subjects on HD were included, and it is hard to draw a definite conclusion. However, all these data suggest the possibility that the employment rate is higher among those on PD + HD, as they can perform PD at home 5 days/week while working during the daytime. There is a possibility that PD + HD therapy provides socio-economic benefits both for patients and society. Also, lifestyle is more flexible with PD + HD therapy compared with thrice-weekly HD. Health-related quality of life as measured by the 36-item Short Form Health Survey, especially the role/social component summary, was higher among those on PD + HD therapy compared with those on thrice-weekly HD [18].
The strength of our study is that, to our knowledge, this is by far the largest cohort of PD + HD therapy patients. We made efforts to eliminate selection biases. A recent study demonstrated that the reasons for transfer from PD to PD + HD and for transfer from PD to thrice-weekly HD are different [19], which could be confounders for mortality. More patients transferred to HD due to peritonitis and more patients transferred to PD + HD due to inadequate fluid and solute clearance. We adjusted for the number of peritonitis events or daily urine output and incorporated these variables in the PS calculation. Also, the study showed that there was a wide range of rates of transfer to PD + HD therapy or thrice-weekly HD by facilities. We considered the effects of facilities in the shared frailty models. We also performed multiple sensitivity analyses to confirm the results. Although some of the sensitivity analyses showed inconsistent results, we could argue that PD + HD therapy is at least no worse than thrice-weekly HD in terms of mortality.
The study has several limitations. As this is an observational study, there is the possibility of residual confounders. For example, the above-mentioned study [19] also showed that more patients transfer to thrice-weekly HD due to psychosocial problems, which could not be accounted for by available variables in the JRDR. No data are available in the JRDR database on the reasons to change from PD to PD + HD therapy or from PD to thrice-weekly HD. Also, the JRDR collects data at the end of each year. As a result, the exact dates for modality change or the data just before modality change were not available. There may have been a change in the patient’s condition between the end of the preceding year and the time of modality change. Also, a large number of patients were excluded due to missing data. Included patients had higher daily urine output than excluded patients. However, there were no effect modifications by urine output for the association between PD + HD therapy and mortality. Moreover, analyses after multiple imputation showed similar results to the primary analyses. As this study only included Japanese dialysis patients, generalizability to dialysis populations in other parts of the world is unclear.
In conclusion, all-cause and cause-specific mortality were not significantly different between PD + HD therapy and thrice-weekly HD. Considering a flexible lifestyle and health-related quality of life, PD + HD therapy could be a great option for patients with ESKD.
ACKNOWLEDGEMENTS
Part of results of this study were presented as an abstract at the World Congress of Nephrology in 2022 and the annual meeting of the Japanese Society for Dialysis Therapy in 2022. The opinions reflected in this article are those of the authors alone and do not reflect an official position of JSDT.
FUNDING
None declared.
AUTHORS’ CONTRIBUTIONS
M.M. was responsible for the conception and design of the study, data analysis, interpretation of the data and drafting the manuscript. T.H. was responsible for the interpretation of data. T.H., M.A. and I.M. were responsible for review and approval of the final manuscript.
DATA AVAILABILITY STATEMENT
The dataset used in this study is not publicly available due to restrictions by the Japanese Society for Dialysis Therapy.
CONFLICT OF INTEREST STATEMENT
None declared.


Comments
We’ve read with interest the article by Murashima M et al [1], comparing the mortality outcomes of 2031 subjects transitioning from peritoneal dialysis (PD) to thrice-weekly heamodialysis (HD) and of 1001 patients transitioning to PD + once-weekly HD.
After a median follow-up of 3,5 years the two groups did not differ for all-cause, cardiovascular, heart failure-related and infections-related mortality.
These findings, derived from a large cohort of dialysis patients, appear as solid and promising, giving nephrologists more safe options to manage the transition PD-HD when the patient comes close to drop-out from PD.
In their article, the Authors also state that the combination PD + once-weekly HD may be beneficial in terms of Quality of life (QoL) in comparison to thrice-weekly HD. However, this seems to be inferred by the results of another study by Tanaka et al [2], evaluating health-related QoL as measured by the 36-item Short form Health survey in a small sample of patients (36 PD + HD, 103 HD, 90 PD). No survey data regarding the study sample by Murashima et al. are reported.
Another issue concerning the QoL of the subgroup PD + once-weekly HD derives from the lack of information about the type of vascular access used to perform HD.
If the vascular access was a central venous catheter (CVC) instead of an artero-venous fistula, this means that the patients (how many?) of this group carried out their life having two catheters, the CVC and the peritoneal catheter. It seems hard to quickly conclude that this could have no significant impact on QoL. The Authors base their conclusions about QoL on the article by Tanaka et al [2], which as well does not report data on vascular access.
Another point, closely related to the previous one, regards infections. Infection-related mortality was not statistically different comparing PD + once-weekly HD vs thrice-weekly HD, a very good result. But again, focusing on QoL, there are no data about non-fatal infections, which may be more frequent in patients on combination therapy (due to the presence of peritoneal catheter), as well as they may be even more frequent in patients with two catheters (peritoneal and CVC); this may have an impact on QoL in terms of days with fever, need for antibiotic treatment and related complications.
Concluding, we appreciate the work by Murashima et al [1], which provides reassuring findings about the mortality outcomes of patients combining PD + HD, but some issues regarding QoL probably deserve further investigation and clarification.
References
1. Murashima M, Hamano T, Abe M et al. Comparable outcomes between a combination of peritoneal dialysis with once-weekly heamodialysis and thrice-weekly heamodialysis: a prospective cohort study. Nephrol Dial Transplant 2023; https://doi.org/10.1093/ndt/gfad019
2. Tanaka M, Ishibashi Y, Hamasaki Y et al. Health-related quality of life on combination therapy with peritoneal dialysis and hemodialysis in comparison with hemodialysis and peritoneal dialysis: a cross-sectional study. Perit Dial Int 2020;40:462–9.