


ABSTRACT
One of the challenges in living kidney donor screening is to estimate remaining kidney function after donation. Here we developed a new model to predict post-donation measured glomerular filtration rate (mGFR) from pre-donation serum creatinine, age and sex.
In the prospective development cohort (TransplantLines, n = 511), several prediction models were constructed and tested for accuracy, precision and predictive capacity for short- and long-term post-donation 125I-iothalamate mGFR. The model with optimal performance was further tested in specific high-risk subgroups (pre-donation eGFR <90 mL/min/1.73 m2, a declining 5-year post-donation mGFR slope or age >65 years) and validated in internal (n = 509) and external (Mayo Clinic, n = 1087) cohorts.
In the development cohort, pre-donation estimated GFR (eGFR) was 86 ± 14 mL/min/1.73 m2 and post-donation mGFR was 64 ± 11 mL/min/1.73 m2. Donors with a pre-donation eGFR ≥90 mL/min/1.73 m2 (present in 43%) had a mean post-donation mGFR of 69 ± 10 mL/min/1.73 m2 and 5% of these donors reached an mGFR <55 mL/min/1.73 m2. A model using pre-donation serum creatinine, age and sex performed optimally, predicting mGFR with good accuracy (mean bias 2.56 mL/min/1.73 m2, R2 = 0.29, root mean square error = 11.61) and precision [bias interquartile range (IQR) 14 mL/min/1.73 m2] in the external validation cohort. This model also performed well in donors with pre-donation eGFR <90 mL/min/1.73 m2 [bias 0.35 mL/min/1.73 m2 (IQR 10)], in donors with a negative post-donation mGFR slope [bias 4.75 mL/min/1.73 m2 (IQR 13)] and in donors >65 years of age [bias 0.003 mL/min/1.73 m2 (IQR 9)].
We developed a novel post-donation mGFR prediction model based on pre-donation serum creatinine, age and sex.

What is already known about this subject?
Estimated glomerular filtration rate (eGFR) equations are imprecise to assess the true or measured GFR (mGFR) in the higher range and in donor candidates.
The average post-donation GFR is 66–70% of its pre-donation value, but it is unclear if pre-donation estimated GFR can be used to predict post-donation mGFR.
What this study adds?
We developed a novel post-donation mGFR prediction model based on pre-donation serum creatinine, age, and sex.
What impact this may have on practice or policy?
This model allows a more accurate and precise prediction of post-donation mGFR and may be useful in the selection of living kidney donors.
INTRODUCTION
Kidney transplantation is the preferred treatment for most end-stage kidney disease (ESKD) patients, and living donors increasingly contribute to many kidney transplantation programs [1, 2]. In recent years, living kidney donor selection practices have been liberalized to compensate for donor shortages [3]. At the same time, it remains essential to optimally assess pre-donation kidney function and the impact of kidney donation on long-term kidney function in living donors. Estimated glomerular filtration rate (eGFR) equations, most widely used to assess kidney function, are imprecise to assess the true or measured GFR (mGFR) in the higher range and in donor candidates [4, 5]. Measuring the clearance of exogenous filtration markers such as iothalamate or iohexol is more precise, but also technically challenging, expensive, time-consuming and not widely available [4, 6]. Current guidelines for living kidney donation advise to accept healthy donors with an eGFR ≥90 mL/min/1.73 m2 and, if eGFR is lower, to individualize the decision based on demographic and health profiles in relation to the transplant program's threshold for acceptable risk [7]. However, little guidance is available on how to assess individualized risks.
The need of more precise, but simple, GFR evaluation tests that optimize the selection process has been underlined recently [8]. Some studies have attempted to address this issue by providing age-calibrated pre-donation GFR thresholds [9], but so far the only avaliable data suggest pre-donation eGFR thresholds based on cross-sectional analyses of mGFR in healthy non-donors, i.e. without taking the effect of donor nephrectomy into account [10, 11], and no studies have addressed the predictive value of pre-donation eGFR for post-donation mGFR. The average post-donation GFR is 66–70% of its pre-donation value [12], but it is unclear if pre-donation eGFR can be used at all to predict post-donation mGFR. Therefore, in the current study, we demonstrated which post-donation values were achieved for different pre-donation eGFR thresholds and used pre-donation serum creatinine and other widely available parameters to develop a predictive model for short-term post-donation mGFR. The performance of the model was validated in two independent cohorts of living kidney donors. We also tested the long-term performance of the predictive model, the performance in donors with a pre-donation eGFR <90 mL/min/1.73 m2 and the performance in donors with negative post-donation mGFR slope.
MATERIALS AND METHODS
Study design and population (development and internal validation cohorts)
An overview of the design of our study is provided in Fig. 1. In this prospective cohort study, we performed mGFR measurements in 1020 living kidney donors who donated between 1984 and 2018 in the University Medical Center Groningen (UMCG), Groningen, The Netherlands. For the development cohort and internal validation cohort, we used data from the TransplantLines Biobank and Cohort Study (ClinicalTrials.gov identifier: NCT03272841) at the UMCG. This is an observational study that aims to provide a better understanding of the causes of disease-related and ageing-related outcomes and health problems, both physical and psychological, in solid organ transplant recipients and donors. All participants gave written informed consent on enrollment. A detailed description of the study design and inclusion and exclusion criteria has been described previously [8]. We measured mGFR at 4 months before donation and at 3 months after living kidney donation, all as part of the screening program and post-donation evaluation. Donors were randomly assigned to a development cohort (n = 511) and an internal validation cohort (n = 509) for analysis of pre-donation parameters and post-donation mGFR. A subgroup of 409 donors had mGFR measurements at 5 years post-donation available and a subgroup of 110 donors at 10 years post-donation. The study was approved by the institutional ethical review board (METc 2014/077). All procedures were conducted in accordance with the Declaration of Helsinki and the Declaration of Istanbul.
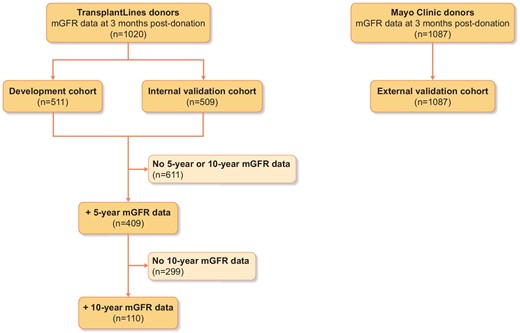
Overview of the study design and distribution of study participants.
As a result of our donor selection criteria, all donors were normotensive or had an adequately regulated blood pressure while taking no more than two antihypertensive drugs. Individuals with a history of diabetes (or an abnormal glucose tolerance test), kidney disease or cardiovascular events were not allowed to donate. Any other condition that was considered a potential threat to long-term renal or cardiovascular outcome was considered a contraindication for donation, at the discretion of the nephrologist involved in the selection procedure. Acceptance policies of living kidney donors in the UMCG are based on the Dutch Living Kidney Donor Guidelines [13], which are based on international guidelines [7, 14].
Laboratory measurements
Serum creatinine was measured routinely in our central chemistry laboratory by an isotope dilution mass spectrometry (IDMS)-traceable enzymatic assay on the Roche Modular analyser (Roche, Mannheim, Germany) from 1 March 2006 onwards. Before this date, samples were measured by Jaffe alkaline picrate assay on the Merck Mega Analyzer (Merck, Darmstadt, Germany). Values obtained by the Jaffe method were converted to allow comparison with the Roche method by the formula (YRoche (µmol/L) = (XJaffe (µmol/L) – 8)/1.07) [16]. To make sure that this conversion would not influence our results, we separated the analyses into the group that donated before 2006 and the group that donated after 2006 and observed no discrepancies between the two groups nor compared with the total cohort (Supplementary data, Table S1). Creatinine clearance was calculated from the 24-h urine collected the day before the measurements.
Kidney function measurements
External validation cohort (Mayo Clinic)
For external validation, we used a cohort of 1087 donors from the living kidney donor program of the Mayo Clinic Transplant Center, Rochester, MN, USA. In 1094 donors who donated between 2000 and 2015, the eGFR (using standardized levels of serum creatinine) was obtained prior to donation and mGFR was measured a mean of 6 months after donation. Patients were studied in the fasting (≥4 h) state but were encouraged to keep well hydrated with oral intake of water. An equilibration period of 60 min following the subcutaneous injection of iothalamate contrast was allowed, after which urinary clearances of iothalamate were determined by urine collection over 45–60 min and blood sampling at the beginning and end of that period [15]. Ultrasonographic bladder scanning was performed to ensure complete bladder emptying after all urine collections. Bladder catheterization was performed if residual urine was detected.
Statistical analyses
Data are reported as mean [standard deviation (SD)] for normally distributed variables and median [interquartile range (IQR)] for skewed data. Binary variables are shown as number (%). Post-donation mGFR was indexed for body surface area in all analyses.
Because eGFR is currently most widely used in donor screening for the prediction of post-donation GFR, we first performed descriptive analyses showing which post-donation mGFR values were achieved for the eGFR thresholds of ≥60, ≥70, ≥80, ≥90 and ≥ 100 mL/min/1.73 m2. The same pre-donation eGFR thresholds were subsequently applied to the external replication (Mayo Clinic) cohort and achieved post-donation mGFR values were calculated and compared with the TransplantLines cohort findings. We then replicated these analyses in the subgroups of 409 and 110 donors with 5- and 10-year follow-up in the TransplantLines cohort.
Next we used univariable and multivariable linear regression analyses to assess the relationship between pre-donation serum creatinine and post-donation mGFR, adjusting for potential confounders including age, sex and body mass index. Several transformations of pre-donation serum creatinine and/or post-donation mGFR were explored, including square root, inverse, logarithmic, and natural logarithmic transformations, in order to account for potential non-linear associations. For the development of the multivariable model we used a backward approach using the variables with P < .2 upon univariable analysis and the variables that were likely to be confounders. This model was subsequently tested in a stepwise forward approach. The final model was used to develop an equation that predicts post-donation mGFR in the development cohort. In order to compare the model to current clinical practice, we developed a basic equation estimating post-donation mGFR as 66% of pre-donation eGFR (defined as the ‘reference equation’) [12]. The accuracy and precision of both models were assessed in the internal and external validation cohorts. Accuracy was assessed by calculating the mean bias, the model R2, the root mean square error (RMSE) and the mean percentage bias. Precision was assessed by calculating the IQR of the bias. Furthermore, the percentages of predicted mGFR values within 30% and 10% of the true mGFR value were calculated (P30 and P10, respectively). Because mGFR is the gold standard, we also tested the accuracy and precision of the best model including pre-donation mGFR instead of serum creatinine.
Finally, several sensitivity analyses were performed to focus on donors at high risk of a lower mGFR post-donation. First, the accuracy and precision of the optimal model were calculated in a subgroup analysis of donors with a pre-donation eGFR <90 mL/min/1.73 m2. Second, we identified a subgroup of donors with progressive mGFR loss during longitudinal follow-up. The accuracy and precision of the optimal model were also calculated in this subgroup. Then, since donor age has been increasing over the past years and is likely to continue to increase [19], we assessed the accuracy and precision of the optimal model in a subgroup containing only donors ≥65 years of age. Lastly, we calculated how many donors that reached a post-donation mGFR <50 mL/min/1.73 m2 or <60 mL/min/1.73 m2 also had a predicted post-donation mGFR below those thresholds according to equation C and the optimal model. We subsequently calculated the area under the curve (AUC) for model C and the optimal model to predict a post-donation mGFR <60 mL/min/1.73 m2. Statistical analyses were performed in SPSS for Windows version 23 (IBM, Armonk, NY), R version 3.0.1 (R Foundation for Statistical Computing, Vienna, Austria) and GraphPad Prism 6 for Windows (GraphPad Software, San Diego, CA, USA). P-values <.05 were considered statistically significant.
RESULTS
Characteristics of the development, internal and external validation cohorts
Baseline characteristics of the development and internal validation cohorts (TransplantLines) and external validation cohort (Mayo Clinic) are shown in Table 1. The development cohort consisted of 511 living kidney donors (mean pre-donation eGFR 86 ± 14 mL/min/1.73 m2). The internal validation cohort consisted of 509 living kidney donors [mean pre-donation eGFR 88 ± 14 mL/min/1.73 m2 (P = .03 versus development cohort)]. The external validation cohort consisted of 1094 living kidney donors [mean pre-donation eGFR 89 ± 15 mL/min/1.73 m2 (P < .001 versus development cohort)]. Baseline characteristics of the subgroups of donors with 5- and 10-year mGFR follow-up available are shown in Supplementary data, Table S2.
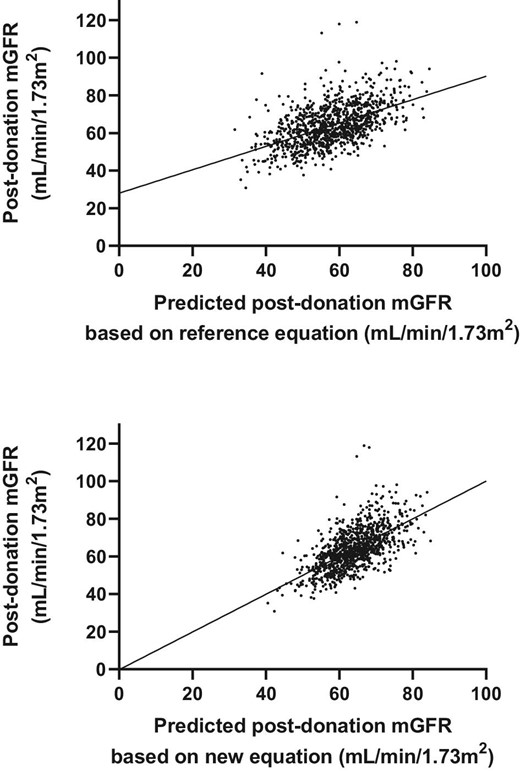
Associations between predicted mGFR and true mGFR by model C (upper figure) and equation 3 (lower figure) in the internal validation cohort.
Characteristics of donors in the development and internal validation cohort (TransplantLines) and external validation cohort (Mayo) before and after donation
| Development cohort | Internal validation cohort | External validation cohort (Mayo) | ||||
|---|---|---|---|---|---|---|
| Variable | Pre-donation | Post-donation | Pre-donation | Post-donation | Pre-donation | Post-donation |
| Number | 511 | 511 | 509 | 509 | 1094 | 1094 |
| Age (years) | 53 (11) | 53 (11) | 53 (11) | 53 (11) | 45 (12) | 46 (12) |
| Sex (male), n (%) | 250 (49) | 246 (48) | 438 (40) | 438 (40) | ||
| Weight (kg) | 80 (13) | 79 (13) | 80 (14) | 80 (14) | 81 (16) | 81 (17) |
| Length (cm) | 175 (9) | 174 (9) | 175 (10) | 175 (10) | 171 (9) | 171 (9) |
| Body mass index (kg/m2) | 26 (3) | 26 (3) | 26 (4) | 26 (4) | 28 (5) | 28 (5) |
| Body surface area (m2) | 1.95 (0.19) | 1.94 (0.19) | 1.96 (0.20) | 1.95 (0.20) | 1.93 (0.22) | 1.93 (0.22) |
| mGFR (mL/min/1.73 m2) | 101 (15) | 64 (11) | 101 (17) | 64 (11) | 102 (18) | 66 (13) |
| eGFRCKD-EPI (mL/min/1.73 m2) | 86 (14) | 57 (12) | 88 (14) | 57 (12) | 89 (15) | 58 (12) |
| Systolic blood pressure (mmHg) | 126 (13) | 124 (12) | 127 (13) | 124 (12) | 120 (15) | 119 (14) |
| Diastolic blood pressure (mmHg) | 75 (9) | 76 (8) | 76 (8) | 76 (9) | 73 (9) | 72 (9) |
| Proteinuria (g/24 h), median (IQR) | 0.00 (0.00–0.00) | 0.00 (0.00–0.00) | 0.00 (0.00–0.00) | 0.00 (0.00–0.00) | 0.04 (0.03–0.06) | 0.06 (0.04–0.09) |
| Serum creatinine (µmol/L) | 79 (14) | 114 (21) | 77 (14) | 114 (22) | 79 (14) | 112 (34) |
Values presented a mean (SD) unless stated otherwise. mGFR by iothalamate clearance; eGFR using the Chronic Kidney Disease Epidemiology Collaboration equation.
Pre-donation eGFR and post-donation mGFR in the development and internal validation cohort
Because eGFR is currently most widely used for the prediction of post-donation GFR, we first illustrated which post-donation mGFR values were achieved for different pre-donation eGFR thresholds in the development + internal validation cohort and in the external validation cohort (Supplementary data, Table S3). A pre-donation eGFR ≥60 mL/min/1.73 m2, present in 98% of the donors, led to a mean post-donation mGFR of 64 ± 11 mL/min/1.73 m2 and to an mGFR >48 mL/min/1.73 m2 in 95% of donors in the development and internal validation cohorts. Donors with a pre-donation eGFR ≥100 mL/min/1.73 m2 (18%) had a mean post-donation mGFR of 73 ± 9 mL/min/1.73 m2, but 5% of these donors reached a post-donation mGFR <59 mL/min/1.73 m2, despite the high pre-donation eGFR. The eGFR thresholds were also tested in the external validation cohort (Supplementary data, Table S3). Here, a pre-donation eGFR ≥100 mL/min/1.73 m2, present in 24% of the donors, led to an mGFR <56 mL/min/1.73 m2 in 5% of donors (Supplementary data, Table S3). Thus there is a group of donors that has a pre- to post-donation decrease in GFR of >40%, despite high pre-donation eGFR, which indicates that eGFR alone might not be sufficient to predict post-donation GFR. Results were similar in a subgroup of 409 TransplantLines donors with 5-year mGFR-based follow-up and a subgroup of 110 TransplantLines donors with 10-year mGFR-based follow-up (Supplementary data, Table S4). We also calculated mean post-donation mGFR values for similar pre-donation mGFR thresholds (Supplementary data, Table S5). Although more donors achieved the pre-donation mGFR thresholds, the mean 3-month post-donation mGFR and the first and fifth percentiles of post-donation mGFR were comparable.
Development of the mGFR prediction model
Multivariable linear regression model of mGFR at 3 months post-donation in the development cohort
| Variables | β | P-value | |
|---|---|---|---|
| Final model (R2 = 0.38) | Serum creatinine | –0.42 | <.001 |
| Age | –0.53 | <.001 | |
| Female sex | –0.25 | <.001 |
| Variables | β | P-value | |
|---|---|---|---|
| Final model (R2 = 0.38) | Serum creatinine | –0.42 | <.001 |
| Age | –0.53 | <.001 | |
| Female sex | –0.25 | <.001 |
Outcome: 3 months post-donation mGFR.
Performance of various models for predicting post-donation mGFR in the development, internal validation and external validation cohorts
| Development cohort | Internal validation TransplantLines | External validation Mayo Clinic | |
|---|---|---|---|
| (n = 511) | (n = 509) | (n = 1087) | |
| Reference equation (0.66*eGFR) | |||
| R2 | 0.26 | 0.30 | 0.20 |
| RMSE | 9.80 | 9.74 | 14.57 |
| Mean bias | 7.05 | 5.37 | 7.22 |
| Mean percentage bias | 9.87 | 7.14 | 8.56 |
| IQR bias | 0.19–13.31 | –1.09–11.19 | –0.97–14.30 |
| P30 | 93 | 95 | 89 |
| P10 | 43 | 48 | 49 |
| New equation (SCr, age, sex) | |||
| R2 | 0.38 | 0.41 | 0.29 |
| RMSE | 8.29 | 8.45 | 11.61 |
| Mean bias | 0.41 | -0.51 | 2.56 |
| Mean percentage bias | 0.97 | 2.50 | 1.07 |
| IQR bias | –5.24–5.32 | –6.00–4.22 | –4.88–9.14 |
| P30 | 98 | 96 | 93 |
| P10 | 58 | 60 | 47 |
A negative bias indicates an overestimation of post-donation mGFR, a positive bias indicates underestimation.
SCr, serum creatinine.
Internal and external validation of the living donor prediction models
Performance of the models was subsequently analysed in the internal and external validation cohorts (Table 3). In the internal validation cohort, the new equation showed better accuracy (mean bias –0.51 mL/min/1.73 m2; indication of an overestimation of post-donation mGFR) and precision (bias IQR –6.00–4.22 mL/min/1.73 m2), similar to the development cohort. In the external validation cohort, the equations showed higher RMSE, mean bias and bias IQR as compared with the other cohorts, with the new equation showing the lowest RMSE (11.61 mL/min/1.73 m2), the best precision (bias IQR –4.88–9.14 mL/min/1.73 m2) and the best accuracy (mean bias 2.56 mL/min/1.73 m2).
Sensitivity analyses
Both equations from the main analyses were tested in a subgroup of donors with a pre-donation eGFR <90 mL/min/1.73 m2 (Supplementary data, Table S13). In the development cohort, the new equation (serum creatinine, age, sex) had the lowest bias compared with the reference equation (0.35 versus 9.65 mL/min/1.73 m2, respectively) and bias IQR (–5.21–5.12 mL/min/1.73 m2 versus 3.18–16.58 mL/min/1.73 m2, respectively). Similar results were obtained in the internal and external validation cohorts.
In donors with a negative post-donation GFR slope (declining mGFR between 3 months and 5 years post-donation, mean decline −4.79 mL/min, n = 137), the new equation still had good accuracy (mean bias 4.75 mL/min/1.73 m2, 5%) and precision (bias IQR 13 mL/min/1.73 m2) in the internal validation cohort [R2 was 0.01 lower (0.37)], compared with the main analyses.
In a subgroup of donors ≥65 years of age (n = 129), the new equation had a low mean bias of 0.003 mL/min/1.73 m2 and a bias IQR of 9 mL/min/1.73 m2 in the internal validation cohort.
Donors with low post-donation mGFR
Of all 1020 donors, 376 reached a 3-month post-donation mGFR <60 mL/min/1.73 m2. From these donors, 310 (82%) also had a predicted mGFR <60 mL/min/1.73 m2 according to the reference equation. The new equation predicted an mGFR <60 mL/min/1.73 m2 in 213 (57%) of these donors. The AUC to predict a post-donation mGFR <60 mL/min/1.73 m2 was 75% for the reference equation and 82% for the new equation. A 3-month post-donation mGFR <50 mL/min/1.73 m2 occurred in 85 donors. The reference equation predicted a 3-month post-donation mGFR <50 mL/min/1.73 m2 in 55 (65%) of these donors, while the new equation only predicted a 3-month post-donation mGFR <50 mL/min/1.73 m2 in 15 (18%) of these donors. These differences can be explained by Fig. 2, in which equation 3 clearly has higher accuracy but shows an overall shift to the right, resulting in higher predicted post-donation mGFR values. The 66 donors in which post-donation mGFR was incorrectly classified as >60 mL/min/1.73 m2 were significantly younger [54 (SD 10) years versus 60 (SD 8) years; P < .001] than donors in whom post-donation mGFR was correctly classified as <60 mL/min/1.73 m2.
DISCUSSION
In this study we show that the prediction of post-donation mGFR improved by using pre-donation serum creatinine, age and sex compared with using only pre-donation eGFR in a Dutch and US cohort of living kidney donors. We developed models that predict short-term post-donation mGFR more accurately and precisely than eGFR alone. The models especially decreased the underestimation of post-donation mGFR. These data can be used to make individualized decisions in donor selection, using pre-donation eGFR without confirmatory testing. Yet, for donors with low pre-donation eGFR, especially young and tall donors, confirmatory testing using a reference method remains necessary.
The need for simple tests that evaluate pre-donation eGFR for the purpose of predicting post-donation mGFR has been highlighted recently [8]. We show that donors with high pre-donation GFR generally have favorable short- and long-term post-donation mGFR. Yet despite the favorable pre-donation GFR, a minority of the donors lose >33% or even >50% of the pre-donation GFR value, indicating that pre-donation GFR alone is not sufficient to predict post-donation mGFR. We show that the accuracy and precision of mGFR prediction can be substantially improved in kidney donors in four models using these additional variables. The models led to less underestimation of post-donation mGFR, which could result in less unjustified rejection of potential donors or less necessity of confirmatory testing. The model developed in this study was validated internally and externally and strongly outperformed the basic model of 66% of pre-donation eGFR (reference model), but showed a somewhat weaker performance in external validation (yet still low bias of <2 mL/min). Also, the new model performed better in donors with a pre-donation eGFR <90 mL/min/1.73 m2 and in long-term follow-up of donors with progressive kidney function loss after nephrectomy. However, due to systematic overestimation of post-donation mGFR in the lowest range, the model cannot replace confirmatory testing in donors with low pre-donation eGFR, especially in young donors. This is also the case for the reference model, and therefore it is highly important for future studies to investigate which donors benefit from confirmatory testing. A lack of donors with low post-donation mGFR hampers the development of accurate and precise prediction equations in these ranges. These data are in line with other studies proposing the prediction of age-dependent eGFR thresholds in kidney donation [9, 20]. While the model containing pre-donation serum creatinine, age and sex outperformed pre-donation eGFR alone, the model containing pre-donation mGFR and age explained ∼20% more of the variance in post-donation mGFR than the model based on pre-donation serum creatinine, age and sex. Therefore mGFR still seems the most accurate method for post-donation GFR prediction. When not available, the new model containing pre-donation serum creatinine, age and sex might be a suitable alternative.
To further ascertain long-term renal risks, we repeated our analyses of pre-donation eGFR on long-term post-donation mGFR (5 and 10 years after donation) in a subgroup of donors with available data. Although the numbers were smaller, the prediction model mostly remained similar, indicating that the equations from our models can generally be used for donor screening. It should be noted, however, that while overall the bias of the models was positive (indicating underestimation of 5-year mGFR), the bias was negative for donors with progressive kidney function loss after donation (indicating overestimation of mGFR). This means that the models might be less suitable to detect donors at risk for kidney function loss after kidney donation, although the overestimation was minor. This is in line with other longitudinal studies on kidney function predictions in kidney patients and living kidney donors: an acceptable performance at the group level, but unable to identify the minority with rapid renal function loss [21] and living kidney donors [22].
Our study can be used in addition to the current donor guideline in donor selection. We propose to individually define a desired post-donation mGFR based on donor risk factors including age, ethnicity and the potential presence of comorbidities [7, 23–27], which could be subsequently translated into an individualized minimum pre-donation eGFR based on the current study. Available donor risk calculators (e.g. www.transplantmodels.com/esrdrisk) can aid with this decision. Donors with an eGFR that will lead to an acceptable post-donation mGFR (e.g. >45 mL/min/1.73 m2 in a female of 55 years old, based on the lowest reference range for this age and sex [27]) and that do not have contra–indications for donation could be accepted without confirmatory GFR testing. However, caution should be exercised with young or tall donors with low pre-donation eGFR, who might benefit from confirmatory GFR testing. When a very high confidence level and a higher post-donation mGFR are desired, e.g. in younger candidates, only a small percentage of donors have a sufficiently high pre-donation eGFR to be accepted without a confirmatory test. Therefore, measured GFR is still necessary in most of these candidates. Also, in donors at risk for kidney function loss after kidney donation, a confirmatory test is necessary.
A recently published study with pre-donation mGFR measurements in a large number of French donors confirms that the use of eGFR alone may lead to unnecessary rejection of donors [28]. Our study confirms these findings: when a high post-donation mGFR is desired, this comes at the cost of fewer accepted living kidney donors based on eGFR. It should be noted that the current analyses do not take into account long-term adaptive hyperfiltration and the potential development of new-onset kidney disease. Adaptive hyperfiltration can cause GFR to increase up to 10 years after donation and donor chronic kidney disease (CKD) generally develops later after donation and cannot be predicted at a young age [29–32]. We too observe this in an additional analysis in donors with 5- and 10-year mGFR-based follow-up available. At 5- and 10-years after donation, the mGFR remained stable or increased in most donors, indicating that using the short-term post-donation mGFR might be too conservative for living kidney donor screening. However, in donors with decreasing kidney function, our models showed an overestimation of kidney function. Also, donor comorbidities, CKD risk factors and other factors relevant for the donation-attributable risk should be considered, in particular obesity, as this can elicit maladaptive hyperfiltration and contribute to long-term kidney damage in donors [7, 23–27].
Based on the current state of literature and living donor guidelines, the mGFR is the preferred confirmatory test [26], but it may be expensive and laborious and may vary depending on the method used [35]. Creatinine clearance may be a reasonable alternative: although 24-h urine collection is hampered by sampling errors leading to poor precision, repeated collections may increase its precision and make it a viable confirmatory test [36]. Cystatin-based eGFR has also been proposed as a confirmatory test, but it is considerably less precise in most cases [37, 38]. Further research is necessary to find the best (combination of) tests for confirmation of kidney function if eGFR is below the threshold. By implementing our model of eGFR, age and sex in the selection of living kidney donors, the living donor pool can be extended in centres that do not have mGFR available [26]. Recently the British Transplant Society published a recommendation for (measured) GFR thresholds that can be used when a donor requires confirmatory testing [14].
The strengths of this study include the large number of donors with extensive renal hemodynamic measurements with continuous infusion of 125I-iothalamate and the longitudinal design with 5- and 10-year mGFR-based follow-up in a subgroup of donors. Furthermore, we validated the predictive capacity of pre-donation eGFR in an internal validation cohort and an external validation cohort (Mayo Clinic). Limitations of this study include the absence of non-Caucasian donors in both cohorts and the paucity of data on the very young (age <30 years) and old (>75 years), limiting external validity. Recently a new Chronic Kidney Disease Epidemiology Collaboration equation has been proposed that does not include race [39]. Because of the absence of non-Caucasian donors, we were unable to test this equation in our cohort. Inherent to the donor screening program, older donors were more susceptible to selection bias towards better renal function (and general health), particularly since we only included donors that were accepted for donation. Therefore we are unable to draw conclusions on donors who should be rejected without the use of a confirmatory test.
In conclusion, using two large cohorts of living kidney donors with mGFR before and after donation, we developed a model using a prediction model that includes pre-donation serum creatinine, age and sex for the prediction of post-donation mGFR during donor screening. This model may be used to identify donors who can be accepted without requiring mGFR confirmation.
ACKNOWLEDGEMENTS
The authors greatly acknowledge all living kidney donors who participated in this study and also appreciate the help of R. Karsten-Barelds, D. Hesseling-Swaving, and M.C. Vroom-Dallinga during the study measurements.
FUNDING
M.H.d.B. is supported by a Veni grant from the Dutch Organization for Scientific Research (016.146.014). A.D.R. and A.F.M. were supported with funding from the National Institutes of Health, National Institute of Diabetes and Digestive and Kidney Diseases (R01 DK090358).
AUTHORS’ CONTRIBUTIONS
M.v.L., J.v.d.W., A.D.R. and M.H.d.B. conceived and designed the study. M.v.L., J.v.d.W., S.J.L.B., S.P.B., J.S.F.S., G.N., A.D.R. and M.H.d.B. were responsible for data acquisition. M.v.L., J.v.d.W., R.S.N., A.F.M., S.J.L.B., S.P.B., J.S.F.S., G.N., I.M.N., A.D.R. and M.H.d.B analyzed and interpreted the data. M.v.L., J.v.d.W., R.S.N. and A.F.M. prepared the tables and figures. M.v.L., J.v.d.W., A.D.R. and M.H.d.B. drafted the manuscript and approved the final version. M.v.L., J.v.d.W., R.S.N., A.F.M., S.J.L.B., S.P.B., I.M.N., J.S.F.S., G.N., A.D.R. and M.H.d.B. were responsible for critical revision of the manuscript for important intellectual content and approval of the final version.
DATA AVAILABILITY STATEMENT
The data that support the findings of this study are available from the corresponding author, M.H. De Borst, upon reasonable request.
CONFLICT OF INTEREST STATEMENT
None declared.
REFERENCES
Author notes
These authors contributed equally to this work.


Comments