


ABSTRACT
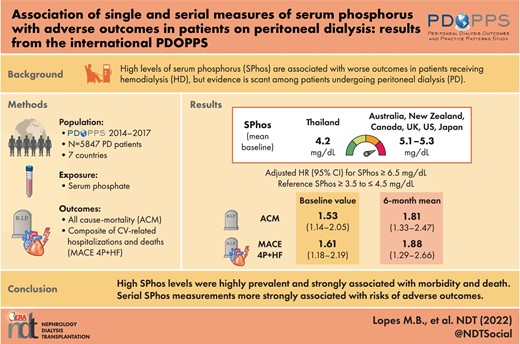
While high serum phosphorus levels have been related to adverse outcomes in hemodialysis patients, further investigation is warranted in persons receiving peritoneal dialysis (PD).
Longitudinal data (2014–17) from the Peritoneal Dialysis Outcomes and Practice Patterns Study (PDOPPS), a prospective cohort study, were used to examine associations of serum phosphorus with all-cause mortality and major adverse cardiovascular events via Cox regression adjusted for confounders. Serum phosphorus levels were parameterized by four methods: (i) baseline serum phosphorus; (ii) mean 6-month serum phosphorus; (iii) number of months with serum phosphorus >4.5 mg/dL; and (iv) mean area-under-the-curve of 6-month serum phosphorus control.
The study included 5847 PD patients from seven countries; 9% of patients had baseline serum phosphorus <3.5 mg/dL, 24% had serum phosphorus ≥3.5 to ≤4.5 mg/dL, 30% had serum phosphorus >4.5 to <5.5 mg/dL, 20% had serum phosphorus ≥5.5 to <6.5 mg/dL, and 17% had serum phosphorus ≥6.5 mg/dL. Compared with patients with baseline serum phosphorus ≥3.5 to ≤4.5 mg/dL, the adjusted all-cause mortality hazard ratio (HR) was 1.19 (0.92,1.53) for patients with baseline serum phosphorus ≥5.5 to <6.5 mg/dL and HR was 1.53 (1.14,2.05) for serum phosphorus ≥6.5 mg/dL. Associations between serum phosphorus measurements over 6 months and clinical outcomes were even stronger than for a single measurement.
Serum phosphorus >5.5 mg/dL was highly prevalent (37%) in PD patients, and higher serum phosphorus levels were a strong predictor of morbidity and death, particularly when considering serial phosphorus measurements. This highlights the need for improved treatment strategies in this population. Serial serum phosphorus measurements should be considered when assessing patients’ risks of adverse outcomes.
What is already known about this subject?
High serum phosphorus levels are associated with adverse outcomes in hemodialysis patients.
Different mechanisms exist for phosphorus elimination in peritoneal dialysis compared with hemodialysis; peritoneal dialysis patients may have lower phosphorus clearance and thus are exposed to higher time-averaged serum phosphorus concentrations.
Kidney Disease: Improving Global Outcomes (KDIGO) guidelines for the care of peritoneal dialysis patients do not mention treatment for hyperphosphatemia in detail, or any mineral and bone disorder–specific actions.
What this study adds?
High serum phosphorus (>5.5 mg/dL) was highly prevalent (37%) in this large international cohort of peritoneal dialysis patients.
Higher levels of serum phosphorus were strongly associated with clinical outcomes, including all-cause mortality and major adverse cardiovascular events.
When considering serial measurements of serum phosphorus rather than a single baseline measure, the associations with adverse events were even stronger.
What impact this may have on practice or policy?
The high prevalence of hyperphosphatemia highlights the need for improved treatment strategies in the peritoneal dialysis population.
Serial measurements, rather than the single most recent value, of serum phosphorus should be considered when assessing peritoneal dialysis patients’ risks of adverse outcomes.
INTRODUCTION
It is well established that high levels of serum phosphorus are associated with worse outcomes in patients receiving hemodialysis (HD) [1–3], but evidence is scant among patients undergoing peritoneal dialysis (PD) therapy. Guidelines for the care of patients on PD [4] do not mention treatment for hyperphosphatemia in detail, and Kidney Disease: Improving Global Outcomes (KDIGO) does not mention any mineral and bone disorder (MBD)-specific actions for patients receiving PD [5].
Despite having higher levels of residual kidney function compared with patients on HD, people receiving PD may have lower phosphorus clearance and thus are exposed to higher time-averaged serum phosphorus concentrations [6]. A recent retrospective cohort study by Wu et al. showed that abnormalities in serum phosphorus levels in 1662 patients commencing PD at a single center in China were associated with increased rates of all-cause and cardiovascular mortality [7]. However, this study was limited by potential lack of generalizability to other centers and regions. Moreover, only baseline serum phosphorus levels were evaluated, such that there was no assessment of the relationship between serial phosphorus measurements and clinical outcomes.
Due to the lack of evidence for adverse effects of high phosphorus levels in patients receiving PD and the different mechanisms that exist for phosphorous elimination in PD compared with HD, we evaluated the association between serum phosphorus and adverse clinical outcomes in patients receiving PD, and explored results parameterizing serum phosphorus as a single baseline value compared with serial measures over a 6-month time period.
MATERIALS AND METHODS
Data source and study design
The Peritoneal Dialysis Outcomes and Practice Patterns Study (PDOPPS) is an ongoing prospective cohort study of people with kidney failure treated with PD. Patients ≥18 years of age receiving chronic PD are selected randomly from national samples of PD facilities in Australia, New Zealand, Canada, Japan, Thailand, the UK and the USA. The PDOPPS study design, details and objectives have previously been published [8]. Data are collected using uniform and standardized data collection tools, procedures and processes implemented across PDOPPS. The PDOPPS was approved by a central institutional review board (IRB) in the USA, with IRB study approval and patient consent obtained for each patient, as required by national and local ethics committee regulations. Data from US patients receiving care at large dialysis organization (LDO) facilities were imported from electronic health records. Data from non-LDO patients in the US and patients from other PDOPPS countries were obtained by manual abstraction of data from medical charts, which were entered into a web-based data collection tool.
In this analysis, we included patients who were enrolled in PDOPPS from January 2014 to October 2017. Patients were excluded if they died or were lost to follow-up during the 6-month run-in period or had fewer than four phosphorus measurements during the run-in period. Patients who previously had a parathyroidectomy were also excluded, because of the possible impact of this procedure on phosphate metabolism. For analyses of major adverse cardiovascular events (MACE) 4P + HF, we additionally excluded PDOPPS facilities that did not sufficiently report cause of hospitalization or death data. The creation of the study population and the number of patients excluded for various reasons is illustrated in Fig. 1.
Variables
The primary exposure of interest was serum phosphorus, which we parameterized using four different methods calculated during the 6-month run-in period (Fig. 2): (i) single most recent serum phosphorus level, measured during the last month of the run-in period; (ii) the mean of all monthly serum phosphorus values reported during the run-in period; (iii) the area-under-the-curve (AUC) of serum phosphorus control >4.5 mg/dL, calculated by multiplying the time spent with serum phosphorus >4.5 mg/dL during the run-in period by the extent to which this threshold was exceeded, as in Lopes et al. [3]; and (iv) number of months with serum phosphorus >4.5 mg/dL (i.e. out of target range) during the run-in period. All serum phosphorus exposures and their relationship to the run-in period and start of follow-up are depicted in Fig. 2.
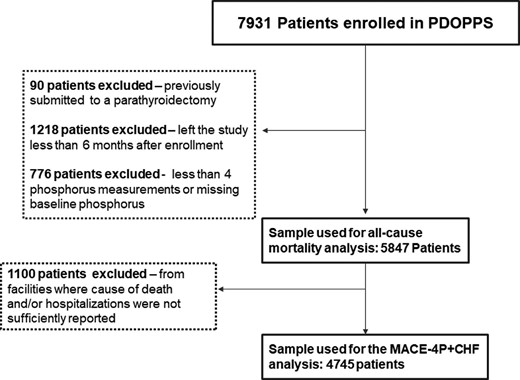
STROBE diagram for the construction of the study sample.
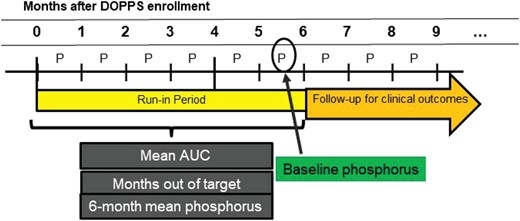
Illustration of the definition of phosphorus exposures used for analyses.
The primary outcome was death by any cause. As a secondary outcome, we evaluated MACE 4P + HF, a composite of cardiovascular (CV) death (acute myocardial infarction, pericarditis, cardiac tamponade, atherosclerotic heart disease, cardiomyopathy, cardiac arrhythmia, cardiac arrest, valvular heart disease, pulmonary edema, congestive heart failure or stroke) with non-fatal stroke, non-fatal unstable angina, non-fatal myocardial infarction, and heart failure (HF). Research staff at participating facilities coded events (i.e. hospitalization, death) using a standardized coding list developed for PDOPPS—not International Classification of Diseases codes—which included diagnosis and procedure codes. Research staff used a range of source documents to determine the data including patient notes, discharge summaries and their associated hospital discharge codes.
Statistical analysis
We first described patient characteristics by serum phosphorus levels and reported international variation in serum phosphorus distributions.
Cox regression was used to estimate the association between serum phosphorus and the time-to-event outcomes. Follow-up started after the 6-month run-in period and continued until the outcome occurred, 7 days after leaving the facility due to transfer or change in kidney replacement therapy modality, loss to follow-up or end of study phase (whichever event occurred first). All models were stratified by country and US LDO status; we progressively added variables in the adjustment to understand the impact of demographic, nutritional, and comorbidity variables on the association. The main model (model 4) adjusted for age, sex, PD vintage, albumin, serum creatinine, history of diabetes, hypertension, congestive heart failure, peripheral vascular disease, cancer, coronary artery disease, other cardiovascular disease, cerebrovascular disease, gastrointestinal bleeding and lung disease. An additional model (model 5) included adjustment for parathyroid hormone (PTH) (most recent value in the 6-month run-in period), which is a possible mediator, and also an important marker of MBD. For models with AUC as a predictor, we additionally adjusted for a 6-month average phosphorus <2.8 mg/dL, which often reflects malnutrition/cachexia.
To evaluate which approach of assessing serum phosphorus levels was most predictive of mortality and MACE 4P + HF, we compared the predictive power for various parameterizations of the exposure variable using the Akaike information criterion (AIC) [9].
To deal with missing model covariate data, we used 10 rounds of multiple imputation, assuming data were missing at random. Missing covariate values were imputed using the Sequential Regression Multiple Imputation Method by IVEware [10]. Results from the imputed data sets were combined for the final analysis, using Rubin's formula [11]. The proportion of missing data was <2% for all variables used for covariate adjustment, except for PTH (42%), PD dwell volume (25%), residual kidney function (29%) and Kt/V (31%).
RESULTS
Study population
Our study population included 5847 PD patients (Fig. 1). The source population consisted of 7931 PD patients enrolled in phase 1 of PDOPPS. We excluded 90 patients with a previous parathyroidectomy, 1218 patients with fewer than 6 months of data available, and 776 patients with 6 months of data but fewer than four phosphorus measures. In our sample, the median (interquartile range) follow-up time was 12 (5, 18) months. There were 723 total deaths during the study (death rate: 11.3 per 100 patient-years). For the MACE 4P + HF outcome, we analyzed data from facilities with adequate reporting of cause of death (N = 4745). In this subset, 610 deaths were reported, 156 (26%) of which were due to CV factors, and 529 MACE 4P + HF events were reported (MACE 4P + HF rate: 9.7 per 100 patient-years).
Patient characteristics by baseline phosphorus levels are shown in Table 1. In our sample, 9% of patients had baseline serum phosphorus <3.5 mg/dL, 24% had serum phosphorus ≥3.5 to ≤4.5 mg/dL, 30% had serum phosphorus >4.5 to <5.5 mg/dL, 20% had serum phosphorus ≥5.5 to <6.5 mg/dL and 17% had serum phosphorus ≥6.5 mg/dL. Patients with higher phosphorus levels were much younger, more likely to be male, and had a lower prevalence of CV comorbidities (i.e. coronary artery disease, congestive heart failure, other cardiovascular disease and cerebrovascular disease) and cancer. Mean PTH levels were nearly twice as high in the serum phosphorus ≥6.5 versus <3.5 mg/dL group (581 versus 302 pg/mL). Higher serum creatinine concentration, a sign of better nutritional status, was observed in patients with higher serum phosphorus levels. In terms of treatment-related variables, patients with higher phosphorus levels were more likely to be on automated PD (APD) than on continuous ambulatory PD (CAPD), had a higher achieved Kt/V, and were more likely to be prescribed cinacalcet and phosphate binders, but not vitamin D. Patient characteristics by serial phosphorus measurement levels are summarized in Supplementary data, Table S1.
Patient characteristics by baseline phosphorus levels.
| Categories of baseline phosphorus (mg/dL) | |||||
|---|---|---|---|---|---|
| Characteristics | <3.5 | ≥3.5 to ≤4.5 | >4.5 to <5.5 | ≥5.5 to <6.5 | ≥6.5 |
| Number of patients, n (%) | 530 (9) | 1411 (24) | 1757 (30) | 1155 (20) | 994 (17) |
| Age, years | 62.7 (14.4) | 62.5 (14.5) | 60.3 (14.3) | 58.3 (15.1) | 52.5 (14.4) |
| PD vintage, years | 1.3 (0.7–3.0] | 1.2 (0.6–2.2) | 1.1 (0.6–2.4) | 1.2 (0.7–2.7) | 1.2 (0.7–2.7) |
| Male gender (%) | 56 | 59 | 58 | 59 | 61 |
| Urine volume >200 mL/24 h (%) | 67 | 77% | 76 | 70 | 64 |
| Hypertension (%) | 85 | 83% | 83 | 85 | 86 |
| Diabetes (%) | 50 | 50 | 49 | 46 | 47 |
| Coronary artery disease (%) | 20 | 21 | 21 | 22 | 16 |
| Heart failure (%) | 15 | 14 | 12 | 13 | 14 |
| Other cardiovascular disease (%) | 17 | 14 | 12 | 11 | 10 |
| Peripheral vascular disease (%) | 10 | 13 | 10 | 10 | 9 |
| Cancer (other than skin) (%) | 9 | 8 | 9 | 8 | 6 |
| Cerebrovascular disease (%) | 10 | 9 | 7 | 7 | 6 |
| Serum calcium, mg/dLa | 8.8 (0.8) | 8.9 (0.7) | 8.9 (0.7) | 8.9 (0.8) | 8.8 (0.9) |
| Serum phosphorus, mg/dLa | 2.9 (0.5) | 4.0 (0.3) | 4.9 (0.3) | 5.9 (0.3) | 7.6 (1.1) |
| PTH, pg/mLa | 302 (284) | 361 (308) | 426 (392) | 462 (393) | 581 (464) |
| Hemoglobin, g/dLa | 11.1 (1.8) | 11.2 (1.5) | 11.1 (1.5) | 10.9 (1.5) | 10.5 (1.5) |
| Serum albumin, g/dLb | 3.3 (0.5) | 3.4 (0.5) | 3.5 (0.4) | 3.5 (0.4) | 3.5 (0.5) |
| Serum creatinine, mg/dLa | 7.1 (3.4) | 7.3 (3.2) | 8.7 (3.4) | 10.1 (3.6) | 12.2 (4.0) |
| Phosphate binder use (%) | 55 | 65 | 76 | 81 | 89 |
| Vitamin D use (%) | 57 | 65 | 70 | 73 | 68 |
| Cinacalcet use (%) | 13 | 16 | 18 | 25 | 26 |
| CAPD as PD modality (%) | 45 | 31 | 27 | 25 | 21 |
| Dwell volume, L/24 h | 7.5 (3.8) | 7.1 (4.3) | 7.4 (4.5) | 7.2 (4.6) | 7.3 (4.8) |
| PD Kt/V | 1.44 (0.56) | 1.40 (0.54) | 1.43 (0.51) | 1.49 (0.51) | 1.56 (0.48) |
aThe most recent value before the start of follow-up.
Average value of measures collected during the 6-month run-in period.
Numbers displayed are either mean (SD) or median (interquartile range) or percentages.
Serum phosphorus levels
As illustrated in Fig. 3, baseline serum phosphorus levels were generally similar across most PDOPPS countries (mean 5.1–5.3 mg/dL), except for Thailand, where mean baseline serum phosphorus was only 4.2 mg/dL. Figure 3 also shows that less variability was observed for 6-month mean serum phosphorus than baseline serum phosphorus (standard deviation 1.2 versus 1.5 mg/dL). Across our sample, only 9%–16% maintained phosphorus levels <4.5 mg/dL during the entire 6-month run-in period (i.e. AUC = 0) in all countries except for Thailand (43%, Fig. 4). Patients with the most recent phosphorus out of target (>4.5 mg/dL) represented 67% of the sample; 69% of patients had a 6-month mean phosphorus above this same threshold.
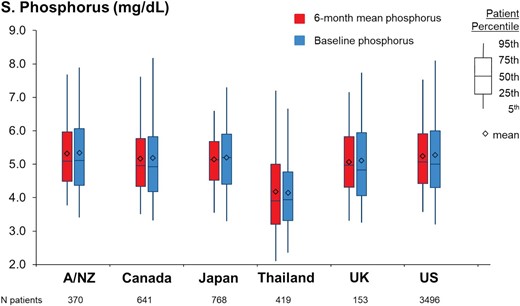
Distribution of baseline phosphorus and 6-month mean phosphorus values among the PDOPPS participating countries. A/NZ, Autralia/New Zealand.
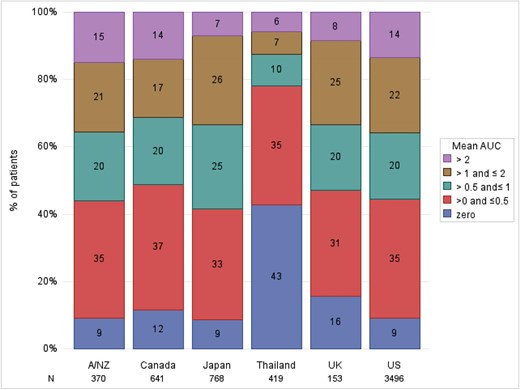
Proportion of patients within different AUC categories, by PDOPPS country. AUC of phosphorus control, calculated by multiplying the time spent with serum phosphorus >4.5 mg/dL over the 6-month run-in period by the extent to which this threshold was exceeded. The mean (monthly) AUC is calculated from the sum of total AUC divided by 6.
Serum phosphorus and clinical outcomes
In unadjusted analyses, serum phosphorus, as a single baseline measurement, did not appear to be associated with all-cause mortality (Table 2, model 1). However, after adjustment for appropriate confounders (Table 2, model 4), the hazard ratios (HR) compared with the reference group (serum phosphorus ≥3.5 to <4.5 mg/dL) were 1.19 [95% confidence interval (CI) 0.92, 1.53] for serum phosphorus ≥5.5 to <6.5 mg/dL and 1.53 (95% CI 1.14, 2.05) for serum phosphorus ≥6.5 mg/dL. The adjusted Cox model for the MACE 4P + HF outcome showed that the HR for serum phosphorus ≥6.5 mg/dL was 1.61 (95% CI 1.18, 2.19) compared with the reference group (serum phosphorus ≥3.5 to ≤4.5 mg/dL). Adjustments for demographics and nutritional markers appeared to have the largest impact on the observed HRs for all-cause mortality. The impact of covariate adjustment was similar when modeling serial phosphorus measurements with all-cause mortality (Supplementary data, Table S2A–C).
Association between baseline phosphorus and all-cause mortality, by level of adjustment.
| Baseline phosphorus (mg/dL) | N | Model 1 | Model 2 | Model 3 | Model 4 | Model 5 |
|---|---|---|---|---|---|---|
| <3.5 | 528 | 1.15 (0.90, 1.48) | 1.05 (0.83, 1.33) | 1.02 (0.79, 1.31) | 1.04 (0.80, 1.35) | 1.03 (0.79, 1.34) |
| ≥3.5 to ≤4.5 | 1547 | 1 (ref) | 1 (ref) | 1 (ref) | 1 (ref) | 1 (ref) |
| > 4.5 to <5.5 | 1610 | 0.78 (0.63, 0.97) | 0.89 (0.72, 1.11) | 1.02 (0.81, 1.27) | 1.04 (0.83, 1.31) | 1.01 (0.81, 1.27) |
| ≥5.5 to <6.5 | 1153 | 0.82 (0.64, 1.04) | 1.00 (0.79, 1.27) | 1.18 (0.92, 1.51) | 1.19 (0.92, 1.53) | 1.18 (0.92, 1.52) |
| ≥6.5 | 993 | 0.79 (0.62, 1.01) | 1.32 (1.02, 1.70) | 1.51 (1.14, 2.00) | 1.53 (1.14, 2.05) | 1.52 (1.14, 2.03) |
N = 5847 patients, n = 723 deaths. Hazard ratio (95% CI) reported.
Model 1: stratified by country, US LDO status.
Model 2: model 1 + adjusted for age, sex and peritoneal dialysis vintage.
Model 3: model 2 + mean 6-month albumin and most recent serum creatinine.
Model 4 (main model): model 3 + history of diabetes, hypertension, congestive heart failure, peripheral vascular disease, cancer, coronary artery disease, other cardiovascular disease, cerebrovascular disease, and gastrointestinal bleeding and lung disease.
Model 5: model 4 + PTH (most recent value in the 6-month run-in period), PD dwell volume, residual kidney function, Kt/V and PD modality.
The associations between serial phosphorus measurements and clinical outcomes are summarized in Table 3. Compared with patients with a 6-month mean phosphorus ≥3.5 to ≤4.5 mg/dL, the all-cause mortality HRs were 1.42 (95% CI 1.10, 1.82) for serum phosphorus ≥5.5 to <6.5 mg/dL and 1.81 (95% CI 1.33, 2.47) for serum phosphorus ≥6.5 mg/dL. For the MACE 4P + HF outcome, the HR was 1.64 (95% CI 1.23, 2.18) for serum phosphorus ≥5.5 to <6.5 and 1.85 (95% CI 1.29, 2.66) for serum phosphorus ≥6.5 mg/dL compared with the reference group (serum phosphorus ≥3.5 to <4.5 mg/dL).
Association of baseline and serial phosphorus parameters with all-cause mortality and MACE 4P + HF.
| Hazard Ratio (95% CI) | |||
|---|---|---|---|
| Exposures | N (%) | ACM | MACE 4P + HF |
| Baseline phosphorus (mg/dL) | |||
| < 3.5 | 530 (9) | 1.04 (0.80, 1.35) | 0.84 (0.58, 1.21) |
| ≥ 3.5 to ≤ 4.5 | 1411 (24) | 1 (ref) | 1 (ref) |
| > 4.5 to < 5.5 | 1757 (30) | 1.04 (0.83, 1.31) | 1.13 (0.90, 1.43) |
| ≥ 5.5 to < 6.5 | 1155 (20) | 1.19 (0.92, 1.53) | 1.04 (0.78, 1.40) |
| ≥ 6.5 | 994 (17) | 1.53 (1.14, 2.05) | 1.61 (1.18, 2.19) |
| 6-month mean phosphorus (mg/dL) | |||
| <3.5 | 365 (6%) | 0.90 (0.68, 1.20) | 0.65 (0.41, 1.01) |
| ≥3.5 to ≤4.5 | 1442 (25) | 1 (ref) | 1 (ref) |
| >4.5 to <5.5 | 2115 (36) | 1.12 (0.93, 1.35) | 1.12 (0.87, 1.42) |
| ≥5.5 to <6.5 | 1196 (20) | 1.42 (1.10, 1.82) | 1.64 (1.23, 2.18) |
| ≥6.5 | 729 (12) | 1.81 (1.33, 2.47) | 1.85 (1.29, 2.66) |
| Mean monthly AUC (>4.5 mg/dL) | |||
| 0 | 695 (12) | 1 (ref) | 1 (ref) |
| >0 to 0.5 | 2052 (35) | 1.18 (0.91, 1.51) | 1.54 (1.12,2.13) |
| >0.5 to 1 | 1157 (20) | 1.28 (0.96, 1.70) | 1.77 (1.23, 2.53) |
| >1 to 2 | 1235 (21) | 1.48 (1.10, 2.01) | 2.26 (1.57, 3.26) |
| >2 | 708 (12) | 1.75 (1.21, 2.53) | 2.81 (1.91, 4.12) |
| Months above phosphorus target (>4.5 mg/dL) | |||
| 0 | 789 (13) | 1 (ref) | 1 (ref) |
| 1 | 438 (7) | 1.21(0.87, 1.69) | 1.36 (0.96, 1.93) |
| 2–3 | 1037 (18) | 1.13 (0.86, 1.47) | 1.42 (1.03, 1.98) |
| 4–5 | 1594 (27) | 1.28 (0.99, 1.65) | 1.43 (1.03, 1.98) |
| 6 | 1989 (34) | 1.57 (1.19, 2.06) | 2.04 (1.47, 2.83) |
ACM: all-cause mortality, MACE 4P + HF: major adverse cardiovascular event with heart failures, AUC: area under the curve, ref: reference.
Number of patients included and events: ACM analysis: N = 5847 patients, 723 events; and MACE 4P + HF: N = 4745 patients, 529 events.
Model adjustment: models are stratified by country and US LDO status, adjusted for age, sex, peritoneal dialysis vintage, mean 6-month albumin and creatinine, history of diabetes, hypertension, congestive heart failure, peripheral vascular disease, cancer, coronary artery disease, other cardiovascular diseases, cerebrovascular disease, gastrointestinal bleeding and lung disease.
We observed consistently strong associations between AUC and outcomes (Table 3). Compared with AUC = 0 (i.e. patients with serum phosphorus values ≤4.5 mg/dL during the entire 6-month run-in period), the adjusted all-cause mortality HRs were 1.18 (95% CI 0.91,1.51) for AUC > 0 to 0.5, 1.28 (95% CI 0.96,1.70) for AUC > 0.5 to 1, 1.48 (95% CI 1.10, 2.01) for AUC > 1 to 2, and 1.75 (95% CI 1.21, 2.53) for AUC > 2. Overall, the adjusted association between AUC and MACE 4P + HF was even stronger than for all-cause mortality; compared with AUC = 0, the HR for AUC > 2 was 2.81 (95% CI 1.91, 4.12).
When compared with patients with 0 months above the phosphorus target (>4.5 mg/mL), the all-cause mortality HRs were 1.21 (95% CI 0.87, 1.69) for 1 month out of target, 1.13 (95% CI 0.86, 1.47) for 2–3 months, 1.28 (95% CI 0.99, 1.65) for 4–5 months and 1.57 (95% CI 1.19, 2.06) for all 6 months out of target. Consistent with the other serial phosphorus measurements, the association with MACE 4P + HF was stronger than for all-cause mortality; the HR for all 6 months (versus 0 months) with serum phosphorus out of target was 2.04 (95% CI 1.47, 2.83).
Comparing the predictive power of each of the four exposure variables tested (single most recent serum phosphorus; mean serum phosphorus; AUC; months out of target) using the AIC output from the adjusted Cox models, we found that the measures incorporating serial measures of serum phosphorus were consistently stronger predictors of all-cause mortality and MACE 4P + HF than the single serum phosphorus measurement. AUC was the strongest predictor of all the phosphorus-based predictors tested (Supplementary data, Table S3).
DISCUSSION
In this analysis of patients undergoing PD, we describe the prevalence of hyperphosphatemia by using single and serial measures across seven countries. About two-thirds of patients had hyperphosphatemia (serum phosphorus >4.5 mg/dL) when considering either a single baseline measure or a 6-month mean phosphorus. A small proportion (12%) of patients did not have any phosphorus excursions >4.5 mg/dL during the 6-month run-in period (i.e. AUC = 0). We observed an increased rate of death and MACE for patients with higher phosphorus levels, particularly when considering serial phosphorus measurements. These associations remained strong even after adjustment for nutritional markers, as well as for residual kidney function. To our knowledge, this is the first study that clearly shows the association of persistent hyperphosphatemia with adverse outcomes in the PD setting.
At the time laboratory measurements are taken, the much more continuous nature of PD treatment and its superior preservation of residual kidney function are thought to provide a better reflection of the steady state of phosphorus metabolism compared with HD. In thrice-weekly maintenance HD, phosphorus typically is measured monthly—usually after the longest interdialytic period of a week and before the start of a dialysis session. These differences between kidney replacement therapy modalities and laboratory sampling approaches in relation to steady state levels may result in differences in the implications of what hyperphosphatemia means for PD versus HD patients—whether based upon a single monthly measurement or serial measurements over a longer period. Nonetheless, serial measurements would appear to provide a more reliable indicator of a patient's serum phosphorus levels [3]. We expect a lower specificity for a single phosphorus measurement, when compared with serial measurements, in HD due to measurement errors associated with the pre-session laboratory collection [12, 13]. This may account for a higher proportion of false positive diagnoses of hyperphosphatemia. Conversely in PD, we expect phosphorus levels to reflect the more continuous nature of this kidney replacement therapy. Our analysis shows that using serial phosphorus measurements, as the AUC or 6-month average, is more predictive of adverse outcomes than using the monthly single value and could ultimately improve treatment if used for managing patient serum phosphorus levels.
Because of differences in phosphorus clearance between the PD and HD processes, patients receiving PD have a generally greater exposure to high phosphorus levels than patients on HD. A study by Evenepoel et al. suggests that the time-averaged phosphorus concentrations are higher in PD versus HD patients, and that inferior phosphorus clearance, despite more preserved kidney function, is in the causal pathway [6]. Residual kidney function (RKF) helps to increase phosphorus clearance and is also better preserved by PD, when compared with HD, due to less hemodynamic stability, and better membrane compatibility among other differences [14, 15]. Adjustments to the PD prescription can be used to augment phosphate clearance; however, this would require measurement of phosphate clearance in the dialysate, which is rarely conducted in clinical practice. It is not clear how well peritoneal creatinine transporter status and creatinine clearance perform as surrogate markers of peritoneal phosphate transport and clearance [16–18]. In this analysis, data on residual kidney function were based on urine volume, which previously was identified as a better predictor of survival in PD patients than residual glomerular filtration rate. RKF is associated with better outcomes in the PD setting [19]; while diuretics are often prescribed to preserve residual urine output, hypokalemia is an important side effect to consider, given that low potassium levels are associated with increased mortality risk [20].
RKF is associated with prognostic indicators other than the mere elimination of uremic toxins and phosphorus. Wang et al. studied patients on CAPD and observed an association between RKF and actual daily protein intake and daily caloric intake [21]. A shorter time to the onset of anuria is independently predicted by low baseline RKF, increased body surface area, high dietary protein intake and diabetes mellitus [22]. Such at-risk patients should be closely monitored for early signs of inadequate dialysis.
In this multinational cohort, we found that patients from Thailand had lower levels of phosphorus than other participating countries. Even though diet and practice patterns of phosphorus control may play a role in the differences of phosphorus distribution among countries, it is more likely that low levels of phosphorus may be surrogate markers of protein energy wasting. A meta-analysis of global prevalence of protein-energy wasting in chronic kidney disease also found a high prevalence of this condition in southeast Asia [23]. Furthermore, a previous PDOPPS study showed that patients from Thailand also had lower potassium levels than those in other countries, reflecting poorer dietary habits [20]. Protein losses are expected for PD and tend to be highest in patients who are rapid transporters [24]. While protein loss may be a sign of greater comorbidity burden, it has not been associated with increased mortality. In our sample, age was inversely associated with serum phosphorus levels, reinforcing the assumption of poorer nutritional status and additional frailty. The associations of phosphorus with adverse outcomes became evident after adjusting for age and persisted after adjustment for nutritional factors as well as residual urine volume.
Our study has some limitations. Due to the observational design, residual confounding is possible. However, we accounted for many potential confounders including demographics, comorbidities, and markers of nutrition. Due to the extent of PDOPPS data collection and its multinational features, with many participants and events, it is not feasible to adjudicate all causes of death, as is commonly performed in small clinical trials. For the same reason, it was also not possible to ensure consistency in the time of day that serum phosphorus was measured; phosphorus levels can vary by time of day, and this misclassification of the exposure may have biased results towards the null [25]. Whilst missing data were imputed, it is acknowledged that rates of data missingness were relatively high (25%–42%) for PTH, PD dwell volume, residual kidney function and Kt/V. Our study also lacks data on some prescribed PD patterns, including the use of glucose solutions and transport characteristics of the peritoneal membrane. The large sample size and standardized protocol for data collection are important strengths of this study. Given the random sampling design of the PDOPPS, our study sample can be viewed as representative of the PD population in each participating country. It is therefore reasonable to predict that these results can be generalized to a wider PD patient population.
Consistent with results of HD studies, hyperphosphatemia was strongly associated with all-cause mortality and MACE 4P + HF, particularly when using serial phosphorus measurements. Our results support current KDIGO guideline recommendations, insofar as serial measurements that consider a history of serum phosphorus excursions >4.5 mg/dL should be considered when assessing patients’ risks of adverse clinical outcomes.
ACKNOWLEDGEMENTS
We acknowledge and thank the PDOPPS Steering Committee members for their contributions. Jennifer McCready-Maynes, an employee of Arbor Research Collaborative for Health, provided editorial support.
AUTHORS’ CONTRIBUTIONS
M.B.L., A.K. and R.L.P. conceived and/or designed the work that led to the submission, acquired data, and/or played an important role in interpreting the results. M.B.L., A.K., J.Z., D.W.J., T.K., M.W., K.N., H.K., J.P. and R.L.P. drafted or revised the manuscript. M.B.L., A.K., J.Z., D.W.J., T.K., M.W., K.N., H.K., J.P. and R.L.P. approved the final version.
The results presented in this paper have not been published previously in whole or part, except in abstract form.
FUNDING
This manuscript was directly supported by Akebia Therapeutics, Inc. Global support for the ongoing DOPPS Programs is provided without restriction on publications by a variety of funders. For details see https://www.dopps.org/AboutUs/Support.aspx
DATA AVAILABILITY STATEMENT
The data that support the findings of this study are available from the corresponding author upon reasonable request. Data may be made available to qualified researchers for approved scientific uses. Some limitations and fees may apply. Arbor Research Collaborative for Health encourages investigators, whether or not previously affiliated with the Dialysis Outcomes and Practice Patterns Study (DOPPS), to submit proposals for data use, collaboration, and ancillary studies.
CONFLICT OF INTEREST STATEMENT
M.B.L., A.K., J.Z. and R.L.P. are employees of Arbor Research Collaborative for Health, which administers the DOPPS Programs. Global support for the ongoing DOPPS Programs is provided without restriction on publications by a variety of funders. For details see https://www.dopps.org/AboutUs/Support.aspx. H.K. declares support from Japanese Society for peritoneal dialysis; and honoraria from Kyowa Kirin Co. M.W. has no conflicts of interest to disclose. D.W.J. has received grants or contracts from Baxter Healthcare, Fresenius Medical Care, NHMRC; consulting fees from Baxter Healthcare, AstraZeneca, Bayer, Awak; honoraria from Baxter Healthcare, Ono, BI & Lilly; and support for attending meetings and/or travel from Amgen and Ono. K.N. reports grants from Bayer, Ono, Kyowa Kirin; and honoraria from JMS. T.K. reports funding from Thailand Science research and Innovation Fund Chulalongkorn University CU_FRB65_hea (19)_026_30_07, National Research Council of Thailand (156/2560); grants from Kidney Foundation of Thailand Grant (1182/2562, Ratchadapiseksompotch Fund, Faculty of Medicine, Chulalongkorn University (RA63/010); consulting fees from VISTERRA; honoraria from AstraZeneca and Baxter Healthcare; support for attending meetings and/or travel from Fresenius Medical Care and Baxter Healthcare; Participation on a Data Safety Monitoring Board or Advisory Board from CREED.
APPENDIX
PDOPPS Steering Committee members: David Johnson (Australia); Jeffrey Perl (Canada); Mauricio Sanabria (Colombia); Hideki Kawanishi (Japan); Yong-Lim Kim (South Korea); Talerngsak Kanjanabuch (Thailand); Simon Davies (UK); Ronald Pisoni, Bruce Robinson, Jenny Shen (USA).
REFERENCES
Kidney Disease: Improving Global Outcomes (KDIGO) CKD-MBD Update Work Group.


Comments