


ABSTRACT
Post-transplantation diabetes mellitus (PTDM) is a major clinical problem in kidney transplant recipients (KTRs). Diuretic-induced hyperglycaemia and diabetes have been described in the general population. We aimed to investigate whether diuretics also increase PTDM risk in KTRs.
We included 486 stable outpatient KTRs (with a functioning graft ≥1 year) without diabetes from a prospective cohort study. Participants were classified as diuretic users and non-users based on their medication use verified by medical records.
At the baseline study, 168 (35%) KTRs used a diuretic (thiazide, n = 74; loop diuretic, n = 76; others, n = 18) and 318 KTRs did not use a diuretic. After 5.2 years [interquartile range (IQR) 4.0‒5.9] of follow up, 54 (11%) KTRs developed PTDM. In Cox regression analyses, diuretic use was associated with incident PTDM, independent of age, sex, fasting plasma glucose (FPG) and haemoglobin A1c (HbA1c) {hazard ratio [HR] 3.28 [95% confidence interval (CI) 1.84–5.83]; P <0.001}. Further adjustment for potential confounders, including lifestyle, family history of cardiovascular disease, use of other medication, kidney function, transplantation-specific parameters, BMI, lipids and blood pressure did not materially change the association. Moreover, in Cox regression analyses, both thiazide and loop diuretics associated with the development of PTDM, independent of age, sex, FPG and HbA1c [HR 2.70 (95% CI 1.24–5.29); P = 0.012 and HR 5.08 (95% CI 2.49–10.34); P <0.001), respectively].
This study demonstrates that diuretics overall are associated with an increased risk of developing PTDM in KTRs, independent of established risk factors for PTDM development. The association was present for both thiazide and loop diuretics.
What is already known about this subject?
The use of antihypertensive drugs such as diuretics has been known to be associated with an increased risk of new-onset diabetes in the general population.
This has not been investigated in kidney transplant recipients (KTRs).
What this study adds?
We explored the associations between diuretic use with incident post-transplantation diabetes mellitus (PTDM) in KTRs.
We found that the use of diuretics is a strong and independent risk factor for incident PTDM.
Our findings highlight the association of thiazide diuretics, and particularly loop diuretics, with increased risk for PTDM.
What impact this may have on practice or policy?
Our findings call for careful evaluation of the necessity of diuretics use in KTRs.
We identified diuretic use as a potentially modifiable risk factor for PTDM development.
INTRODUCTION
Post-transplantation diabetes mellitus (PTDM) is a well-recognized risk factor for graft failure and cardiovascular mortality in kidney transplant recipients (KTRs) [1]. Hypertension is another common disease among KTRs that needs to be adequately controlled by antihypertensive medications [2]. In the general population, antihypertensive drugs such as diuretics are well known to trigger hyperglycaemia and subsequently new-onset diabetes mellitus [3]. Several long-term, randomized clinical trials on antihypertensive drug therapy have shown considerable differences with regards to the incidence of diabetes between treatment groups [4–6]. In a large randomized clinical trial, hypertensive patients treated with low-dose diuretic therapy had a higher incidence of diabetes compared with those treated with long-acting nifedipine [7]. Similarly, in the Antihypertensive and Lipid-Lowering Treatment to Prevent Heart Attack Trial (ALLHAT), the incidence of diabetes was significantly higher in the thiazide group than in those receiving other antihypertensive medications [8]. A recent network meta-analysis further suggests that diuretic use, followed by beta-blockers, is strongly associated with incident diabetes [3]. Diuretic-induced hyperglycaemia and glucose intolerance have been mainly attributed to impairment of insulin secretion, secondary to potassium loss following diuretic treatment [8–10].
Diuretics are frequently prescribed in KTRs as the initial choice of antihypertensive medications and volume optimization [11]. However, it is currently unknown whether diuretic use is associated with incident PTDM in KTRs. Therefore, we aimed to prospectively investigate the association between diuretic use and PTDM in KTRs.
MATERIALS AND METHODS
Design and study population
We conducted longitudinal analyses in a large, single-centre KTR cohort study from the TransplantLines Food and Nutrition Biobank and Cohort Study (NCT02811835). All adult KTR (age ≥18 years) ≥1 year after transplantation were approached for participation during outpatient clinic visits at the University Medical Centre Groningen (UMCG), Groningen, the Netherlands between 2008 and 2011, as described previously [12] (see Supplementary data). Of 817 initially invited KTRs, 707 signed written informed consent to participate in the present study. For the present study, we excluded patients with diabetes or a history of diabetes at baseline, leaving 486 KTRs who were eligible for analysis. The study was conducted according to the guidelines laid down in the Declaration of Helsinki and all procedures involving human subjects/patients were approved by the institutional review board (METc 2008/186).
Data collection
The baseline measurements were performed once at baseline during a morning visit to the outpatient clinic as described previously [12] (see Supplementary data). Participants were classified as diuretic users and non-users. The KTRs used diuretics categorized into three groups based on the type of diuretics used: thiazide, loop and other diuretics (mainly potassium-sparing diuretics). Because data on patient-reported medication use and medical records-reported medication use, even if the one is verified by the other, always remains subjective and non-use cannot be excluded, we added objective data on evidence of diuretic use by measuring metabolites on diuretics in 24-h urine samples. Molecular evidence of laboratory-confirmed hydrochlorothiazide and loop diuretic was obtained through liquid chromatography–mass spectrometry (LC-MS)-based metabolomics analysis of urine [13]. Blood pressure (BP) and heart rate were measured according to a standardized protocol with a semi-automatic device (Dinamap1846; Critikon, Tampa, FL, USA), which has been used in clinical studies and cohort studies from our department [14–16] (see Supplementary data).
Fasting plasma glucose (FPG) was measured by an enzymatic assay and haemoglobin A1c (HbA1c) was measured using a turbidimetric inhibition immunoassay. Other markers were measured according to standard laboratory procedures (see Supplementary data).
Outcome definition
The diagnosis of PTDM was defined according to the American Diabetes Association criteria with at least one of the following requirements: FPG ≥7.0 mmol/L (126 mg/dL); HbA1c ≥6.5% (48 mmol/mol); non-fasting plasma glucose concentration ≥11.1 mmol/L (200 mg/dL) and classic symptoms of diabetes (e.g. polyuria, polydipsia, unexplained weight loss), or the start of use of glucose-lowering medication [17, 18] (see Supplementary data).
Statistical analyses
Statistical analyses were performed using statistical packages SPSS (version 24.0.1; IBM, Armonk, NY, USA) and Stata/SE (version 14; StataCorp, College Station, TX, USA). Two-sided P-values ˂0.05 were considered statistically significant. The difference between diuretic users versus non-users was tested utilizing independent samples T-tests for normally distributed continuous data, Mann–Whitney U-tests for skewed data and chi-squared tests for categorical data. Data are expressed as mean ± standard deviation (SD) for normally distributed data, median [interquartile range (IQR)] for skewed data and percentages for categorical data.
In prospective analyses, Kaplan–Meier curves were constructed and a log-rank test was used to compare the estimated differences between diuretic users and non-users, as well as thiazide, loop diuretic and non-diuretic users. To investigate the prospective association between diuretic use and incident PTDM, we performed Cox proportional hazards regression analyses to calculate the hazard ratio (HR) for incident PTDM for diuretic use, as well as thiazide use and loop diuretic use separately. First, we calculated HRs with 95% confidence intervals (CIs) for the crude model. Model 1 was adjusted for age, sex, FPG and HbA1c. Subsequently we performed additive adjustments in Cox regression analyses to avoid too many covariates being included, based on the number of events. In additive multivariable models, we adjusted for smoking status, alcohol use, QUestionnaire to ASsess Health-enhancing physical activity (SQUASH) score and history of cardiovascular disease (model 2); estimated glomerular filtration rate (eGFR), urinary albumin excretion, cytomegalovirus (CMV) infection and time since transplantation (model 3); lipid-lowering medication use, prednisolone dose, calcineurin inhibitor use and proliferation inhibitor use (model 4); plasma sodium, potassium, uric acid, calcium, phosphate and plasma albumin (model 5); body mass index (BMI), systolic blood pressure (SBP), high-density lipoprotein (HDL-C) cholesterol, low-density lipoprotein cholesterol (LDL-C) and triglycerides (model 6). Lastly, in model 7, we performed additional adjustment for the presence of metabolic syndrome.
To explore a potential dose–response relationship, we performed additional Cox regression analyses in which KTRs were divided into five subgroups based on daily diuretic dose defined according to thiazide and loop diuretic equivalents: no diuretics, low-dose thiazide (hydrochlorothiazide ≤25 mg/day), high-dose thiazide (hydrochlorothiazide >25 mg/day), low-dose loop diuretic (furosemide ≤40 mg/day or bumetanide ≤1 mg/day) and high-dose loop diuretic (furosemide >40 mg/day or bumetanide >1 mg /day).
To confirm that our results are consistent if we only include patients who have been using diuretics for a long time (≥6 months), we performed additional Cox regression analyses in which KTRs were excluded if they used diuretics <6 months (n = 6) or if the duration of exposure to diuretics was unknown (n = 13).
Further investigations of the association between diuretic use and PTDM development including potential effect modification, laboratory-confirmed diuretic use analyses and sensitivity analyses were performed using Cox proportional hazards regression analyses (see Supplementary data).
RESULTS
Characteristics of KTRs at baseline
Clinical baseline characteristics of 168 diuretic-using KTRs (n = 76 loop diuretic, n = 74 thiazide, n = 18 others) compared with KTRs not using a diuretic (n = 318) are presented in Table 1. The median time between transplantation and study baseline was 5.4 years (IQR 1.8–12.0). Diuretic users were significantly older with a higher BMI, larger waist circumference and higher SBP, triglycerides, LDL-C, FPG and HbA1c at baseline compared with KTRs not using diuretics. The proportion of KTRs with metabolic syndrome was also higher among diuretic users, while the proportion of KTRs with pre-diabetes did not differ between the groups. The dialysis duration was longer in KTRs using diuretics, whereas the percentage of living donors and eGFR was lower in diuretic users. No differences in immunosuppressive use, use of a corticosteroid-free immunosuppressive regimen or other medication use were observed between the groups.
Baseline clinical and laboratory characteristics of 318 KTRs who did not use a diuretic and 168 KTRs who used a diuretic
| Used diuretics | |||
|---|---|---|---|
| Variables | Yes | No | P-value |
| Participants, n | 168 | 318 | |
| General characteristics | |||
| Men, % | 56.5 | 57.5 | 0.848 |
| Age (years), mean ± SD | 55.0 ± 11.5 | 49.8 ± 13.6 | <0.001 |
| Current smoker, % | 16.7 | 11.8 | 0.156 |
| Alcohol use, never, % | 10.4 | 10.4 | 1.00 |
| Physical activity score (time × intensity), median (IQR) | 5730 (2205–91 912) | 5565 (3235–8347) | 0.985 |
| Weight (kg) | 81.4 ± 16.0 | 77.6 ± 15.5 | 0.012 |
| Height (cm) | 173.9 ± 9.1 | 174.1 ± 9.9 | 0.871 |
| BMI (kg/m2) | 26.8 ± 4.6 | 25.5 ± 4.3 | 0.002 |
| Waist circumference (cm) | 99.5 ± 13.8 | 94.9 ± 14.1 | 0.001 |
| Transplant demographics | |||
| Time since renal transplantation (years), median (IQR) | 5.8 (2.4–13.7) | 5.1 (1.7–11.1) | 0.220 |
| Donor age (years), mean ± SD | 42.9 ± 15.2 | 42.8 ± 15.6 | 0.976 |
| Living donor, % | 28.6 | 39.3 | 0.022 |
| Dialysis duration (months), median (IQR) | 32 (13–62) | 24 (6–48) | 0.003 |
| Delayed graft function, % | 7.7 | 5.7 | 0.435 |
| Rejection, % | 28.0 | 22.6 | 0.222 |
| Blood pressure (mmHg), mean ± SD | |||
| Systolic blood pressure (years), mean ± SD | 138.2 ± 18.5 | 134.2 ± 16.2 | 0.020 |
| Diastolic blood pressure | 84.2 ± 10.5 | 82.4 ± 11.2 | 0.079 |
| Lipids (mmol/L), median (IQR) | |||
| Total cholesterol | 5.3 (4.4–6.0) | 4.9 (4.4–5.6) | 0.007 |
| LDL cholesterol | 3.0 (2.5–3.6) | 2.8 (2.3–3.4) | 0.014 |
| HDL cholesterol, mmol/L | 1.3 (1.1–1.7) | 1.3 (1.1–1.7) | 0.604 |
| Triglycerides | 1.8 (1.3–2.4) | 1.5 (1.1–2.0) | 0.001 |
| Hypertension, % | |||
| Glucose homeostasis | |||
| Glucose (mmol/L) | 5.2 ± 0.6 | 5.1 ± 0.6 | 0.029 |
| HbA1c (%) | 5.7 ± 0.3 | 5.6 ± 0.4 | 0.003 |
| Pre-diabetes (%) | 26.3 | 21.2 | 0.201 |
| Metabolic syndrome (%) | 63.1 | 35.7 | 0.010 |
| hs-CRP (mg/L) | 1.4 (0.7–4.8) | 1.4 (0.6–3.4) | 0.240 |
| Renal function | |||
| eGFR (mL/min/1.73 m2) | 37.1 (24.6–52.6) | 48.4 (36.4–61.6) | <0.001 |
| CMV infection, % | 28.2 | 25.9 | 0.645 |
| Medication use | |||
| Statin use, % | 53.0 | 48.1 | 0.340 |
| Anti hypertensive medication, % | 100 | 79.6 | <0.001 |
| Prednisolone (mg/day) | 8.7 ± 2.1 | 8.8 ± 1.8 | 0.491 |
| Corticosteroids free regimen, % | 1.2 | 0.3 | 0.275 |
| Calcineurin inhibitor, % | 60.1 | 52.8 | 0.126 |
| Cyclosporine, % | 41.1 | 36.5 | |
| Tacrolimus, % | 19.6 | 16.4 | |
| Proliferation inhibitor, % | 81.5 | 86.2 | 0.189 |
| Azathioprine, % | 25.0 | 15.4 | |
| Mycophenolic acid, % | 56.5 | 70.8 | |
Significance was tested by t-tests and Wilcoxon tests where appropriate. Significant associations are in bold.
hs-CRP, high-sensitivity C-reactive protein; CMV, cytomegalovirus.
In addition, KTRs on diuretics had higher plasma uric acid, phosphate and serum creatinine but a lower plasma albumin. The 24-h urinary excretion of uric acid, magnesium, calcium and phosphate was lower in KTRs who used a diuretic (Table 2).
Plasma and urinary biochemical measurements; baseline characteristics of 318 KTRs who did not use a diuretic and 168 KTRs who used a diuretic
| Used diuretics | |||
|---|---|---|---|
| Variables | Yes | No | P-value |
| Participants, n | 168 | 318 | |
| Plasma concentrations | |||
| Sodium (mmol/L), mean ± SD | 140.6 ± 3.1 | 141.1 ± 2.6 | 0.080 |
| Potassium (mmol/L), mean ± SD | 3.9 ± 0.5 | 3.9 ± 0.4 | 0.290 |
| Uric acid (mmol/L) | 0.5 (0.4–0.6) | 0.4 (0.3–0.5) | < 0.001 |
| Magnesium (mmo/L), mean ± SD | 0.8 ± 0.1 | 0.8 ± 0.1 | 0.171 |
| Calcium (mmol/L), mean ± SD | 2.4 ± 0.1 | 2.4 ± 0.1 | 0.072 |
| Phosphate (mmol/L), mean ± SD | 1.0 ± 0.2 | 0.9 ± 0.2 | 0.032 |
| Albumin (g/L), mean ± SD | 42.4 ± 3.2 | 43.7 ± 2.7 | < 0.001 |
| Creatinine (µmol/L) | 137.0 (107.0–181.0) | 117.5 (98.0–148.7) | < 0.001 |
| Urinary excretion of | |||
| Sodium (mmol/24 h) | 147 (116–192) | 144 (113–187) | 0.645 |
| Potassium (mmol/24 h) | 69.9 (54.4–90.9) | 71.4 (55.6–87.2) | 0.945 |
| Uric acid (mmol/24 h) | 2.3 (1.8–2.9) | 2.6 (2.1–3.3) | < 0.001 |
| Magnesium (mmol/24 h) | 3.0 (2.2–4.3) | 3.4 (2.4–4.5) | 0.042 |
| Calcium (mmol/24 h) | 1.9 (0.8–3.5) | 2.5 (1.2–4.1) | 0.011 |
| Phosphate (mmol/24 h) | 22.7 (17.4–30.4) | 25.2 (19.6–31.2) | 0.028 |
| Albumin (mg/24 h) | 43.7 (10.7–242.3) | 30.2 (8.4–119.2) | 0.055 |
| Creatinine (mmol/24 h), mean ± SD | 11.7 ± 3.6 | 11.9 ± 3.1 | 0.514 |
| Urinary volume | 2463 (1991–2849) | 2403 (1836–2863) | 0.373 |
Data are median (IQR) unless stated otherwise. Significance was tested by t-tests and Wilcoxon tests where appropriate. Significant associations are in bold.
Association between the use of any diuretic, a thiazide and a loop diuretic with incident PTDM
In total, 54 KTRs (11%) developed PTDM during a median follow-up of 5.2 years (IQR 4.1–5.8). Among 168 KTRs who used diuretics, 31 individuals (18%) developed PTDM, compared with 23 of 318 (7%) among non-users (P <0.001). Among 74 KTRs who used a thiazide and among 76 KTRs who used a loop diuretic, 10 (13%) and 17 (22%), respectively, developed PTDM. Kaplan–Meier curves (Figure 1) showed a prospective association of diuretic use with higher PTDM incidence (log-rank test, P <0.001). Subsequently we used Kaplan–Meier analyses to compare PTDM risk among KTRs who used a thiazide, loop diuretics or other diuretics and who did not use diuretics (Supplementary data, Figure S1). The risk of PTDM development was significantly higher for loop diuretic users than thiazide users and for non-diuretic users (log-rank test, P <0.001).
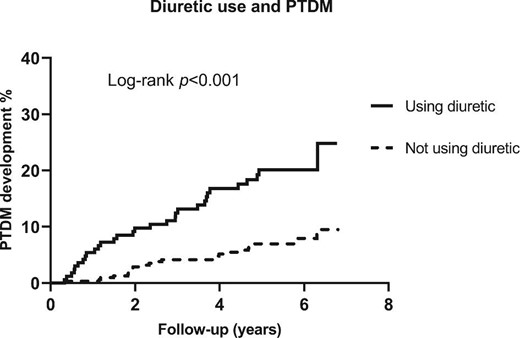
Kaplan–Meier curves depicting PTDM incidence according to diuretic users (n = 186) and non-diuretic users (n = 318).
Furthermore, we performed Cox proportional hazards regression analyses for any diuretic use and incident PTDM. The associations between any diuretic use and incident PTDM are shown in Table 3. Using a diuretic was found to be associated with a higher risk of PTDM development in crude analyses [HR 3.15 (95% CI 1.84–5.42); P <0.001]. After adjustment for age, sex, FPG and HbA1c (model 1), the association remained statistically significant [HR 3.28 (95% CI 1.84–5.83); P <0.001]. Adjustment for additional variables including alcohol consumption, smoking status, physical activity and history of cardiovascular disease (model 2); eGFR, albuminuria, CMV infection and time after transplantation (model 3); use of lipid-lowering medication, prednisolone dose, calcineurin inhibitor and proliferation inhibitor (model 4); plasma sodium, potassium, uric acid, calcium, phosphate and plasma albumin (model 5); BMI, SBP, LDL-C, HDL-C and triglycerides (model 6) and metabolic syndrome (model 7) did not materially change the association.
Association of diuretic use, thiazide use and loop diuretic use with PTDM development
| No diuretic | Diuretic | ||||||
|---|---|---|---|---|---|---|---|
| Number of events/participants | 23/318 | 31/168 | |||||
| HR (95% CI) | HR (95% CI) | P-value | |||||
| Crude analysis | 1.00 (Ref) | 3.15 (1.84–5.42) | < .001 | ||||
| Model 1 | 1.00 (Ref) | 3.28 (1.84–5.83) | < .001 | ||||
| Model 2 | 1.00 (Ref) | 2.77 (1.50–5.12) | .001 | ||||
| Model 3 | 1.00 (Ref) | 2.62 (1.42–4.82) | .002 | ||||
| Model 4 | 1.00 (Ref) | 3.26 (1.81–5.84) | < .001 | ||||
| Model 5 | 1.00 (Ref) | 2.98 (1.50–5.90) | .002 | ||||
| Model 6 | 1.00 (Ref) | 2.86 (1.57–5.21) | .001 | ||||
| Model 7 | 1.00 (Ref) | 3.09 (1.73–5.50) | < .001 | ||||
| Thiazide | Loop diuretic | Other diuretics | |||||
| Number of events/participants | 23/318 | 10/74 | 17/76 | 4/18 | |||
| 1.00 (Ref) | HR (95% CI) | P-value | HR (95% CI) | P-value | HR (95% CI) | P-value | |
| Crude analysis | 1.00 (Ref) | 2.10 (1.00–4.42) | 0.050 | 4.30 (2.29–8.01) | < .001 | 3.90 (1.35–11.31) | .012 |
| Model 1 | 1.00 (Ref) | 2.63 (1.22–5.65) | .013 | 4.49 (2.24–8.99) | < .001 | 2.35 (0.78–7.08) | 0.128 |
| Model 2 | 1.00 (Ref) | 2.07 (0.90–4.79) | 0.086 | 4.34 (2.05–9.18) | < .001 | 1.70 (0.47–6.18) | 0.419 |
| Model 3 | 1.00 (Ref) | 2.53 (1.05–6.10) | .038 | 3.89 (1.87–8.08) | < .001 | 1.49 (0.41–5.44) | 0.547 |
| Model 4 | 1.00 (Ref) | 2.84 (1.30–6.22) | .009 | 4.10 (2.02–8.31) | < .001 | 2.36 (0.78–7.18) | 0.129 |
| Model 5 | 1.00 (Ref) | 2.34 (0.99–5.55) | 0.054 | 4.09 (1.84–9.07) | .001 | 1.92 (0.47–7.83) | 0.365 |
| Model 6 | 1.00 (Ref) | 2.61 (1.20–5.67) | .015 | 3.98 (1.94–8.19) | < .001 | 1.36 (0.36–5.13) | 0.650 |
| Model 7 | 1.00 (Ref) | 2.56 (1.17–5.61) | .018 | 5.21 (2/54–10.70) | < .001 | 1.98 (0.64–6.10) | 0.236 |
HRs (95% CIs) were derived from Cox proportional hazards models. Significant associations are in bold. Multivariable model 1 was adjusted for age, sex, fasting plasma glucose and HbA1c. Model 2 was adjusted for model 1 variables and alcohol consumption, smoking and physical activity and history of cardiovascular disease. Model 3 was adjusted for model 1 variables and eGFR, urinary albumin excretion, CMV infection and time after transplantation. Model 4 was adjusted for model 1 variables and treatment (lipid-lowering medication, prednisolone dose, calcineurin inhibitors and proliferation inhibitors). Model 5 was adjusted for model 1 variables and plasma sodium, potassium, uric acid, calcium, phosphate and albumin. Model 6 was adjusted for model 1 variables and BMI, SBP, LDL-C, HDL-C and triglycerides. Model 7 was adjusted for model 1 and metabolic syndrome.
CMV, cytomegalovirus.
Next, we performed Cox proportional hazards regression analyses among different types of diuretics (thiazide, loop diuretics and other diuretics) and incident PTDM (Table 3). In crude analyses there was a borderline statistically significant association in the use of thiazide and incident PTDM [HR 2.10 (95% CI 1.00–4.41); P = 0.050]. However, after adjustment for other covariates including age, sex, FPG and HbA1c in model 1, the association reached significance [HR 2.63 (95% CI 1.22–5.65); P = 0.013]. In the final model adjusted for metabolic variables and metabolic syndrome, the association remained significant [HR 2.61 (95% CI 1.20–5.67); P = 0.015 versus HR 2.56 (95% CI 1.17–5.61); P = 0.018]. Furthermore, the use of a loop diuretic was associated with PTDM development in crude analyses [HR 4.30 (95% CI 2.29–8.01); P <0.001], as well as after adjusting for age, sex, FPG, HbA1c and other covariates in models 1–7 (Table 3). Although the use of other diuretics was associated with incident PTDM [HR 3.90 (95% CI 1.35–11.31); P = 0.012], the association lost statistical significance after adjustment for relevant covariates.
Association between dosage and duration of diuretic use with incident PTDM
Among 73 KTRs using low-dose thiazide (hydrochlorothiazide ≤25 mg/day), 10 developed PTDM. The use of low-dose thiazide diuretics was associated with a higher risk of PTDM development compared with no use of diuretics in crude and multivariable Cox proportional hazards regression analyses (Table 4). Because of the small number of patients (n = 1), no meaningful analyses could be performed for high-dose thiazide diuretics (hydrochlorothiazide >25 mg/day).
Association of diuretic dosage and PTDM development
| Thiazide | Loop diuretic | |||||||
|---|---|---|---|---|---|---|---|---|
| Variables | No diuretic | Low-dose | P-value | High-dose | Low-dose | P-value | High-dose | P-value |
| Number of participants/events | 23/318 | 10/73 | 0/1 | 8/40 | 9/36 | |||
| Crude analysis | 1.00 (Ref) | 2.13 (1.01–4.48) | .046 | - | 3.44 (1.53–7.73) | .003 | 5.74 (2.64–12.49) | < .001 |
| Model 1 | 1.00 (Ref) | 2.71 (1.24–5.93) | .012 | - | 3.61 (1.44–9.06) | .006 | 9.28 (3.88–22.20) | < .001 |
| Model 2 | 1.00 (Ref) | 2.46 (1.04–5.83) | .041 | - | 2.46 (0.82–7.33) | 0.110 | 9.74 (3.99–23.74) | < .001 |
| Model 3 | 1.00 (Ref) | 2.53 (1.06–6.02) | .037 | - | 2.64 (1.02–6.96) | .041 | 7.59 (3.07–18.74) | < .001 |
| Model 4 | 1.00 (Ref) | 3.16 (1.39–7.18) | .006 | - | 3.12 (1.19–8.23) | .021 | 8.57 (3.58–20.52) | < .001 |
| Model 5 | 1.00 (Ref) | 2.49 (0.93–6.55) | 0.070 | - | 2.92 (0.99–8.81) | 0.057 | 9.02 (3.17–25.68) | < .001 |
| Model 6 | 1.00 (Ref) | 2.81 (1.26–6.28) | .012 | - | 3.42 (1.31–8.94) | .012 | 10.24 (3.80–27.60) | < .001 |
| Model 7 | 1.00 (Ref) | 2.56 (1.17–5.61) | .018 | - | 4.07 (1.56–10.59) | .004 | 8.27 (3.42–20.01) | < .001 |
HRs (95% CIs) were derived from Cox proportional hazards models. Significant associations are in bold. Multivariable model 1 was adjusted for age, sex, fasting plasma glucose and HbA1c. Model 2 was adjusted for model 1 variables and alcohol consumption, smoking and physical activity and history of cardiovascular disease. Model 3 was adjusted for model 1 variables and eGFR, urinary albumin excretion, CMV infection and time after transplantation. Model 4 was adjusted for model 1 variables and treatment (lipid-lowering medication, prednisolone dose, calcineurin inhibitors and proliferation inhibitors). Model 5 was adjusted for model 1 variables and plasma sodium, potassium, uric acid, calcium, phosphate and albumin. Model 6 was adjusted for model 1 variables and BMI, SBP, LDL-C, HDL-C and triglycerides. Model 7 was adjusted for model 1 and metabolic syndrome.
Low-dose thiazide: hydrochlorothiazide ≤25 mg/day; high-dose thiazide: hydrochlorothiazide >25 mg/day; low-dose loop diuretic: furosemide ≤40 mg/day or bumetanide ≤1 mg/day; high-dose loop diuretic: furosemide >40 mg/day or bumetanide >1mg /day.
CMV, cytomegalovirus.
Among 40 KTRs using low-dose loop diuretics (furosemide ≤40 mg/day or bumetanide ≤1 mg/day), 8 developed PTDM and among 36 KTRs using high-dose loop diuretics (furosemide >40 mg/day or bumetanide >1 mg /day), 9 developed PTDM. Both low- and high-dose use of loop diuretics were associated with incident PTDM in crude analyses and adjusted models (Table 4), with a lower point estimate of the HR for KTRs using low-dose loop diuretics compared with KTRs using high-dose loop diuretics.
Among 155 subjects with available data on the duration of diuretic use, 149 KTRs (88%) used diuretics for ≥6 months, with a median use of 3.9 years (IQR 1.8–6.8). The association between the use of any diuretic ≥6 months with incident PTDM remained materially unchanged compared with the main results (Table 5).
Association of diuretic use in KTRs using diuretics for >6 months with PTDM development
| Diuretic use before the baseline | |||
|---|---|---|---|
| Variables | No diuretic | ≥6 months | P-value |
| Number of | |||
| participants/events | 23/318 | 26/149 | |
| Crude analysis | 1.00 (Ref) | 2.93 (1.67–5.15) | <0.001 |
| Model 1 | 1.00 (Ref) | 2.94 (1.61–6.37) | <0.001 |
| Model 2 | 1.00 (Ref) | 2.53 (1.34–4.78) | 0.004 |
| Model 3 | 1.00 (Ref) | 2.30 (1.21–4.36) | 0.011 |
| Model 4 | 1.00 (Ref) | 2.96 (1.60–5.46) | 0.001 |
| Model 5 | 1.00 (Ref) | 2.27 (1.09–4.70) | 0.028 |
| Model 6 | 1.00 (Ref) | 2.59 (1.38–4.85) | 0.003 |
| Model 7 | 1.00 (Ref) | 2.76 (1.51–5.05) | 0.001 |
HRs (95% CIs) were derived from Cox proportional hazards models. Significant associations are in bold. Multivariable model 1 was adjusted for age, sex, fasting plasma glucose and HbA1c. Model 2 was adjusted for model 1 variables and alcohol consumption, smoking and physical activity and history of cardiovascular disease. Model 3 was adjusted for model 1 variables and eGFR, urinary albumin excretion, CMV infection and time after transplantation. Model 4 was adjusted for model 1 variables and treatment (lipid-lowering medication, prednisolone dose, calcineurin inhibitors and proliferation inhibitors). Model 5 was adjusted for model 1 variables and plasma sodium, potassium, uric acid, calcium, phosphate and albumin. Model 6 was adjusted for model 1 variables and BMI, SBP, LDL-C, HDL-C and triglycerides. Model 7 was adjusted for model 1 and metabolic syndrome.
CMV, cytomegalovirus.
Association between diuretic use with incident PTDM among men and women
To find potential effect modifications, we tested for interactions by sex, age, BMI, SBP, glucose, HbA1c, time after transplantation, eGFR, metabolic syndrome and diuretic use. We found a significant modification by sex (P = 0.032). Next, we performed further Cox regression analyses to discern the associations between using diuretics separately in men and women with incident PTDM (Supplementary data, Table S1). Among 278 men and among 208 women. 33 and 21 individuals, respectively, developed PTDM. In crude analyses, there was no significant association between diuretic use and the development of PTDM in men. However, after adjustment for covariates in model 1, the association became statistically significant. The use of a diuretic was associated with incident PTDM in women in both crude analyses and adjusted models.
Association between laboratory-confirmed hydrochloro-thiazide and loop diuretic use and incident PTDM
Urine metabolomics analyses yielded molecular evidence of hydrochlorothiazide use in 76 subjects and loop diuretic use in 96 subjects (90 furosemide and 6 bumetanide). In two subjects, both furosemide and hydrochlorothiazide metabolites were detected and they were excluded from the analyses. We performed Cox proportional hazards regression analyses for laboratory-confirmed diuretic use and incident PTDM (Supplementary data, Table S2). First, we found that laboratory-confirmed diuretic use was associated with incident PTDM after adjustment for age, sex, glucose, HbA1c and other potential confounders, including lifestyle, family history of cardiovascular disease, use of other medications, kidney function, transplantation-specific parameters, BMI, lipids, blood pressure and metabolic syndrome. The association between laboratory-confirmed hydrochlorothiazide use and incident PTDM remained the same as our main results in crude and multivariable-adjusted analyses. Moreover, laboratory-confirmed loop diuretics use remained significantly associated with the risk of PTDM [HR 2.99 (95% CI 1.63–5.49); P <0.001]. This finding remained materially unchanged in further multivariable analyses (Supplementary data, Table S2).
Sensitivity analyses of diuretic use and PTDM
In sensitivity analyses with 168 diuretic users and 168 non-diuretic users matched by age and sex, the association between the use of any diuretic, a thiazide and a loop diuretic with incident PTDM remained the same as our main results (Supplementary data, Table S3).
Other anti hypertensive medications and PTDM
We performed Cox proportional hazards regression analyses for other types of antihypertensive medications use [beta-blockers, renin-angiotensin-aldosterone system inhibitors, angiotensin-converting enzyme (ACE) inhibitors, angiotensin II receptor blockers (ARBs) and calcium channel blockers (CCBs)] and incident PTDM (Supplementary data, Figure S2). We did not find any associations between these classes of antihypertensive medications and the risk for PTDM development after adjustment for age, sex and metabolic variables (FPG, HbA1c, BMI, SBP, HDL-C, LDL-C and triglycerides).
DISCUSSION
In this study we demonstrated that the use of diuretics by KTRs is associated with an increased risk of long-term PTDM development. The association between diuretic use and incident PTDM remained independent of potential confounders including FPG, HbA1c, lifestyle, use of other medications such as immunosuppressive medication, kidney function, transplantation-specific parameters, BMI, lipids and blood pressure. KTRs using a thiazide or a loop diuretic were at higher risk of PTDM development as compared with KTRs who were not using diuretics.
Diuretic use was previously reported to be associated with an increased risk of type 2 diabetes in the general population [7, 8, 19, 20]. The effect of diuretics on the incidence of new-onset diabetes was examined in large outcome trials. The Intervention as a Goal in Hypertension Treatment (INSIGHT) study found that the incidence of new-onset diabetes was higher in patients who used diuretics than patients who used the calcium antagonist nifedipine, after about 4 years of follow-up [7]. In the Second Australian National Blood Pressure Study (ANBP2), elderly individuals on diuretics (mainly hydrochlorothiazide) had a higher risk of developing diabetes compared with individuals on ACE inhibitors [21]. Thus diuretics have a potential adverse effect on glucose metabolism and will increase the risk of new-onset diabetes, especially in individuals with metabolic syndrome [22].
Metabolic alterations in KTRs are characterized by the clustering of insulin resistance, dyslipidaemia and hypertension, all being risk factors of PTDM development [23–25]. Because of the adverse effects of PTDM, there is a great clinical need to find modifiable factors that may put patients at risk for developing diabetes. While current guidelines do not recommend the use of any specific class of antihypertensive agent after kidney transplantation [26], diuretics are commonly used to treat hypertension or fluid overload in KTRs [11]. In a retrospective study of 303 KTRs, diuretic use was a modifiable risk factor associated with a 2.5 times increased risk of PTDM development during the first year after transplantation in a multivariable analysis, along with other variables including age, family history of diabetes and smoking habits [27]. We investigated the association between diuretic use and PTDM development in a larger KTR population with a longer follow-up beyond the first year after transplantation. In addition, we specifically assessed two main types of diuretics (thiazide and loop diuretics) separately. In line with our findings, a high incidence of glucose intolerance in KTRs has been reported in association with furosemide treatment [28].
Apart from observational studies that demonstrated the association between diuretic use and incident new-onset diabetes, many clinical studies have investigated pathophysiological changes that occur due to a reduction in insulin sensitivity, secondary to diuretic-induced hypokalaemia [8–10]. While elevated free fatty acid levels and enhanced hepatic glucose production could be other possible mechanisms resulting in thiazide-induced hyperglycaemia [29, 30], reduction of glucose phosphorylation and glycolysis rates in muscle tissue, as well as inhibition of glucose transport in adipose tissue, may explain furosemide-induced hyperglycaemia [31]. Although it was found that the risk of developing potassium disturbances is increased by the use of thiazide in KTRs in the short term, the association between thiazide and the development of hyperglycaemia has not been studied previously [32]. In addition, diuretics can cause hyperuricaemia and hypomagnesaemia, which were found to be associated with an increased risk of new-onset diabetes both in the general population and in KTRs [33–36]. Although serum uric acid was higher in KTRs using diuretics, we could not find any indirect effect of serum uric acid, serum magnesium or serum potassium on the development of PTDM elicited by using diuretics. Thus we were unable to conclude causality for these potential pathways in the current study. Interventional studies are required to compare the effect of antihypertensive agents on glucose haemostasis.
Diuretic dose and duration of treatment may affect the incidence of drug-induced hyperglycaemia [7, 8, 20]. We observed a higher risk of PTDM development in KTRs using high-dose loop diuretics compared with KTRs using low-dose diuretics, which is consistent with a dose–effect relationship. Our findings were consistent for KTRs with ≥6 months diuretic exposure. Because of the small number of KTRs using diuretics for <6 months, we were unable to perform meaningful analyses for exposures of shorter duration.
The association between diuretic use and incident PTDM was stronger in women than in men. This could be the consequence of sex-related differences in the pharmacokinetics and pharmacodynamics of diuretics. Female sex is a risk factor for adverse effects including hypokalaemia and hyperglycaemia, because of lower distribution volume, higher activity of hepatic CYP3A4 and the presence of sex hormones [37].
The agreement between subjective self-reported drug use and objective laboratory-obtained information (metabolomics) was good (82% and 92% for thiazide and loop diuretics, respectively). The slight disagreement can likely be explained by recall bias for self-reported data [38] and analytical bias for metabolomics data [13]. Still, although the concept of providing molecular evidence of drug use is not commonly used, we were able to use metabolomics to confirm our finding of an association with the development of PTDM, thereby strengthening our main results, which relied on self-reported information.
While the effect of other antihypertensive medications on glycaemic control and incident type 2 diabetes have been investigated in previous epidemiological studies in the general population, we also took into account the association between other types of antihypertensive drugs and incident PTDM in further analyses. The broad conclusion of previous studies is that beta-blockers may increase the risk of incident of type 2 diabetes, while ACE inhibitors, ARBs and CCBs have neutral or beneficial effects on glycaemic control and incident type 2 diabetes [3, 4, 6]. Similarly, we did not find any significant association between ACE inhibitors, ARBs and CCBs, but we also found no association between the use of beta-blockers and PTDM in the KTRs studied.
Our study was carried out in a relatively large population of stable KTRs in which the endpoint evaluation was completed after 5.2 years of follow-up. KTRs with transient post-transplantation hyperglycaemia were excluded from our study by including only KTRs with a functioning graft >1 year after transplantation. This study was an observational study in which casualty could not be explained.
In conclusion, diuretic use is associated with an increased risk of developing PTDM over the long term in KTRs, independent of several established risk factors for PTDM development, including metabolic factors, lifestyle, immunosuppressive therapy and kidney function, transplantation-specific and electrolyte parameters. Moreover, the association was consistent for both thiazide (low-dose) and loop diuretics (both low- and high-dose). Although future interventional studies are needed to confirm causality, these results call for careful evaluation of the necessity of diuretics use in KTRs.
AUTHORS’ CONTIBUTIONS
S.S. and S.J.L.B. drafted the manuscript and researched the literature. S.S, S.C.T. and S.J.L.B. contributed to the statistical analysis. S.S., F.K., D.M., R.M.D., G.H. and S.J.L.B. collected the epidemiological and clinical data. H.J.L.H. and S.J.L.B. contributed to funding acquisition. R.P.F.D., H.J.L.H. and S.J.L.B supervised the study. S.S., F.K., S.C.T., D.M., R.M.D., G.H., R.P.F.D., H.J.L.H. and S.J.L.B. contributed to writing, reviewing and editing the manuscript. All authors read and approved the final version of the manuscript.
FUNDING
This project has received funding from the European Union's Horizon 2020 research and innovation programme under Marie Sklodowska-Curie grant agreements 754 425 and 887 661.
CONFLICT OF INTEREST STATEMENT
The authors declare no conflicts of interest.


Comments