


ABSTRACT
The most common definition of delayed graft function (DGF) relies on dialysis during the first week post-transplant and does not consider DGF severity. The impact of DGF severity on long-term graft outcome remains controversial.
We analysed 627 deceased-donor kidney transplant recipients (KTRs) transplanted in 2005–2015 at our centre for DGF severity, associated risk factors and long-term consequences of DGF.
We found 349 (55.7%) KTRs with DGF, which were classified into four groups according to DGF duration (0–1, 2–7, 8–14, >14 days) and were compared with KTR with no DGF. A longer duration of DGF was associated with progressive worsening of 10-year death-censored graft survival {no DGF: 88.3% [95% confidence interval (CI) 82.4–94.2]; 0–1 day: 81.3% [95% CI 68.2–94.4], 2–7 days: 61.5% [95% CI 43.1.1–79.9], 8–14 days: 66.6% [95% CI 47.4–85.8], >14 days: 51.2% [95% CI 33–69.4]; P < 0.001}. In kidneys with a Kidney Donor Profile Index (KDPI) ≥85%, all DGF severity groups demonstrated reduced graft survival. However, in the <85% KDPI kidneys, only >14 days DGF duration showed worse outcomes.
DGF had a duration-dependent effect on graft survival, which varied depending on the KDPI. Of note, 0- to 1-day DGF showed comparable results to no DGF in the whole cohort.
What is already known about this subject?
• The impact of delayed graft function (DGF) in kidney transplant recipients (KTRs) on long-term graft outcomes remains controversial. The most common definition of DGF relies on dialysis during the first week post-transplant and does not consider DGF severity.
What this study adds?
• This article describes the impact of DGF severity on graft outcomes in relation to donor kidney quality assessed by the Kidney Donor Profile Index (KDPI) and its clinical consequences in the long term. DGF has been shown to have a duration-dependent effect on graft survival that varies depending on the KDPI. However, short-term DGF (0–1 days) demonstrated comparable results to no DGF. Patients with longer DGF had more burdensome consequences.
What impact this may have on practice or policy?
• Our study may have important implications for clinical studies on prevention and treatment of DGF.
INTRODUCTION
Kidney transplantation is the treatment of choice for many patients with kidney failure. However, in the immediate post-transplant period, delayed graft function (DGF) is a serious complication that may lead to prolonged hospitalization, increased risk of rejection and ultimately graft failure [1–7]. DGF occurs primarily in deceased donor kidneys and is influenced by various recipient [8] and donor factors [5] as well as cold ischaemia time (CIT) [9]. Rates of DGF vary widely from country to country, ranging from 21 to 70% [3, 4, 10–12]. DGF can be defined in multiple ways; the most frequent and widely accepted definition is at least one dialysis in the first week post-transplant. However, this definition has many limitations, as it comprises a broad range of pathophysiologic entities ranging from rather transient issues such as hyperkalaemia or hypervolaemia to severe vascular complications, ischaemia–reperfusion injury and immunologic causes [2, 10, 13–15]. Furthermore, other medical aspects such as intraoperative fluid load, treatment regimes, potassium thresholds, reimbursement and local habits may influence the indication for dialysis [16]. Attempts to find better definitions for DGF have not been successful so far [14, 15]. In addition, the immunosuppressive regimens, organ quality and allocation policies have changed in recent years [17, 18]. In particular, the proportion of extended criteria donor (ECD) kidneys has substantially increased during the last decade in the USA [10, 19, 20] and Eurotransplant region [21]. In 2014, the Kidney Donor Profile Index (KDPI) was introduced to improve organ utilization and refine organ quality assessment. A donor KDPI ≥85% was originally considered to be comparable to an ECD kidney [17, 22, 23].
Although valuable risk prediction models have been developed to calculate the individual risk for DGF based on a variety of donor characteristics [20], the long-term effects of DGF are still poorly studied. Most studies on long-term effects and risk factors have relied on the dichotomous definition of DGF, limiting interpretation of the results [24]. This calls for alternative endpoints in clinical studies dealing with DGF and a more granular assessment of DGF [19]. DGF duration as a measure of severity [2, 13, 25] might be useful to gain better insights in to the long-term effects of DGF. In this study we aimed to analyse DGF severity groups, risk factors and long-term consequences in relation to donor kidney quality factors.
MATERIALS AND METHODS
Study subjects
This retrospective single-centre study included 627 deceased donor kidney recipients transplanted in 2005–2015 at Charité, Campus Mitte, Berlin, Germany. Patient characteristics, outcomes and adverse events (hospitalizations, cardiovascular events, infections, rejections) were analysed with respect to DGF and the severity of DGF. Transplant outcome was followed until 2016. Clinical data were retrieved from the electronic patient database TBase [26] and clinical charts yielding complete data sets. The kidney grafts were allocated through the Eurotransplant allocation system and preserved in static cold storage after procurement. The institutional ethics committee approved all study procedures (EA 1/048/14).
Definitions
DGF was defined as at least one dialysis procedure within the first week post-transplant. To assess the severity of DGF, we calculated the time from transplantation to the last dialysis and the number of sessions performed within that time. In case of peritoneal dialysis, a session was defined as at least one bag change per day. The cohort was subsequently differentiated into a comparator (no DGF) and four DGF severity groups based on clinical grounds: group A, 0–1 day DGF; group B, 2–7 days DGF; group C, 8–14 days DGF; and group D, >14 days DGF.
Borderline findings and acute rejections [Banff Classification of Allograft Pathology (Banff) ≥Ia or antibody-mediated rejection (ABMR)] on biopsy were recorded according to the Banff 2013 criteria [27]. For calculation of KDPI for deceased donors, the Organ Procurement and Transplantation Network (OPTN) calculation and mapping table referring to the median donor of 2017 was used [28, 29]. Graft failure was defined as reinitiation of dialysis, allograft nephrectomy or retransplantation. Hospitalization events were evaluated with respect to number, length and cause. Events that met both clinical (fever, symptoms) and laboratory (leucopaenia, leucocytosis, elevated inflammatory markers) criteria of an infection or where a germ (viral, bacterial or fungal) was identified and treated as such were documented as infectious events. A major adverse cardiac and cerebrovascular event (MACCE) was defined as cardiac death, non-fatal myocardial infarction, coronary revascularization procedure or non-fatal stroke. Estimated glomerular filtration rate (eGFR) were calculated by the Chronic Kidney Disease Epidemiology Collaboration (CKD-EPI) equation [30] and imputed by a GFR of 0 mL/min/m2 for patients with graft loss.
Immunosuppression
Most patients initially received a standard immunosuppression including induction with an anti-interleukin-2 receptor antibody, a calcineurin inhibitor, mycophenolate and steroids. A minority of patients received other immunosuppression within clinical trials. Tapering of steroids was performed with the intention of achieving a steroid-free regimen after the first year, if no rejection episodes had occurred.
Treatment of rejection episodes
Treatment decisions were based on clinically indicated biopsies and the clinical course. Zero or protocol biopsies are not routinely performed at our centre. Acute rejection Banff ≥Ia was treated with 3 × 500 mg methylprednisolone and a steroid taper. In case of severe rejection, Banff ≥IIa or steroid-resistant acute rejection, antithymocyte globulin could be added to the regimen. Borderline rejections were treated with 3 × 250 mg methylprednisolone and a steroid taper. ABMR treatment regimens included intravenous immunoglobulin, rituximab [31], cyclophosphamide and plasmapheresis [32].
Data analysis
Donor and recipient characteristics, hospital days, cardiovascular and infectious events are presented as mean with standard deviation (SD) or, in case of non-normal distribution, as median with interquartile range (IQR; 25th–75th percentile). Statistical significance of the differences between groups for continuous variables was tested using Student's t-test or Mann–Whitney U test in case of a non-parametric distribution and chi-squared test for categorical variables. Fisher's exact test was used to analyse binary data. Data were analysed by the chi-squared test, analysis of variance and t-tests for independent variables. In case of a non-parametric distribution, the Kruskall–Wallis test was used. The significance level was set to α = 0.05 and was not adjusted for multiple testing. Kaplan–Meier (pooled and pairwise analysis) and logistic as well as Cox regression analyses were performed to determine predictors for DGF, adverse events and graft and patient survival with a confidence interval of 95%. Standard multivariable logistic and Cox regression analysis included age, male sex, mismatches, time on dialysis, CIT, recipient body mass index (BMI)–donor BMI match index, recipient diabetes, donor age, donor creatinine, donor hypertension, donor diabetes, retransplantation, borderline rejection on biopsy reading ≤30 days post-transplant or biopsy-proven acute rejection (BPAR) (Banff ≥ Ia) at ≤30 days. To account for time-dependent bias in the multiple Cox regression analysis for graft loss, events within the first 30 days after transplantation were formally excluded (zero events). There was no substitution for missing data in this analysis. SPSS 25 for Windows (IBM, Armonk, NY, USA) was used for statistical analysis.
RESULTS
Cohort characteristics and severity of DGF
From 2005 to 2015, 646 adult patients received a deceased-donor kidney transplant, of whom 19 (2.9%) experienced primary and persistent non-function and were excluded from further analysis. DGF occurred in 349 of 627 (55.7%) patients. The mean follow-up time of the entire cohort was 6 ± 3 years, with complete follow-up data available for each patient for the critical endpoints. Table 1 lists patient characteristics. In the DGF group, the median time to last dialysis was 5 days (IQR 2–13) and a median of 3 dialysis sessions (IQR 1–6) were performed. For quantification of DGF severity, the patients were grouped into four DGF severity classes, based on the number of days to last dialysis: 0–1 day DGF (group A, n = 77), 2–7 days (group B, n = 131), 8–14 days (group C, n = 70) and >14 days (group D, n = 71). The mean recipient and donor age and the KDPI tended to be higher in groups with longer graft dysfunction, but did not reach significance levels (Table 2). The proportion of recipients and donors ≥65 years of age, human leucocyte antigen (HLA) mismatches, diabetes and donor creatinine were similar in all groups. Groups with longer DGF showed a significantly higher proportion of retransplantation, longer time on dialysis prior to transplantation and longer CIT. In the short-term DGF group (0–1 day), the main cause of dialysis was hyperkalaemia (64.9%), followed by slow graft function defined by the treating physician (15.6%), a combination of both (11.7%) and cases of fluid overload (6.5%) (Supplementary data, Table S1).
Patient characteristics
| Characteristics | No DGF | DGF | P |
|---|---|---|---|
| Patients, n (%) (cohort: N = 627) | 278 (44.3) | 349 (55.7) | |
| Recipient factors | |||
| Recipient age (years), mean (SD) | 53.7 (13.3) | 54.9 (13.6) | 0.263 |
| Recipients ≥65 years, n (%) | 81 (29.1) | 115 (33) | 0.340 |
| Male, n (%) | 142 (51.1) | 219 (62.8) | 0.003 |
| Retransplantation, n (%) | 22 (7.9) | 56 (16) | <0.001 |
| Time on dialysis (months), median (IQR) | 62 (32–90) | 75 (49–99) | <0.001 |
| Dialysis use (haemodialysis), n (%) | 236 (84.9) | 342 (98) | <0.001 |
| Dialysis use (peritoneal dialysis), n (%) | 38 (13.7) | 7 (2.0) | <0.001 |
| Dialysis use (pre-emptive), n (%) | 4 (1.4) | 0 | <0.001 |
| HLA mismatches, mean (SD) | 2.4 (1.7) | 2.8 (1.7) | 0.004 |
| CIT (hours), median (IQR) | 10.6 (7.6–14.1) | 11.7 (8.1–15.5) | 0.013 |
| Diabetes (all types), n (%) | 36 (12.9) | 42 (12) | 0.808 |
| Body mass index, median (IQR) | 24.6 (22–27.8) | 25.6 (23.2–29.7) | <0.001 |
| Donor factors | |||
| Age (years), mean (SD) | 53.6 (15.8) | 55.4 (15.5) | 0.149 |
| Donors ≥65 years, n (%) | 84 (30.2) | 115 (33) | 0.49 |
| Donor BMI, median (IQR) | 25.7 (23.8–27.7) | 26 (24.2–27.8) | 0.041 |
| Recipient–donor BMI match index, median (IQR) | 0.95 (0.83–1.13) | 0.99 (0.87–1.15) | 0.042 |
| Donor creatinine at transplantation, median (IQR) | 0.86 (0.68–1.15 | 0.93 (0.71–1.34 | 0.047 |
| KDRI 2017, median (IQR) | 1.39 (1.1–2.1) | 1.49 (1.2–2.1) | 0.052 |
| KDPI 2017, median (IQR) | 64 (38–93) | 71 (48–94) | 0.055 |
| Primary immunosuppression at transplantation, n (%) | |||
| Tacrolimus | 129 (46.4) | 162 (46.4) | 1.0 |
| Ciclosporine | 135 (48.6) | 181 (51.9) | 0.422 |
| Mammalian target of rapamycin inhibitor | 6 (2.2) | 4 (1.1) | 0.351 |
| Belatacept | 6 (2.2) | 2 (0.6) | 0.148 |
| Mycophenolic acid | 260 (93.5) | 341 (97.7) | 0.014 |
| Others | 20 (7.2) | 8 (2.3) | 0.005 |
| Steroids | 278 (100) | 349 (100) | |
Selected patient characteristics for DGF severity groups
| Characteristics | No DGF | Group A (0–1 days) | Group B (2–7 days) | Group C (8–14 days) | Group D (>14 days) | |
|---|---|---|---|---|---|---|
| N | (n = 278) | (n = 77) | (n = 131) | (n = 70) | (n = 71) | P-value |
| Recipient factors | ||||||
| Age (years), mean (SD) | 53.7 (13.3) | 51.3 (14.9) | 55.4 (12.6) | 56.7 (13.5) | 56.3 (13.4) | 0.068 |
| Recipients ≥65 years, n (%) | 81 (29.1) | 18 (23.4) | 44 (33.6) | 28 (40.0) | 25 (35.2) | 0.186 |
| Male, n (%) | 142 (51.1) | 56 (72.7) | 79 (60.3) | 42 (60.0) | 42 (59.2) | 0.012 |
| Retransplantation, n (%) | 22 (7.9) | 9 (11.7) | 20 (15.3) | 9 (12.9) | 18 (25.4) | 0.003 |
| Time on dialysis (months), median (IQR) | 62.3 (33–90) | 81.4 (52–109) | 63.5 (45–89) | 77.6 (48–97) | 84.0 (51–108) | <0.001 |
| HLA mismatches, mean (SD) | 2.4 (1.7) | 2.6 (1.6) | 2.9 (1.8) | 3.1 (1.6) | 2.6 (1.6) | 0.019 |
| CIT (hours), median (IQR) | 10.6 (7.6–14.1) | 9.4 (7.5–13.3) | 11.7 (8–15.0) | 11.9 (8.8–17.4) | 12.2 (9.2–15.6) | 0.003 |
| Diabetes (all types), n (%) | 36 (12.9) | 12 (15.6) | 11 (8.4) | 9 (12.9) | 10 (14.1) | 0.529 |
| Donor factors | ||||||
| Age (years), mean (SD) | 53.6 (15.8) | 54.0 (15) | 55.0 (16.0) | 56.6 (15.6) | 56.2 (15.3) | 0.499 |
| Donors ≥65 years, n (%) | 84 (30.2) | 19 (24.7) | 45 (34.4) | 28 (40.0) | 23 (32.4) | 0.319 |
| Donor creatinine at transplantation, median (IQR) | 0.86 (0.68–1.15) | 0.93 (0.7–1.3) | 0.92 (0.68–1.39) | 1.0 (0.72–1.3) | 0.90 (0.77–1.37) | 0.177 |
| KDRI 2017, median (IQR) | 1.39 (1.08–2.06) | 1.45 (1.15–1.96) | 1.44 (1.14–2.13) | 1.55 (1.25–2.13) | 1.63 (1.28–2.12) | 0.081 |
| KDPI 2017, median (IQR) | 64 (37.5–93) | 68 (45–91) | 68 (44–94) | 75 (54–94) | 79 (56–94) | 0.088 |
| Number of dialyses, median (IQR) | – | 1 (1–1) | 2 (1–3) | 5 (4–6) | 10 (8–13) | <0.001 |
Risk factors for DGF
Risk factors for DGF were analysed in a multivariable analysis (Table 3). Multivariable modelling revealed male sex, retransplantation, longer time on dialysis, extended CIT and higher donor creatinine as significant risk factors for the development of DGF. However, the strongest risk factors were shown to be BPAR (Banff ≥Ia) and borderline rejection ≤30 days post-transplant. The number of BPARs within the first 30 days was 7 (2.5%) in the no DGF versus 46 (13.2%) in DGF patients (P < 0.001); the incidence of borderline readings on biopsy in the first 30 days post-transplant was 3 (1.1%) in the no DGF group versus 35 (10.0%) in the DGF group (P < 0.001). To further investigate the association of rejections with DGF, we analysed BPARs over time (Figure 1B) and by DGF severity (Figure 1C). Patients with DGF had significantly more BPARs, with a peak early after transplantation. In the DGF groups with prolonged graft dysfunction >8 days, the majority of rejections occurred early after-transplant, whereas patients with only 1-day DGF had almost an identical BPAR rate compared with the no DGF group. At 30 days post-transplant, 7 (2.5%) patients in the no DGF group versus 0 (0%) in group A versus 11 (8.4%) in group B versus 15 (21.4%) in group C versus 20 (28.2%) in group D (P < 0.001) experienced BPAR. At 1 year, BPAR had been diagnosed in 25 (9%) patients in the no DGF group and 8 (10.4%) in group A, 25 (19.1%) in group B, 21 (30.0%) in group C and 24 (33.8%) in group D (P < 0.001).
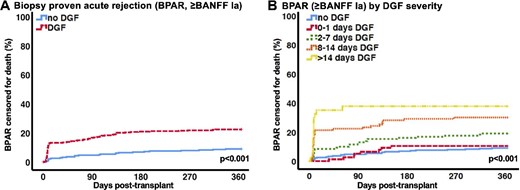
(A) BPAR ≥Banff Ia censored for death. (B) BPAR ≥Banff Ia censored for death by DGF severity.
Estimates of predictors for DGF using a logistic regression model
| Multivariate analysis* | ||
|---|---|---|
| Predictors | OR (95% CI) | P-value |
| Recipient factors | ||
| Recipient age (per year) | 1.00 (0.98–1.02) | 0.921 |
| Recipient male | 0.63 (0.44– 0.90) | 0.011 |
| Prior kidney transplantation | 2.00 (1.11–3.63) | 0.022 |
| Time on dialysis (per month) | 1.01 (1.00–1.01) | 0.001 |
| CIT (per hour) | 1.07 (1.02–1.11) | 0.001 |
| HLA mismatches (per mismatch) | 1.11 (0.99–1.25) | 0.093 |
| Recipient diabetes | 1.53 (0.92–2.56) | 0.104 |
| Donor factors | ||
| Donor age (per year) | 1.01 (1.00–1.03) | 0.115 |
| Recipient-donor BMI match index | 1.91 (0.84–4.36) | 0.125 |
| Median donor creatinine (mg/dL) | 1.32 (1.05–1.65) | 0.016 |
| Donor diabetes | 0.78 (0.45–1.36) | 0.385 |
| Donor hypertension | 1.23 (0.82–1.83) | 0.318 |
| Other | ||
| Borderline reading on biopsy ≤30 days post-transplant | 8.23 (2.43–27.87) | 0.001 |
| BPAR ≤30 days post-transplant | 4.65 (1.99–10.88) | <0.001 |
Standard multiple analysis adjusting for age, recipient male sex, prior kidney transplantation, time on dialysis, CIT, mismatches, recipient diabetes, donor age, recipient BMI–donor BMI match index, donor creatinine, donor diabetes, donor hypertension, borderline reading on clinically indicated biopsy ≤30 days post-transplant, BPAR ≤30 days post-transplant ≥Banff Ia.
Patient and graft outcomes
After 10 years, patients without DGF showed significantly superior outcomes for living with a functioning graft and death-censored graft survival (DCGS). Kaplan–Meier estimates of patients living with a functioning graft and DCGS by DGF status are listed in Table 4. Kaplan–Meier curves are depicted in Figure 2A and C. Analysis for DGF severity revealed gradually worse 10-year outcomes for living with a functioning graft and 10-year DCGS (Table 4 and Figure 2B and D). Of note, in patients receiving kidneys with a KDPI <85%, the no DGF and DGF groups A–C demonstrated similar DCGS, while patients with an extended period of DGF >14 days had inferior outcomes (Table 4 and Figure 2C). Conversely, all DGF groups with the exception of group A (0–1 day DGF) had significantly worse DCGS in extended criteria kidneys with a KDPI ≥85% (Table 4 and Figure 2F). To account for transient causes of graft dysfunction, additional analysis of severity and duration of DGF revealed similar DCGS over 10 years in patient groups requiring <3 or ≥3 dialysis sessions in the first week after transplantation. Patients with ≥3 dialysis sessions and >7 days of sustained DGF had significantly worse DCGS (Supplementary data, Figure S1 and Table S2).
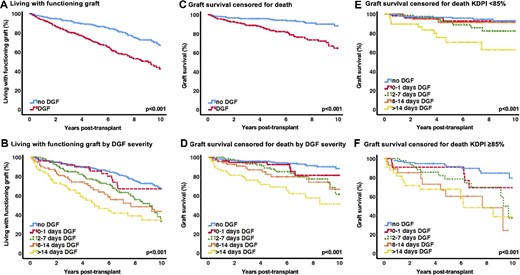
(A) Living with a functioning graft. (B) Living with functioning graft by DGF severity. (C) Graft survival censored for death. (D) Graft survival censored for death by DGF severity. (E) Graft survival censored for death, KDPI <85%. (F) Graft survival censored for death, KDPI ≥85%.
Kaplan–Meier estimates 10 years post-transplant for living with a functioning graft and graft survival censored for death by DGF status, DGF severity and KDPI groups
| Living with a functioning graft | Graft survival censored for death | |
|---|---|---|
| Survival % (95% CI) | Survival % (95% CI) | |
| By DGF status | ||
| No DGF | 67.0 (58.8–75.2) | 88.3 (82.4–94.2) |
| DGF | 42.3 (33.9–50.7) | 64.8 (55.6–74.0) |
| By DGF severity | ||
| No DGF | 67.0 (58.8–75.2) | 88.3 (82.4–94.2) |
| Group A (0–1 day) | 67.0 (51.9–82.1) | 81.3 (68.2–94.4) |
| Group B (2–7 days) | 33.2 (17.7–48.7) | 61.5 (43.1–79.9) |
| Group C (8–14 days) | 43.6 (27.1–60.1) | 66.6 (47.4–85.8) |
| Group D (>14 days) | 34.5 (20.2–48.8) | 51.2 (33–69.4) |
| KDPI <85% | KDPI ≥85% | |
| Survival % (95% CI) | Survival % (95% CI) | |
| Death-censored graft survival by KDPI group | ||
| No DGF | 93.0 (88.1–97.9) | 79.3 (66.0–92.6) |
| Group A (0–1 day) | 92.7 (84.3–100) | 69.2 (45.9–92.5) |
| Group B (2–7 days) | 82.2 (70.8–93.6) | 37.3 (8.5–66.1) |
| Group C (8–14 days) | 91.3 (81.7–100) | 24.1 (0–60.2) |
| Group D (>14 days) | 62.7 (41.7–83.7) | 38.6 (11.9–65.3) |
Kaplan–Meier estimates 10 years post-transplant. The logrank test showed a P-value < 0.001 for each analysis. KDPI = Kidney Donor Profile Index—calculation based on the reference donor kidney 2017.
Multivariable analysis for predictors of death-censored graft loss showed a significant association with donor hypertension and a gradual increasing risk with DGF severity. Notably, short-term DGF (0–1 day) demonstrated a comparable risk for death-censored graft loss as the no DGF group (Table 5).
Estimates of predictors for graft loss using a Cox proportional hazards model
| Multivariate analysis* | ||
|---|---|---|
| Predictors | HR (95% CI) | P-value |
| Recipient factors | ||
| Recipient age (per year) | 1.00 (0.98–1.03) | 0.894 |
| Recipient male | 1.18 (0.75–1.86) | 0.466 |
| Prior kidney transplantation | 1.31 (0.66–2.58) | 0.442 |
| Time on dialysis (per month) | 1.00 (0.99–1.00) | 0.473 |
| CIT per hour | 0.99 (0.95–1.04) | 0.687 |
| HLA mismatches (per mismatch) | 1.06 (0.91–1.24) | 0.434 |
| Recipient diabetes | 0.92 (0.52–1.64) | 0.776 |
| Donor factors | ||
| Donor age (per year) | 1.02 (1.00–1.04) | 0.060 |
| Recipient-donor BMI match index | 2.31 (0.88–6.05) | 0.088 |
| Median donor creatinine (mg/dL) | 0.85 (0.63–1.15) | 0.298 |
| Donor hypertension | 1.90 (1.16–3.11) | 0.011 |
| Donor diabetes | 1.07 (0.59–1.93) | 0.830 |
| Other | ||
| Reference: no DGF | ||
| DGF 0–1 day | 1.90 (0.81–4.43) | 0.139 |
| DGF 2–7 days | 2.58 (1.37–4.86) | 0.003 |
| DGF 8–14 days | 3.44 (1.64–7.23) | 0.001 |
| DGF > 14 days | 5.83 (2.97–11.46) | <0.001 |
| BPAR ≤30 days post-transplant | 1.21 (0.65–2.25) | 0.553 |
Standard multiple analysis adjusting for age, recipient male sex, prior kidney transplantation, time on dialysis, CIT, mismatches, recipient diabetes, donor age, recipient BMI–donor BMI match index, donor creatinine, donor hypertension, donor diabetes, DGF by severity, BPAR ≤30 days post-transplant ≥Banff Ia.
The median eGFR by the CKD-EPI formula (imputed for graft loss) at 1-year post-transplant differed significantly between groups, with 50.4 (IQR 37.6–67.6) in the no DGF group, 54 (IQR 40.1–67.4) in group A, 40.8 (IQR 29.2–58.6) in group B, 42 (IQR 28.9–56.4) in group C and 27 (IQR 18.9–41.9) mL/min/1.73 m2 in group D (P < 0.001). However, eGFR levels were similar between the no DGF group [50.4 (IQR 37.6–67.6) mL/min/1.73 m2] and group A [54 (IQR 40.1–67.4) mL/min/1.73m2; P = 0.558].
Burden of DGF
The length of stay after transplantation was similar in the no DGF group [13 days (IQR 11–15)] and group A [14 days (IQR 12–17); P = 0.214] but increased significantly with DGF severity: group B [16 days (IQR 13–20)], group C [23 days (IQR 20–29)] and group D [38 days (IQR 30–52); P < 0.001]. Moreover, DGF patients were readmitted more frequently and spent more time in hospital. The median rehospitalization number after discharge from transplantation was 4 (IQR 2–8) for no DGF and 5 (IQR 3–9; P = 0.005) for DGF patients. The median duration of days in hospital after discharge from transplantation in the no DGF group was 24 days (IQR 7–63) versus 20 days (IQR 6–64) in group A (no DGF versus group A; P = 0.523) versus 45 (IQR 9–98) in group B, 33 (IQR 11–84) in group C and 72 (IQR 36–149) in group D (P < 0.001). Kaplan–Meier curves for the time to first hospitalization for the no DGF and DGF severity groups are displayed in Figure 3A and B, showing more and earlier rehospitalization, especially for the higher DGF severity groups.
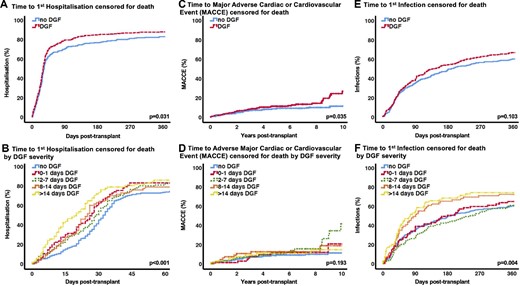
(A) Time to first hospitalization censored for death. (B) Time to first hospitalization censored for death by DGF severity. (C) Time to a MACCE censored for death. (D) Time to a MACCE censored for death by DGF severity. (E) Time to first infection censored for death. (F) Time to first infection censored for death by DGF severity.
After 10 years, more patients in the DGF group had a MACCE: 26.7% (CI 18.1–35.3) versus 11.3% (CI 6.6–16.0; P = 0.035) in the no DGF group (Figure 3C). Separation for DGF groups did not reveal an effect that was associated with severity (Figure 3D). The overall infection rate after transplantation was high and similar between groups: 234 of 278 (84.2%) versus 295 of 349 patients (84.5%) in the no DGF and DGF group, respectively. Despite no significant difference in time to first infection between the no DGF and DGF group (Figure 3E) at 1 year, the patients in groups C and D suffered from significantly more infectious events earlier in the course post-transplant (Figure 3F).
DISCUSSION
After 10 years, prolonged DGF demonstrated a significant duration-dependent negative effect on living with a functioning graft and DCGS. Together with donor hypertension, multivariable analyses confirmed DGF as an independent predictor of DCGS with increasing risk in more severe DGF. Moreover, the short-term DGF of 0–1 day showed a comparable risk of DCGS as the group without DGF in both survival and multivariable analyses.
The present study adds some new aspects to the complex relationship between DGF and outcome. Importantly, a short (0–1 day) duration of DGF had no relevant effect on outcome. In standard criteria kidneys with a KDPI <85%, only a very long duration of DGF (>14 days) had a significant impact on graft survival, while DGF duration showed an increasing effect in extended criteria kidneys with a KDPI ≥85%. In addition, our data also clearly demonstrate the burden of DGF with regard to hospitalization, infections, MACCEs and renal function.
Our study may have important implications for clinical studies on prevention or treatment of DGF. The fact that patients with a short (0–1 day) duration of DGF had rather similar outcomes regarding patient and graft survival as well as renal function at 1 year and a similar rate of complications strongly suggests that these patients represent a different entity and should be separated from patients with more severe forms of DGF. Of note, in this cohort, 76% of patients in the 0–1 day DGF group needed dialysis due to hyperkalaemia-associated states. In addition, analysis of <3 or ≥3 dialysis sessions and DGF duration to account for transient causes of graft dysfunction demonstrated that cases with sustained DGF >7 days had significantly worse 10-year DCGS. Patients with <3 or ≥3 dialyses who gained graft function within the first week had similar DCGS. This underscores the time-dependent effects of DGF on long-term graft outcomes. In distinct patient groups, such as standard criteria donors, even longer DGF had less impact on long-term outcome, while in kidneys at higher risk, as defined by high KDPI values, prevention of mild DGF severity (as defined by DGF duration >1 day) seems to be important and might improve outcomes. Our data question the utility of the current dichotomous endpoint of a single dialysis in the first post-transplant week. Although several studies have attempted to refine the DGF definition, from a clinical study perspective [19], including a decrease of creatinine or time-dependent cut-offs and postoperative urine output values to characterize subtypes of DGF such as slow graft function, no alternative has yet been shown to be superior [14, 15].
The incidence of DGF has been increasing in the last decades due to the increasing use of extended criteria kidneys [17, 33] and donation after circulatory death [7, 20]. Reported incidences range from 20–30% in the USA [7, 10], 24% in Australia and New Zealand [13], 30–50% in Europe [34] and 70% in deceased donor transplantation in Brazil [4, 12]. In our cohort, we found a rather high frequency of DGF of 56%, eventually due to the high number of patients who received a kidney with a KDPI ≥85% [n = 222 (35.4%)], resulting in a median KDPI of 70% (compared with 50% in the USA). The variability of the reported incidences also depends in part on the individual dialysis indication policy of the centres, which can vary considerably even in related programs [16]. Of note, in our cohort, a relevant proportion of patients with DGF (22% of the DGF group) required only a single dialysis.
In our analysis, the strongest risk factors for DGF were demonstrated to be borderline and BPAR (Bpar ≥ Banff Ia), besides other well-known risk factors, such as male gender, retransplantation, longer time on dialysis, a longer CIT and higher donor creatinine, which is in line with the current literature [1, 4, 8, 10, 12–14, 20, 35, 36]. Moreover, we found increasing rates of acute rejection in more severe DGF, occurring earlier in the post-transplant course.
The duration-dependent effects on graft survival have only been investigated by a few studies so far [2, 13, 25]. After 6 years, Schnuelle et al. [2] found similar rates of DCGS in the no DGF and 1–2 dialysis session DGF group in a German cohort, whereas a second group of patients with >2 dialysis sessions showed a significantly worse outcome [2]. Similar to our cohort, an Australia and New Zealand Dialysis and Transplant Registry (ANZDATA) analysis demonstrated increasing risk for graft loss within four severity groups with >14 days DGF, resembling the highest severity grade. However, in this study the short-term DGF, defined as 1–4 days, was not compared with the no DGF group [13].
In our study, DGF patients with increasing severity tended to have more rejections earlier in the course. On the other hand, even in DGF >14 days, only 28% of patients had a BPAR within the first 30 days and in the ANZDATA analysis by Lim et al. [13] only 10% of the effects between DGF duration and DCGS were explained by acute rejection (online supplementary data), suggesting a strong impact of other non-immunologic factors contributing to DGF and its severity [10].
After transplantation, DGF led to longer hospitalization and more frequent readmission, implying an additional significant medical, psychological and economic burden. Several studies investigated these implications in the late 1990s and early years of the 2000s, finding higher rates of rejection, longer hospitalization and higher costs associated with DGF [3, 6]. In 2011, Buchanan et al. [37] published a large Medicare analysis of patients needing dialysis within 90 days post-transplant, showing significantly higher costs for care alongside worse patient and graft survival. Other potential consequences such as cardiovascular or infectious complications have been poorly investigated. We found significantly more patients with cardiovascular complications (MACCEs) in DGF patients. However, these occurred late in the course, which is a potential consequence of chronic renal insufficiency and makes it difficult to establish a direct association. Larger patient collectives are necessary to confirm this finding. Infectious complications were similar in the no DGF compared with the less severe DGF groups, while the most severe DGF groups (C and D) demonstrated more infections earlier after-transplant, which could be related to a higher load of immunosuppression, since rejection risk is 2- to 3-fold in these groups.
The strength of this study is the long-term, complete follow-up in a contemporary cohort with a complete and extensive data set including many elderly donors and recipients undergoing a rather uniform treatment regimen. However, the study has the limitations of retrospective medium-sized, single-centre studies. Although we adjusted for differences in measured recipient and transplant factors, potentially impacting transplant outcomes, unaccounted for differences in recipient characteristics and management could still confound our findings. Due to inconsistent documentation of urine output values and incomplete creatinine courses, we could not implement these parameters in our analyses. In addition, due to the relatively uniform Caucasian composition of the population, the results cannot be extended to other ethnic groups. Moreover, since donation after circulatory death is prohibited in Germany, only transplantation after brain death could be evaluated.
In summary, DGF had a duration-dependent effect on long-term outcome. Interestingly, short-term DGF (0–1 day) with only a single postoperative dialysis showed comparable results to no DGF regarding patient and graft outcomes, as well as kidney function and other clinical complications post-transplant. In KTRs, receiving <85% KDPI kidneys, only very severe DGF (>14 days) had an impact on graft outcome. In contrast, DGF severity was associated with significantly worse long-term graft survival in KTRs with ≥85% KDPI kidneys, independent of duration. Strategies avoiding DGF have to individualize on certain risk groups that are most susceptible to lower its burdensome consequences.
AUTHORS’ CONTRIBUTIONS
E.S., M.M., O.S. and L.J.L. were responsible for the study conception or design, or analysis and interpretation of data, or both. E.S., M.M., K.B. and L.J.L. were responsible for drafting the article or revising it. All authors were responsible for providing intellectual content of critical importance to the work described and approved of the version to be published.
FUNDING
The study was partly funded by an unrestricted research grant from Alexion Pharmaceuticals (grant 119043).
CONFLICT OF INTEREST STATEMENT
K.B. received research funds and/or honoraria from Alexion, Astellas, Bristol-Myers Squibb, Chiesi, Fresenius, Genentech, Hexal, Novartis, Otsuka, Pfizer, Roche, Sandoz, Siemens and Veloxis Pharma. The other authors have no conflicts of interest to disclose.
REFERENCES
Author notes
These authors contributed equally to this work.


Comments