


ABSTRACT
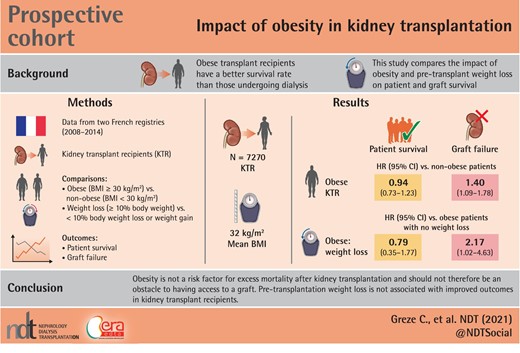
The access of obese patients to kidney transplantation is limited despite several studies showing that obese transplant recipients had a better survival rate than those undergoing dialysis. The aim of this study was to compare patient and graft survival rates and post-renal transplant complications in obese patients and non-obese patients and to assess the effect of pre-transplant weight loss in obese patients on transplant outcomes.
We carried out a prospective cohort study using two French registries, the Renal Epidemiology and Information Network and CRISTAL, on 7270 kidney transplant patients between 2008 and 2014 in France. We compared obese patients with non-obese patients and obese patients who lost more than 10% of weight before the transplant (obese WL and obese nWL).
The mean BMI in our obese patients was 32 kg/m2. Graft survival was lower in obese patients than in non-obese patients {hazard ratio (HR) = 1.40, [95% confidence interval (95% CI) 1.09; 1.78], P = 0.007}, whereas patient survival was similar [HR = 0.94, (95% CI 0.73; 1.23), P = 0.66]. Graft survival was significantly lower in obese WL than in obese nWL [HR = 2.17, (1.02; 4.63), P = 0.045], whereas patient survival was similar in the two groups [HR = 0.79, (0.35; 1.77), P = 0.56].
Grade 1 obesity does not seem to be a risk factor for excess mortality after kidney transplantation and should not be an obstacle to having access to a graft. Weight loss before a kidney transplant in these patients should not be essential for registration on waiting list.
What is already known about this subject?
Obesity is an obstacle to access to kidney transplantation. Obese patients are encouraged to lose weight before receiving a graft and so their waiting time is longer. Some studies have shown that obesity is associated with a greater number of postoperative complications in kidney transplant recipients.
What this study adds?
Obesity and pre-transplant weight loss in obese patients are two factors for graft loss but do not affect patient survival. Weight loss in obese patients with grade 1 obesity did not reduce the number of postoperative complications.
What impact this may have on practice or policy?
Grade 1 obesity should not therefore be an obstacle to having access to a kidney graft.
Weight loss in patient with grade 1 obesity should not be essential for registration on the transplant list.
INTRODUCTION
Since the early 2000s, the prevalence of obesity in the Western world has been increasing annually [1]. Obesity and its complications, in particular cardiovascular and metabolic disorders, increase the risk of chronic kidney disease [2–5]. The prevalence of the disease in France in 2015 was 22% in dialysis patients [6] versus 17% in the general population [7]. The access of these obese patients to kidney transplantation is limited despite several studies showing that obese transplant recipients had a better survival rate than those undergoing dialysis [8–12]. In France, although the High Authority for Health recommends offering renal transplants to patients with a body mass index (BMI) greater than 50 kg/m2 [13], most transplant teams prefer potential recipients to have a BMI lower than 35 kg/m2. Hence, obese patients are encouraged to lose weight before receiving a graft or being placed on a transplant waiting list.
Most relevant studies have shown that obese renal transplant recipients have more complications postoperatively and during the first year of graft than non-obese patients [14–27]. However, obese patient and graft survival rates differ between reports.
Of the few studies investigating the effect of weight loss before transplantation on graft outcome in obese patients, most were performed in the USA [31–33]. A preliminary study based on data from a French transplant centre showed that obesity and weight loss pre-transplant had no effect on graft outcome and patient survival [34].
The aim of this new study was to compare patient and graft survival rates and post-renal transplant complications in obese patients and non-obese patients and to assess the effect of pre-transplant weight loss in obese patients on transplant outcomes using data from French national registries.
MATERIALS AND METHODS
Population
We carried out a comparative observational study of patients undergoing renal transplantation in France between 1 January 2008 and 31 December 2014 based on two French prospective registries, Renal Epidemiology and Information Network (REIN), which collates information on dialysis patients in France [35], and CRISTAL, which was created by the French Agency for Biomedicine [36].
The inclusion criteria for our study were patients aged 18 years and above, who were recipients of a kidney transplant in France between 1 January 2008 and 31 December 2014 and who had follow-up data available in the REIN registry.
Exclusion criteria were (i) patients who did not have at least two pre-transplant ‘weight’ entries and one ‘weight’ entry at the time of transplantation, (ii) those whose ‘height’ and/or ‘BMI’ data were missing or incorrect, (iii) those who had had more than one renal transplantation and (iv) those having had a renal transplantation in combination with transplantation of another organ. Only the ‘weight’ data collected after at least 3 months of dialysis were taken into consideration.
Obese patients were defined as those having a BMI ≥30 kg/m2 during follow-up and non-obese patients as those who had never had a BMI ≥30 kg/m2 during follow-up. For each patient, we calculated ∆weight values (= greatest weight before transplant – weight on the day of transplant). Accordingly, we identified four groups:
Non-obese WL (non-obese weight loss): patients who never had a BMI ≥30 kg/m2 during their follow-up and who lost at least 10% of their weight
Non-obese nWL (non-obese no weight loss): patients who never had a BMI ≥30 kg/m2 during their follow-up and who did not lose more than 10% of their weight
Obese WL (obese weight loss): patients who had a BMI of at least ≥30 kg/m2 during their follow-up before transplantation and who lost at least 10% of their weight
Obese nWL (obese no weight loss): patients who had a BMI ≥30 kg/m2 during their follow-up and who did not lose more than 10% of their weight
Data collection
From the REIN database, we collected the weight and BMI of patients before transplantation, their age, sex, type of initial kidney disease, surgical and medical history, the duration of dialysis before transplantation and the most recent serum albumin levels before transplantation.
The following data were collected from the CRISTAL database: the date of transplantation, the organ source (living or deceased donor), expanded criteria donor or not [34], donation after circulatory death donors, cold and warm ischaemia time, HLA mismatches, time to resumption of graft function or primary non-function of the graft, length of hospital stay, medical and surgical complications, and the dates of graft loss and death.
Definitions
Delayed graft function was defined as the need for at least one post-graft dialysis session [35].
Cardiovascular complications were hypertension, cardiac rhythm disorder, cardiac decompensation, myocardial ischemia and angina cerebrovascular accident and peripheral arterial disease of the lower limbs.
Digestive complications were hepatic and epigastric disorders, pancreatitis and complications of digestive surgery.
Grade 1 obesity corresponds to patients with a BMI between 30 and 35 kg/m2.
Grade 2 obesity corresponds to patients with a BMI between 35 and 40 kg/m2.
Grade 3 obesity corresponds to patients with a BMI greater than 40 kg/m2.
Statistical analyses
Analyses were performed with Stata software (version 13, StataCorp, College Station, TX, USA). All tests were two-sided with a Type 1 error set at 0.05. The population was described in terms of numbers and associated percentages for categorical variables and mean ± standard deviation or median (interquartile range) for quantitative variables according to their statistical distribution with normal distribution assessed by the Shapiro–Wilk test. The comparisons between independent groups for quantitative variables were performed by Student's t-test or Mann–Whitney test if t-test assumptions were not met. The homoscedasticity was assessed by the Fisher–Snedecor test. The comparisons for categorical parameters were conducted by the Chi-squared test or, when appropriate, by Fisher's exact test. Censored data were estimated by the Kaplan–Meier method and compared between independent groups with the log-rank test.
In multivariate settings, regression models were performed, linear for a quantitative dependent variable (by log transformation) such as length of stay, or logistic for a dichotomous dependent variable (morbidity) or Cox model for right censored data. Covariables were considered according to the results of univariate analysis and their clinical relevance. A particular attention was paid to the multicollinearity using Farrar–Glauber test and variance inflation factor (VIF). To guarantee that our results were not affected by interaction and multicollinearity between covariates, directed acyclic graphs (DAGs) were built with multidisciplinary specialists (a cardiologist, an endocrinologist, three nephrologists, an urologist) to keep only clinically independent covariates for multivariable analyses (Supplementary data, Figures S1 and S2). We made two models of multivariate analysis for each outcome (Supplementary data, Tables S1–S4).
Special attention was also paid to the study of interactions, in particular between obesity (yes/no) and weight loss (yes/no). The results were expressed with regression coefficients (for continuous outcome), odds ratio (OR) (for dichotomous outcome) or hazard ratio (HR) (for censored outcome) and 95% confidence intervals (95% CI). The results were described with forest-plot graphs.
An analysis of representativeness was conducted comparing patients included in the analyses and those who were excluded due to non-inclusion criteria (Supplementary data, Tables S5 and S6).
RESULTS
Between 1 January 2008 and 31 December 2014, 17 012 patients received a kidney transplant. Of these, 7270 were analysed in the study (Figure 1).
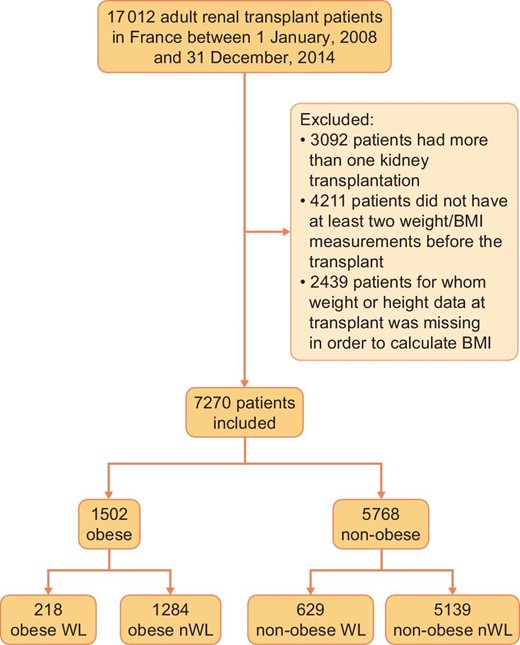
Flow chart.
Patient characteristics
The initial characteristics of the obese and non-obese patients before transplantation are given in Table 1. The obese subjects were older at the time of transplant and had significantly more of the following comorbidities: diabetes, dyslipidemia, hypertension, heart attack and coronary heart disease, cardiac arrhythmia and peripheral arterial disease of the lower limbs. In addition, the duration of dialysis before transplantation was significantly longer in the obese group (42.8 ± 29 versus 41.4 ± 32 months, P = 0.002) and they waited longer before being on the list (22.7 ± 25.8 months versus 21.6 ± 27.6 months, P < 0.001) (Table 1).
Baseline characteristics: obese versus non-obese
| Obese (n = 1502) | Non-obese (n = 5768) | P | |
|---|---|---|---|
| Male, n (%) | 843 (56.1) | 3789 (65.7) | <0.001 |
| Mean age at the time of transplant ± SD, years | 57 ± 11 | 53 ± 14 | <0.001 |
| Maximum weight before transplant, kg | 91.4 ± 12.8 | 69.8 ± 13.2 | <0.001 |
| Maximum BMI before transplant, kg/m2 | 32.7 ± 3.3 | 24.3 ± 3.7 | <0.001 |
| Weight at transplant, kg | 89.2 ± 12.4 | 67.4 ± 12.6 | <0.001 |
| BMI at transplant, kg/m2 | 32.0 ± 3.3 | 23.5 ± 3.5 | <0.001 |
| Weight loss before transplant (IQR), % | −1.4 (−6.2; 2.5) | −1.5 (−5.8; 2.4) | 0.71 |
| Initial nephropathy, n (%) | <0.001 | ||
| Diabetic nephropathy | 331 (22.1) | 578 (10.0) | * |
| Vascular nephropathy | 243 (16.2) | 736 (12.8) | * |
| Glomerulopathy | 263 (17.5) | 1358 (23.5) | * |
| Polycystic kidney disease | 179 (11.9) | 957 (16.6) | * |
| Other | 325 (21.6) | 1421 (24.6) | |
| Unknown | 161 (10.7) | 718 (12.5) | |
| Time of dialysis ± SD, months | 42.8 ± 29 | 41.4 ± 32 | 0.002 |
| Time on waiting list ± SD, months | 24.6 ± 20 | 24.1 ± 19 | 0.46 |
| Time between start of dialysis and registration on the list ± SD, months | 22.7 ± 25.8 | 21.6 ± 27.6 | <0.001 |
| Past medical history, n (%) | |||
| Diabetes | 494 (32.9) | 823 (14.3) | <0.001 |
| Dyslipidemia | 663 (44.1) | 1498 (26.0) | <0.001 |
| Chronic heart failure | 54 (3.6) | 138 (2.4) | 0.09 |
| Hypertension | 937 (62.4) | 3097 (53.7) | <0.001 |
| Ischaemic cardiopathy | 92 (6.2) | 245 (4.2) | 0.008 |
| Coronary arterial disease | 169 (11.3) | 434 (7.5) | <0.001 |
| Cardiac arrhythmia | 76 (5.1) | 203 (3.5) | 0.006 |
| Stroke | 59 (3.9) | 201 (3.5) | 0.64 |
| Peripheral vascular disease | 78 (5.2) | 176 (3.1) | <0.001 |
| Smoking | 564 (37.5) | 2114 (36.7) | 0.11 |
IQR, interquartile range; SD, standard deviation. Bold type indicates statistically significant difference.
*P < 0.05.
Transplantation characteristics are shown in Table 2. The proportion of donors with expanded criteria was significantly higher in the obese group (52.3 versus 41.8%, P < 0.001). Warm ischaemic time was significantly longer in obese patients [50 (95% CI 36; 67) versus 43 (33; 60) min, P < 0.001] (Table 2).
Transplantation characteristics: obese versus non-obese
| Obese (n = 1502) | Non-obese (n = 5768) | P | |
|---|---|---|---|
| Serum albumin levels ± SD, g/L | 38.1 ± 4.6 | 38.3 ± 5.0 | 0.23 |
| Donor type, n (%) | <0.001 | ||
| Living donor | 61 (4.0) | 385 (6.7) | * |
| Donation after circulatory death donors | 32 (2.1) | 150 (2.6) | |
| Deceased donor with standard criteria | 625 (41.6) | 2817 (48.9) | * |
| Deceased donor with expanded criteria | 784 (52.3) | 2416 (41.8) | * |
| Age of the donor ± SD, years | 57 ± 15 | 53 ± 16 | <0.001 |
| Cold ischaemic time (IQR), h | 16 (12; 20) | 15 (12; 19) | 0.001 |
| Warm ischaemic time (IQR), min | 50 (36; 67) | 43 (33; 60) | 0.001 |
| Mismatch HLA-A, n (%) | 0.34 | ||
| 0 | 204 (13.6) | 841 (14.6) | |
| 1 | 787 (52.4) | 3069 (53.2) | |
| 2 | 511 (34.0) | 1858 (32.2) | |
| Mismatch HLA-B, n (%) | 0.92 | ||
| 0 | 120 (8.0) | 449 (7.8) | |
| 1 | 653 (43.5) | 2539 (44.0) | |
| 2 | 729 (48.5) | 2780 (48.2) | |
| Mismatch HLA-DR, n (%) | 0.04 | ||
| 0 | 422 (28.1) | 1475 (25.6) | |
| 1 | 848 (56.4) | 3270 (56.7) | |
| 2 | 232 (15.5) | 1023 (17.7) | |
| HLA antibodies ± SD, % | 4.7 ± 15 | 4.0 ± 13 | 0.12 |
HLA, human leukocyte antigen; IQR, interquartile range. Bold type indicates statistically significant difference.
*P < 0.05.
Post-transplantation outcomes
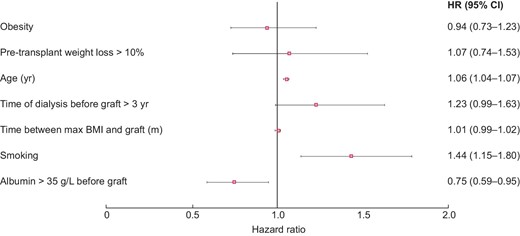
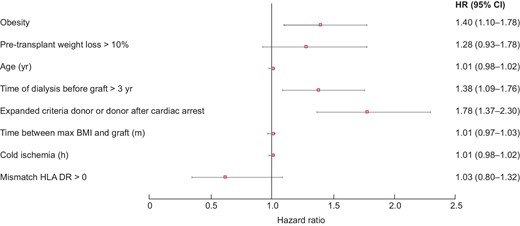
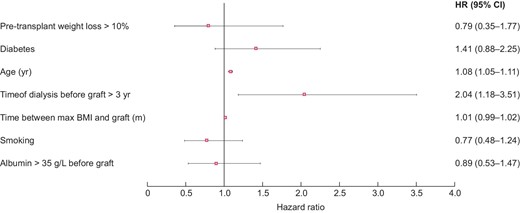
In univariate analysis, patient survival at 5 years was significantly higher in non-obese patients [HR = 1.23 (95% CI 1.01; 1.50), P = 0.04]. Likewise, graft survival at 5 years was significantly better in non-obese subjects [HR = 1.38 (1.18; 1.62), P < 0.001] (Figures 2 and 3). In multivariate analysis, survival rates did not differ between obese and non-obese patients [HR = 0.94 (0.73; 1.23), P = 0.66]. Only age [HR = 1.06 (1.04; 1.07), P = 0.002] and smoking [HR = 1.44 (1.15; 1.80), P = 0.002] were risk factors for mortality. In contrast, a serum albumin level higher than 35 g/L before transplantation was a protective factor [HR = 0.75 (0.59; 0.95), P = 0.02] (Figure 4). Graft survival was lower in obese patients [HR = 1.40 (1.09; 1.78), P = 0.007]. A time of dialysis >3 years before transplantation [HR = 1.38 (1.09; 1.76), P = 0.009], and donors with expanded criteria and donors after cardiac arrest [HR = 1.78 (1.37; 2.30), P < 0.001] were also risk factors for graft loss (Figure 5).
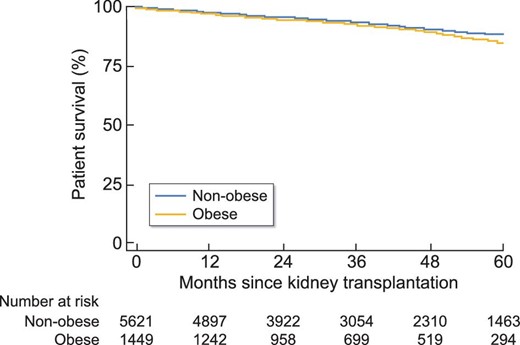
Patient survival—obese versus non-obese.
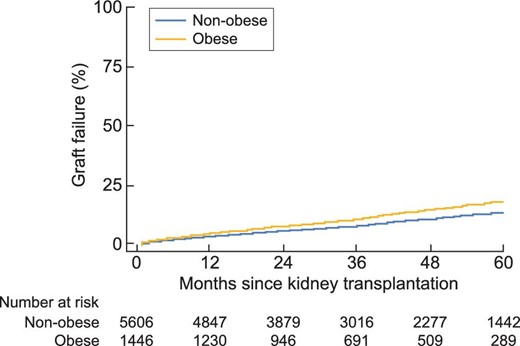
Graft loss—obese versus non-obese.
Survival in all patients.
Graft survival in all patients.
Post-transplant complications are given in Tables 3 and 4. In univariate analysis, there was a greater risk in obese patients of delayed graft function (24.6 versus 12.3%, P < 0.001), cardiovascular complications [HR = 1.24 (1.06; 1.45), P = 0.06] and post-transplant diabetes [HR = 1.77 (1.38; 2.30), P < 0.001]. Post-transplant length of hospital stay was also significantly longer in obese patients [15 (11; 21) versus 14 (10; 19) days, P = 0.001] (Tables 3 and 4). In multivariate analysis, obese subjects still had a greater risk of delayed graft function [OR = 2.39 (1.96; 2.91), P < 0.001] and post-transplant diabetes [HR = 1.68 (1.30; 2.18), P < 0.001]. Their length of hospital stay remained significantly longer [coefficient of regression = 0.92 (0.26; 1.58), P < 0.001] (Tables 3 and 4).
Post-transplant complications: obese versus non-obese
| Obese (n = 1 502) | Non-obese (n = 5 768) | P (univariate) | OR (95% CI) (multivariate) | P (multivariate) | |
|---|---|---|---|---|---|
| Primary graft failure, n (%) | 108 (7.2) | 336 (5.8) | 0.05 | 1.19 (0.77; 1.84) | 0.77 |
| Delayed graft function, n (%) | 370 (24.6) | 709 (12.3) | <0.001 | 2.39 (1.96; 2.91) | <0.001 |
| Length of hospital stay (IQR), days | 15 (11; 21) | 14 (10;19) | 0.001 | 0.93a (0.06; 1.79) | 0.04 |
| Ureteral complication, n (%) | 102 (6.8) | 367 (6.4) | 0.55 | 1.41 (0.83; 2.41) | 0.21 |
| Vascular graft complication, n (%) | 136 (9.1) | 460 (8.0) | 0.17 | 0.93 (0.61; 1.41) | 0.74 |
| Graft haemorrhage, n (%) | 34 (2.3) | 120 (2.1) | 0.66 | 1.15 (0.67; 1.97) | 0.61 |
Bold type indicates statistically significant difference.
Regression coefficient.
Post-transplant complications: obese versus non-obese
| HR (95% CI) (univariate) | P (univariate) | HR (95% CI) (multivariate) | P (multivariate) | |
|---|---|---|---|---|
| Acute rejection | 1.12 (0.94; 1.34) | 0.06 | 0.45 (0.16; 1.30) | 0.14 |
| Bacterial infection | 1.10 (0.98; 1.22) | 0.12 | 1.06 (0.60; 1.87) | 0.85 |
| Fungal infection | 1.02 (0.70; 1.49) | 0.11 | 0.89 (0.60; 1.33) | 0.57 |
| Cardiovascular complication | 1.24 (1.06; 1.45) | 0.06 | 1.04 (0.86; 1.25) | 0.70 |
| Post-transplant diabetes | 1.77 (1.38; 2.30) | <0.001 | 1.68 (1.30; 2.18) | <0.001 |
| Digestive complication | 1.10 (0.9; 134) | 0.36 | 0.93 (0.75; 1.20) | 0.67 |
Bold type indicates statistically significant difference.
Effect of weight loss >10% before transplantation in the obese group
The characteristics of obese WL and obese nWL patients before transplant are shown in Table 5. Mean BMI at transplant was 29.1 kg/m2 in obese WL and 32.4 kg/m2 in obese nWL (P < 0.001). Dialysis duration was longer in the obese WL than in the obese nWL a [4 (3; 6) versus 3 (2; 4) years, P = 0.001] and the time between start of dialysis and registration on the waiting list was longer for obese WL (32.4 ± 34.8 months versus 21 ± 23.5, P < 0.001). The time on waiting list was not different between the two groups (26.4 ± 21.6 months versus 23.8 ± 19 months, P = 0.12) (Table 5).
Baseline characteristics: obese WL versus obese nWL
| Obese WL (n = 218) | Obese nWL (n = 1 284) | P | |
|---|---|---|---|
| Male | 117 (53.7) | 726 (56.5) | 0.43 |
| Mean age at the time of transplant ± SD, years | 54 ± 13 | 57 ± 11 | 0.001 |
| Maximum weight before transplant, kg | 96.8 ± 13.9 | 90.5 ± 12.3 | <0.001 |
| Maximum BMI before transplant, kg/m2 | 34.6 ± 3.7 | 32.4 ± 3.2 | <0.001 |
| Weight at transplant, kg | 81.6 ± 12.0 | 90.5 ± 12.0 | <0.001 |
| BMI at transplant, kg/m2 | 29.1 ± 3.3 | 32.4 ± 3.1 | <0.001 |
| Weight loss before transplant (IQR), % | −14.1 (−17.8; −11.9) | 0 (−3.8; 3.4) | <0.001 |
| Initial nephropathy, n (%) | 0.57 | ||
| Diabetic nephropathy | 44 (20.2) | 287 (22.4) | |
| Vascular nephropathy | 37 (17.0) | 206 (16.0) | |
| Glomerulopathy | 43 (19.7) | 220 (17.1) | |
| Polycystic kidney disease | 21 (9.6) | 158 (12.3) | |
| Other | 46 (21.1) | 279 (21.8) | |
| Unknown | 27 (12.4) | 134 (10.4) | |
| Time of dialysis (IQR), years | 4 (3; 6) | 3 (2; 4) | 0.001 |
| Time on waiting list ± SD, months | 26.4 ± 21.6 | 23.8 ± 19 | 0.12 |
| Time between start of dialysis and registration on waiting list ± SD, months | 32.4 ± 34.8 | 21 ± 23.5 | <0.001 |
| Past medical history, n (%) | |||
| Diabetes | 67 (30.1) | 427 (33.3) | 0.69 |
| Dyslipidémia | 94 (43.1) | 569 (44.3) | 0.55 |
| Chronic heart failure | 9 (4.1) | 45 (3.5) | 0.20 |
| Hypertension | 125 (57.3) | 812 (63.2) | 0.33 |
| Ischaemic cardiopathy | 10 (5.0) | 82 (6.7) | 0.39 |
| Coronary arterial disease | 21 (9.6) | 148 (11.5) | 0.57 |
| Cardiac arrhythmia | 12 (5.5) | 65 (5.1) | 0.65 |
| Stroke | 9 (4.1) | 50 (3.9) | 0.77 |
| Peripheral vascular disease | 10 (5.0) | 68 (5.3) | 0.77 |
| Smoking | 73 (33.5) | 491 (38.2) | 0.28 |
IQR, interquartile range; SD, standard deviation. Bold type indicates statistically significant difference.
*P < 0.05.
Table 6 gives the transplantation characteristics of obese WL and obese nWL patients. Donors were older in the obese WL group than in the obese nWL group (54 ± 16 versus 57 ± 14, P = 0.03) (Table 6).
Transplantation characteristics: obese WL versus obese nWL
| Obese WL (n = 218) | Obese nWL (n = 1284) | P | |
|---|---|---|---|
| Serum albumin levels (g/L) | 37.8 ± 4.6 | 38.2 ± 4.2 | 0.22 |
| Donor type, n (%) | 0.55 | ||
| Living donor | 9 (4.1) | 52 (4.0) | |
| Donation after circulatory death donors | 7 (3.2) | 25 (2.0) | |
| Deceased donor with standard criteria | 95 (43.6) | 530 (41.3) | |
| Deceased donor with expanded criteria | 107 (49.1) | 677 (52.7) | |
| Age of the donor, ± SD, years | 54 ± 16 | 57 ± 14 | 0.03 |
| Cold ischaemic time (IQR), h | 16 (13; 20) | 16 (12; 20) | 0.31 |
| Warm ischaemic time (IQR), min | 47 (31; 70) | 50 (37; 67) | 0.07 |
| Mismatch HLA-A, n (%) | 0.27 | ||
| 0 | 23 (10.6) | 181 (14.1) | |
| 1 | 123 (56.4) | 664 (51.7) | |
| 2 | 72 (33.0) | 439 (34.2) | |
| Mismatch HLA-B, n (%) | 0.62 | ||
| 0 | 20 (9.2) | 100 (7.8) | |
| 1 | 89 (40.8) | 564 (43.9) | |
| 2 | 109 (50.0) | 620 (48.3) | |
| Mismatch HLA-DR, n (%) | 0.79 | ||
| 0 | 62 (28.4) | 360 (28.0) | |
| 1 | 119 (54.6) | 729 (56.8) | |
| 2 | 37 (17.0) | 195 (15.2) | |
| HLA antibodies ± SD, % | 6.6 ± 17.7 | 4.4 ± 13.9 | 0.10 |
HLA, human leukocyte antigen; IQR, interquartile range. Bold type indicates statistically significant difference.
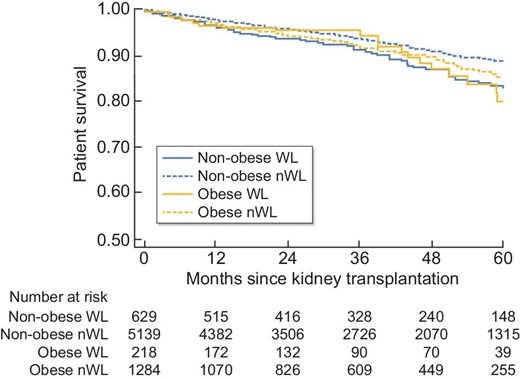
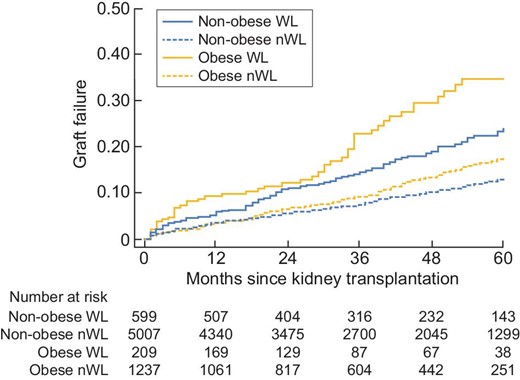
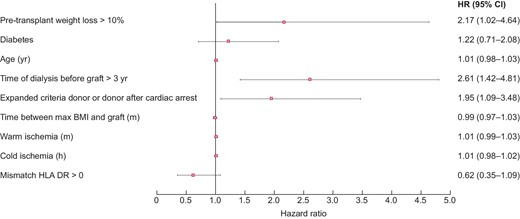
In univariate analysis, graft survival at 5 years was significantly lower in obese WL than in obese nWL [HR = 2.34 (1.72; 3.20), P < 0.001]. In contrast, patient survival at 5 years was comparable in the two groups [HR = 1.10 (0.67; 1.78), P = 0.71] (Figures 6 and 7). In multivariate analysis, graft survival was significantly lower in obese WL than in obese nWL [HR = 2.17 (1.02; 4.63), P = 0.045], whereas patient survival was similar in the two groups [HR = 0.79 (0.35; 1.77), P = 0.56] (Figures 8 and 9).
Patient survival in all patients.
Graft failure in all patients.
Survival in obese patients.
Graft survival in obese patients.
Post-transplant complications in obese WL and in obese nWL are shown in the Tables 7 and 8. In univariate analysis, hospital length of stay was significantly longer in the obese WL group [17 (12; 27) versus 15 (11; 20) days, P = 0.001] (Table 6). In multivariate analysis, hospital length of stay was also longer in the obese WL group [coefficient of regression = 5.49 (3.26; 7.73), P < 0.001] and there were more acute rejection in obese WL [HR = 1.62 (1.01; 2.61), P = 0.04], but no other differences in post-transplant complications were observed between the two groups (Tables 7 and 8).
Post-transplant complications: obese WL versus obese nWL
| Obese WL (n = 218) | Obese nWL (n = 1 284) | P (univariate) | OR (95% CI) (multivariate) | P (multivariate) | |
|---|---|---|---|---|---|
| Primary graft failure, n (%) | 20 (9.2) | 88 (6.9) | 0.22 | 1.58 (0.62; 4.00) | 0.33 |
| Delayed graft function, n (%) | 49 (22.5) | 321 (25.0) | 0.86 | 1.02 (0.62; 1.66) | 0.95 |
| Length of hospital stay (IQR), days | 17 (12; 27) | 15 (11; 20) | 0.001 | 5.49a (3.26; 7.73) | <0.001 |
| Ureteral complication, n (%) | 16 (7.3) | 86 (6.7) | 0.73 | 1.05 (0.30; 3.72) | 0.94 |
| Vascular graft complication, n (%) | 25 (11.5) | 111 (8.6) | 0.18 | 0.60 (0.18; 2.03) | 0.41 |
| Graft haemorrhage, n (%) | 6 (2.8) | 28 (2.2) | 0.60 | 0.31 (0.04; 2.38) | 0.26 |
Bold type indicates statistically significant difference.
Regression coefficient.
Post-transplant complications: obese WL versus obese nWL
| HR (95% CI) (univariate) | P (univariate) | HR (95% CI) (multivariate) | P (multivariate) | |
|---|---|---|---|---|
| Acute rejection | 0.97 (0.45; 1.32) | 0.4 | 1.62 (1.01; 2.61) | 0.04 |
| Bacterial infection | 0.94 (0.71; 1.25) | 0.69 | 1.04 (0.17; 6.37) | 0.97 |
| Fungal infection | 2.73 (0.65; 11.40) | 0.17 | 0.40 (0.95; 1.69) | 0.21 |
| Cardiovascular complication | 1.26 (0.84; 1.92) | 0.27 | 0.79 (0.47; 1.32) | 0.36 |
| Post-transplant diabetes | 1.67 (0.81; 3.37) | 0.17 | 0.56 (0.27; 1.16) | 0.12 |
| Digestive complication | 0.86 (0.54; 1.39) | 0.55 | 1.29 (0.76; 2.18) | 0.34 |
Bold type indicates statistically significant difference.
DISCUSSION
Our study of a French cohort of patients who underwent renal transplantation between 2008 and 2014 shows that obesity is a risk factor for graft loss but does not affect patient survival, and a weight loss >10% is a risk factor for graft loss in obese patients. In addition, weight loss in obese patients did not reduce the number of postoperative complications.
As in other recent reports, we observed similar post-transplant survival rates in obese and non-obese patients [14, 21–29]. In 2006, a retrospective study of 27 377 patients who had received a kidney transplant in the USA between 1997 and 1999 found no difference in survival rates between obese and non-obese patients [21], in contrast to earlier studies, which recorded more deaths in obese recipients [14]. Two recent meta-analyses, one involving 17 European and North American studies and the other 21 studies, found that death rates were not higher among obese transplant recipients, especially after 2003 [14, 23]. This is evidence of the progress made in the management of obese patients and the greater surgical experience acquired in kidney transplant centres [39].
Several studies have shown that obesity is associated with a greater number of postoperative complications in kidney transplant recipients. In our study, pre-transplant weight loss does not significantly reduce the number of complications. On the contrary, hospital length of stay is longer and there are more acute rejection in obese WL patients [14, 17–25, 27].
In addition to morphology-related surgical difficulties and the resulting longer warm ischaemic time, obesity is associated with a pro-inflammatory environment involving high cytokine and chemokine levels that can mediate the immunological response and contribute to delayed graft function [14, 40, 41]. The chronic inflammation characteristic of obesity is induced by visceral fat [40]. Imposed weight loss is unlikely to decrease the harmful effects of the adipokines. Chronic inflammation and ischaemia reperfusion injury promote acute rejection [19, 42–44]. As in our work, several studies have evidenced an increased prevalence of graft rejection in obese subjects [17–19, 24, 25]. The chronic inflammatory state observed in the obese that is induced by adipocytes secreting cytokines can also play a role in the occurrence of rejection [19, 45]. Weight loss in this context would not decrease the risk of acute rejection. Another factor that could promote acute rejection is the difficulty in balancing the rates of immunosuppressants [23, 40]. In our study, the higher percentages of delayed graft function in obese patients could also explain the lower graft survival rate observed in this patient category. Weight loss in obese subjects will not reduce the risk of delayed graft function and would even seem to adversely affect graft survival and the risk of acute rejection. The difference in graft survival between between obese WL and obese nWL could also have been due to the difference in dialysis duration before transplantation, which was longer in the obese WL group. It has been shown that the duration of renal replacement therapy is associated with poorer patient and graft survival [46–48]. Our obese WL patients were those who had the greatest BMI during pre-transplant follow-up and who subsequently waited longer before being on the waiting list, and therefore spent more time in dialysis.
In our study, pre-transplant weight loss had an adverse effect on post-transplant outcomes in obese patients. Obese patients who lost more than 10% of their weight had (i) longer post-transplant length of hospital stay, (ii) an increased risk of graft loss at 5 years, (iii) a greater risk of acute rejection and (iv) did not have fewer post-transplant complications than those who had not lost weight.
Our results in obese patients are consistent with those in the literature. A retrospective study made in 2007 of 124 713 kidney transplant recipients in the USA showed that (i) rapid pre-transplant weight loss was associated with poorer graft survival in non-obese patients and that (ii) patients who had lost weight, whether obese or not, did not have fewer post-transplant complications [31]. In kidney transplant recipients seen in the Mayo Clinic, Rochester, from 2007 to 2011, weight loss had no beneficial effect on the number of surgical complications, while patients who had lost more than 10% of their initial weight died earlier than obese patients whose weight had not varied significantly [32]. A recent study of patients who received kidney transplants between 2004 and 2014 in the USA also showed that irrespective of initial BMI, a pre-transplant weight loss of more than 10% was a poor prognostic factor for graft survival and post-transplant length of hospital stay. However, unlike this study and that made of another US cohort, we observed no excess mortality in our patients, whether obese or not, who had lost weight before transplantation [32, 33]. It is noteworthy that in these two US studies, more than 7% of the obese patients had a BMI greater than 40 kg/m2, whereas less than 5% of our patients had a BMI greater than 35 kg/m2 and less than 1% had a BMI greater than 40 kg/m2, which may explain this difference. The higher proportion of deceased donors in our survey compared to that of certain US studies could have been also a determining factor for graft survival [32].
Our study has some limitations. First, it was a registry study and it is therefore possible that some data were missing, in particular with regard to complications. For this reason, we could not take into account pre-emptive transplantations because we do not have data from patients with chronic kidney disease not on dialysis in our registers. In contrast, we limited confusion bias related to weight by taking into consideration only weights recorded after at least 3 months of dialysis since during the first months of dialysis there is the possibility of sodium and fluid overload. We also built two DAGs in order to keep only independent covariates for multivariate analyses; however, some covariates that are in the DAGs could not be taken into account in the multivariate analysis (DSA, therapeutic observance, etc.) because these data were not available in the registers or information about some data was insufficient. Second, it was not possible to know whether the weight loss observed was voluntary or not as this information was not recorded in the registry. Unfortunately, there are no data in the registry on bariatric surgery, which could have borne out this hypothesis. Third, most of the obese patients in our study had grade 1 obesity. Both the obese WL and obese nWL patients had a maximum BMI before and at transplantation lower than 35 kg/m2. Our results apply principally, therefore, to patients in that weight range. Another limitation concerns the lack of data other than BMI to define obesity. BMI alone does not tell whether it is gynoid or android obesity. However, it is obvious that android obesity is more problematic for the surgeon and therefore more limiting for the transplant. Unfortunately, in our registries, we do not have other data that would allow us to know the fat distribution.
In conclusion, grade 1 obesity does not seem to be a risk factor for excess mortality after kidney transplantation and should not therefore be an obstacle to having access to a graft. Weight loss before transplantation in obese subjects (i) is associated with a longer waiting time on dialysis, (ii) is associated with a longer hospital length of stay after transplantation, (iii) is associated with a greater risk of acute rejection, (iv) does not decrease the number of other complications after transplantation and (v) is a poor prognostic factor for graft survival. Weight loss before a kidney transplant in patients with grade 1 obesity should not be essential. Finally, fat mass distribution could have more serious adverse effects than obesity as defined by BMI >30 kg/m2. Studies are now needed on the effect of abdominal circumference and even more importantly of abdominal fat distribution on post-transplant outcomes.
FUNDING
We receive funding from the French Biomedicine Agency.
CONFLICT OF INTEREST STATEMENT
None declared.


Comments