


ABSTRACT
Zeb2, a zinc finger E-box-binding homeobox transcription factor, regulates transforming growth factor (TGF)-β signaling pathway. However, its role in the pathogenesis of acute kidney injury (AKI) and AKI-to-chronic kidney disease (CKD) transition is unclear.
We evaluated Zeb2 function in a bilateral renal ischemia–reperfusion injury (IRI)-induced AKI model using proximal tubule-specific Zeb2 conditional knockout (Zeb2-cKO) and wild-type (WT) mice, and in renal biopsy samples.
In Zeb2-cKO mice, the levels of plasma creatinine and blood urea nitrogen post-IRI were significantly lower than that in WT mice. Immunohistological analysis revealed mild tubular injury, reduced neutrophil infiltration, fewer fibrotic changes and reduced expression of fibrotic proteins [collagen type IV, α-smooth muscle actin (α-SMA), fibronectin and connective tissue growth factor (CTGF)], at 3–14 days post-IRI. Zeb2 expression was upregulated in proximal tubular cells post-IRI in WT mice. Zeb2 siRNA transfection reduced TGF-β-stimulated mRNA and protein expression of collagen type IV, α-SMA, fibronectin and CTGF in cultured renal tubular cells. Patients with AKI-to-CKD transition exhibited high Zeb2 expression in renal tubules, as revealed by renal biopsy. Hypoxia and CoCl2-treatment upregulated Zeb2 promoter activity and mRNA and protein expression in cultured renal tubular epithelial cells, suggesting a regulatory role for hypoxia.
Zeb2 was upregulated in renal tissues in both mice and humans with AKI. Zeb2 regulates fibrotic pathways in the pathogenesis of AKI and AKI-to-CKD transition. Therefore, inhibition of Zeb2 could be a potential therapeutic strategy for AKI.
What is already known about this subject?
Acute kidney injury (AKI) is a known risk factor for progression to chronic kidney disease (CKD).
The exact mechanism of AKI-to-CKD transition remains unclear.
The critical role of Zeb2 in the pathophysiology of AKI and AKI-to-CKD transition needs evaluation.
What this study adds?
Zeb2 expression was upregulated post ischemia–reperfusion injury.
Proximal tubule-specific Zeb2 conditional knockout ameliorates AKI and fibrosis, suggesting that Zeb2 contributes to fibrotic changes during AKI-to-CKD transition.
Zeb2 expression was upregulated in the renal biopsy tissues of AKI-to-CKD transition patients.
What impact this may have on practice or policy?
Inhibition of Zeb2 could be a potential strategy for managing AKI-to-CKD transition.
INTRODUCTION
Acute kidney injury (AKI) is common, has a high mortality rate and exhibits increased incidence in recent years [1, 2]. Epidemiological studies indicate a high rate of AKI-to-chronic kidney disease (CKD) transition [3]. Incomplete repair following AKI contributes to the progression to CKD and end-stage kidney disease [3, 4]. However, the exact mechanism of AKI-to-CKD transition remains unclear. Several mechanisms, such as inflammation, hypoxia, microvasculature rarefaction and incomplete recovery of tubular cells, could be involved in AKI-to-CKD transition. Ischemia is the leading cause of AKI in adults, and the underlying pathogenesis involves injury to nephron segments from the ischemia itself and from the survival strategies under oxidative stress [5, 6]. In response to injury, proximal renal tubular cells release cytokines and chemokines, including proinflammatory cytokines such as tumor necrosis factor (TNF)-α, interleukin (IL)-6, and transforming growth factor (TGF)-β, as potent mediators that cause inflammation and fibrotic changes [7–9]. Tissue fibrosis is the most common component in various forms of CKD, and TGF-β is one of the key factors involved in fibrotic changes in renal diseases [9].
Zeb2, a zinc finger E-box-binding homeobox transcription factor, plays a role in TGF-β signaling pathway through Smads proteins [10]. However, its role in the pathogenesis of AKI and AKI-to-CKD transition is unclear. In humans, Zeb2 mutations cause Mowat–Wilson syndrome, characterized by a distinct facial appearance, intellectual retardation, epilepsy and malformations including Hirschsprung disease, congenital heart defects and urogenital anomalies [11, 12]. Zeb2 is expressed in the kidneys during the embryonic period, and renal-specific Zeb2-deleted mice developed renal cysts early after birth [13]. Zeb2 is upregulated in hypoxic podocytes, but its regulation in renal tubular cells is unclear [14]. Zeb2 is critical in collagen fibrogenesis involving TGF-β signaling in mice with mesoderm-specific Zeb2 deletion [15]. However, this study did not report renal involvement, and therefore the pathological role of the Zeb2 in ischemia–reperfusion injury (IRI)-induced AKI and AKI-to-CKD transition remains unknown. In this study, we evaluate the contribution of Zeb2 to tubular damage and fibrosis following IRI-induced AKI using renal proximal tubule-specific Zeb2-knockout (KO) mice. We generated Cre-mediated tamoxifen-inducible Zeb2 conditional KO mice (cKO). We examined Zeb2 expression in IRI-induced AKI mouse model, and explored Zeb2 function in AKI and AKI-to-CKD transition using Zeb2-cKO mice. We evaluated Zeb2 expression in renal biopsy samples from patients with AKI-to-CKD transition using immunohistochemistry.
MATERIALS AND METHODS
Animals and surgical protocol
We generated Cre-mediated tamoxifen-inducible Zeb2 cKO mice, because a germline Zeb2 deficiency leads to embryonic lethality and congenitally renal-specific Zeb2-KO develop renal cysts early after birth [10, 13]. Briefly, we crossed Zeb2 floxed mice with mice harboring the Cre transgene under Ndrg1 promoter, which is specific to the proximal tubule [16]. Zeb2flox/flox mice were provided by Yujiro Higashi (Institute for Developmental Research, Aichi Human Service Center, Aichi, Japan) [17]. We analyzed Zeb2flox/flox Ndrg1 CreERT2/+ cKO (Zeb2-cKO) mice and control mice with normal Zeb2 expression (Zeb2flox/flox Ndrg1 Cre− or wild-type [WT]). Mice were divided into two groups, IRI and sham operation. Mice in both groups were administered 3 mg/20 g body weight tamoxifen (Sigma-Aldrich, St Louis, MO, USA) through intraperitoneal injection 7 days before IRI or sham operation for 5 consecutive days [16]. For IRI group mice, the kidneys were exposed through a midline abdominal excision and the bilateral renal pedicles were clamped for 35 min using nontraumatic aneurysm clips (Mizuho Ikakogyo, Tokyo, Japan) under isoflurane anesthesia; age- and weight-matched mice received a sham operation (n = 6). The animals were sacrificed at 0 h, 24 h, 72 h and 14 days after surgery (IRI group, n = 6/time point; control group, n = 6/time point), and the left kidney was processed for histology and protein and RNA isolation [18, 19]. This study was conducted in strict accordance with the recommendations in the Guide for the Care and Use of Laboratory Animals of the University of Kochi (Permit Number: N-00 105).
Culture of mouse renal tubular epithelial cells
The mouse renal tubular epithelial cell line, MCT, was a generous gift from Dr Eric Neilson (Northwestern University, Chicago, IL, USA). MCT cells were used for Zeb2 promoter-luciferase experiments and mRNA and protein analyses for Zeb2. Cells were placed in a hypoxic chamber (AnaeroPack, Mitsubishi Gas Chemical, Tokyo, Japan) under 0% O2/5% CO2 atmosphere and were maintained at 37°C for 2 h. For CoCl2 experiments, 250 or 500 μM CoCl2 was added to the medium for 4 h [18].
Isolation and histological examination of kidney tissue
Kidney tissue was embedded in paraffin wax, and 5-μm sections were stained using a hematoxylin–eosin staining kit [20] and Masson's trichrome staining. Histological changes due to tubular necrosis were quantitated by determining the percentage of tubules showing the features of cell necrosis [21]. Immunohistochemical staining was performed using a streptavidin–biotin method and specific antibodies against collagen type IV, α-smooth muscle actin (α-SMA), fibronectin and connective tissue growth factor (CTGF) (Supplementary data, Table S1). Immunostaining was quantified using morphometric analysis. Quantitation was performed using ImageJ software (National Institutes of Health, Bethesda, MD, USA; http://imagej.nih.gov/ij/). For Masson's trichrome staining and immunostaining, data were calculated as percentages of stained area [22].
Western blotting
Briefly, proteins (50 μg/sample) were transferred to nitrocellulose membranes and probed with appropriate primary antibodies (Supplementary data, Table S1) [23]. Individual bands were semi-quantified through densitometry using Alpha View software (Alpha View, Santa Clara, CA, USA) [24].
Real-time quantitative PCR
We performed reverse-transcription and real-time quantitative PCR (RT-PCR) analysis of the RNA extracted from the kidneys and MCT cells [25]. The extracted total RNA samples (1 μg) were reverse-transcribed, and RT-PCR was performed to quantify Zeb2, IL-6, TNF-α, TGF-β, collagen type IV, α-SMA, fibronectin, CTGF, CCL2 and CCL5 expression using an ABI LightCycler Real-Time PCR System (ABI, Los Angeles, CA, USA), and 18S rRNA as the positive control. Primers were purchased from ABI (Supplementary data, Table S2).
Transient transfection and luciferase assay
The pGL4.32[luc2P/human Zeb2/Hygro] vector containing promoter sequence (−1020 bp) was obtained from LightSwitch™ Promoter Reporter GoClone™ Collection (ActiveMotif, Tokyo, Japan). Primary cultures of renal MCT cells were transfected with the plasmid DNA (10 μg) through electroporation, and luciferase activity was measured after 48 h [24]. A β-galactosidase reporter construct was used for normalization of transfection.
Laser-scanning confocal immunofluorescence microscopy and electron microscopy
Fixed renal tissue was cryoprotected and shock-frozen in liquid nitrogen. Frozen sections were cut using a cryostat, thaw-settled on slides, stained and examined under a confocal microscope (Carl Zeiss Japan, Tokyo, Japan) [18, 25]. The antibodies used are listed in Supplementary data, Table S1. Immunostaining was quantified using ImageJ software.
Human biopsy samples
We obtained renal biopsy samples of patients with AKI-to-CKD transition from Kochi University Hospital (Supplementary data, Table S3). AKI and CKD were defined according to the criteria of Kidney Disease: Improving Global Outcomes Clinical Practice Guideline [26]. This study was approved by the ethics committee of Kochi University Hospital (Permit Number: G-00098), and all participating patients provided written informed consent.
Statistical analysis
Results are shown as mean ± SEM. Differences between groups were tested using two-way ANOVA followed by Scheffe's test for multiple comparisons. Two groups were compared using unpaired t-tests. P < 0.05 was considered statistically significant.
RESULTS
Serum creatinine, blood urea nitrogen and renal histology after IRI
Zeb2-cKO mice were indistinguishable in appearance from age-matched WT controls, and there was no significant differences in body weight, basal blood urea nitrogen (BUN) and serum creatinine levels, and renal morphology between the two groups. The 35-min bilateral IRI caused renal dysfunction lasting up to 14 days in WT mice and Zeb2-cKO mice. In both groups, bilateral renal IRI induced an increase in creatinine and BUN levels that peaked at 24 h (Figure 1a and b). Renal dysfunction in WT mice was indicated by an increase in serum creatinine from 0.12 ± 0.03 mg/dL before IRI to 0.68 ± 0.16 mg/dL at 24 h after IRI (Figure 1a). However, deficiency of Zeb2 in proximal nephron significantly attenuated the IRI-induced creatinine elevation. Similarly, BUN levels in WT mice increased significantly from 22.4 ± 3.5 mg/dL to 118.6 ± 24.8 mg/dL at 24 h after IRI (Figure 1b), while Zeb2-cKO mice showed marked attenuation of IRI-induced increase in BUN levels. The renal function impairment in WT mice was corroborated by histological evidence at Days 3 and 14 post-IRI. The kidneys of Zeb2-cKO mice showed a very slight loss of tubular epithelial cells and fibrotic changes (positive staining with Masson's trichrome), whereas WT mice showed considerably more tubular necrosis, degradation and fibrotic changes (Figure 1c and e). The tubular injury scores and fibrotic areas for WT mice were significantly higher than that for Zeb2-cKO mice (Figure 1d and f).
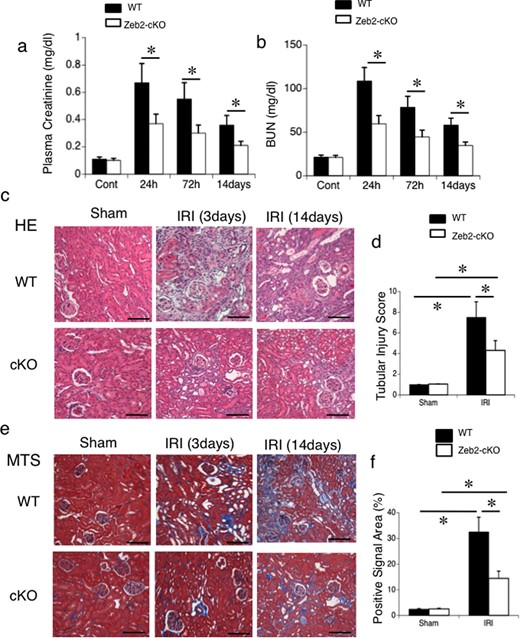
Zeb2-cKO mice are protected against renal IRI. (a) Plasma creatinine and (b) BUN levels were measured as indicators of kidney function in mice exposed to sham operation or IRI (ischemia followed by 24 h, 72 h or 14 days reperfusion). (c) Representative morphology (revealed by hematoxylin–eosin staining) of the kidneys from WT and Zeb2-cKO mice after sham operation or IRI. (d) Semiquantitative assessment of tubular injury in WT and Zeb2-cKO mice at 14 days after sham operation or IRI. (e) Representative morphology (revealed by Masson's trichrome staining) of the kidneys from WT and Zeb2-cKO mice after sham operation or IRI. (f) Semiquantitative assessment of fibrotic changes (positive staining with Masson's trichrome staining) in WT and Zeb2-cKO mice at 14 days after sham operation or IRI. Values represent the mean ± SEM of evaluation from each group (n = 6/group). *P < 0.05. Scale bars = 50 μm.
Zeb2-cKO mice have reduced renal fibrotic markers and kidney injury molecule-1-positive cells post-IRI
To evaluate renal tubulointerstitial fibrosis and tubular cell injury after IRI, we used immunohistostaining of fibrogenic markers (collagen type IV, α-SMA, fibronectin, CTGF) and kidney injury molecule-1 (KIM-1) staining, respectively. On post-IRI Day 14, fibrotic markers, such as collagen type IV, α-SMA, fibronectin and CTGF, were upregulated in WT mice compared with Zeb2-cKO mice (Figure 2a). Quantitative analysis revealed that collagen type IV-, α-SMA-, fibronectin- and CTGF-positive area in WT mice was significantly higher compared with that in Zeb2-cKO mice (Figure 2b–e). At 72 h after IRI, tubular KIM-1 expression was markedly higher in WT mice than that in Zeb2-cKO mice (Figure 2f), and KIM-1-positive cells were significantly fewer in Zeb2-cKO mice compared with that in WT mice (Figure 2g). Consistently, mRNA expression of renal fibrotic markers, determined using RT-PCR, was significantly higher in WT mice compared with that in Zeb2-cKO mice (Figure 3a). We also examined the expression of collagen type IV, α-SMA, fibronectin and CTGF using immunoblotting (Figure 3b), and densitometric analysis revealed a significantly higher expression after IRI in WT mice compared with that in Zeb2-cKO mice (Figure 3c).
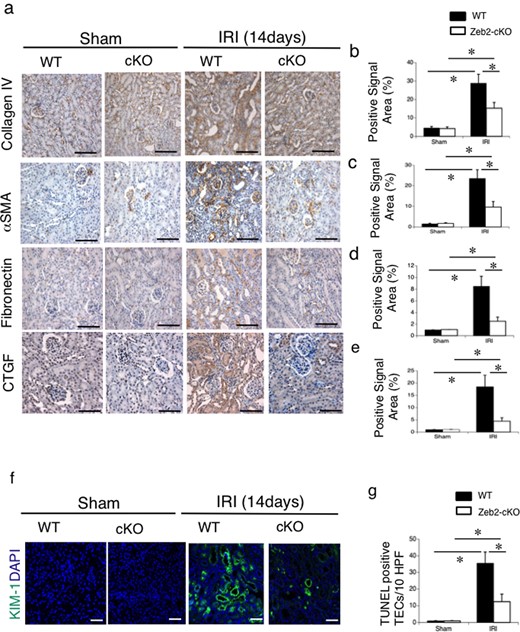
Immunohistochemical analysis of fibrosis markers and KIM-1 in mouse kidneys after IRI. (a) Immunohistochemical analysis of the fibrosis markers, such as collagen type IV, α-SMA, fibronectin and CTGF, in the renal cortex from WT and Zeb2-cKO sham-operated and IRI mice. (b–e) Quantitative assessment of collagen type IV-positive area (b), α-SMA-positive area (c), fibronectin-positive area (d) and CTGF-positive area (e) in WT and Zeb2-cKO mice at 14 days after sham operation or IRI. (f) Immunohistochemical analysis of KIM-1 in the renal cortex from WT and Zeb2-cKO mice at 14 days after sham and IRI mice. (g) Quantitative assessment of KIM-1-positive cells in WT and Zeb2-cKO mice at 14 days after sham operation or IRI. Values represent the mean ± SEM of each group (n = 6/group). *P < 0.05. Scale bars = 50 μm.
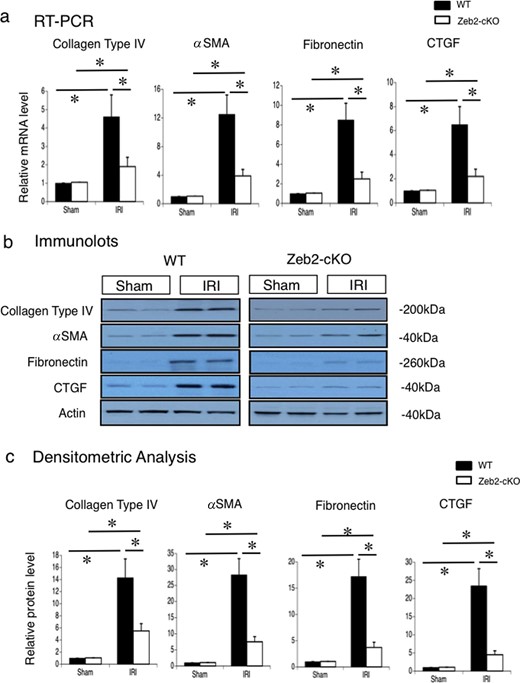
Collagen type IV, α-SMA, fibronectin and CTGF mRNA expression and protein levels in mouse kidneys after IRI. (a) Gene expression of collagen type IV, α-SMA, fibronectin and CTGF in the kidneys, examined using real-time PCR, at 14 days after IRI or sham operation (control) in WT and Zeb2-cKO mice. The expression levels of these genes were normalized to that of 18S rRNA, and they are presented as values relative to the respective expression levels in WT sham-operated kidney. (b) Protein expression of collagen type IV, α-SMA, fibronectin and CTGF in the kidneys, examined through western blotting, at 14 days after IRI or sham operation (control) in WT and Zeb2-cKO mice. (c) Quantitative analysis of collagen type IV, α-SMA, fibronectin and CTGF protein expression. The expression levels were normalized to that of β-actin, and they are presented as values relative to the respective expression levels in WT sham-operated kidney. Data are shown as mean ± SEM, n = 6. *P < 0.05.
Zeb2-cKO mice have reduced infiltration of neutrophils, macrophages and dendritic cells post-IRI
To evaluate infiltration of monocytes and neutrophils after IRI, we used immunohistostaining for neutrophils (7/4 antibody-positive) macrophages (CD11b-positive), and dendritic cells (CD11c-positive). On post-IRI Day 14, infiltration of neutrophils, macrophages and dendritic cells was upregulated in WT mice compared with that in Zeb2-cKO mice (Figure 4). Quantitative analysis revealed that cell numbers of neutrophils, macrophages and dendritic cells in WT mice were significantly higher compared with those in Zeb2-cKO mice (Figure 4b and d).
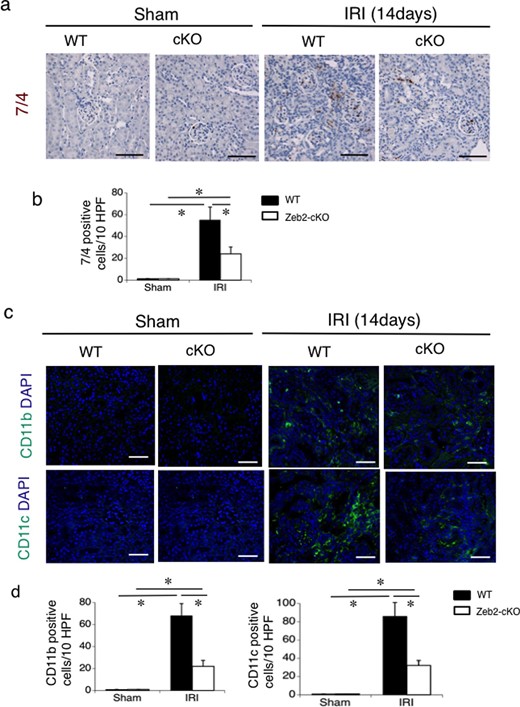
Immunohistochemical analysis of infiltration of neutrophils, macrophages and dendritic cells in mouse kidneys after IRI. (a) Immunohistochemical analysis of the neutrophil marker (7/4 antibody-positive) in the renal cortex from WT and Zeb2-cKO sham-operated and IRI mice. (b) Quantitative assessment of the neutrophil marker (7/4 antibody-positive)-positive cells in WT and Zeb2-cKO mice at 14 days after sham operation or IRI. (c) Immunohistochemical analysis of macrophages (CD11b-positive) and dendritic cells (CD11c-positive), in the renal cortex from WT and Zeb2-cKO sham-operated and IRI mice. (d) Quantitative assessment of macrophages (CD11b-positive) and dendritic cells (CD11c-positive) in WT and Zeb2-cKO mice at 14 days after sham operation or IRI. Values represent the mean ± SEM of each group (n = 6/group). *P < 0.05. Scale bars = 50 μm.
Zeb2 mRNA and protein expression in IRI-induced AKI
To assess the involvement of Zeb2 pathway in IRI-induced kidney injury, we quantified Zeb2 protein expression in the mice kidneys at 72 h after IRI or sham operation. Zeb2 protein levels were significantly higher after IRI than those after sham operation in WT mice; however, Zeb2 protein levels post both sham operation and IRI were very low and did not differ substantially in Zeb2-cKO mice (Figure 5a and b). Similarly, Zeb2 mRNA expression, determined using RT-PCR, was significantly higher after IRI than after sham operation in WT; however, Zeb2 mRNA expression was almost undetectable in post both sham operation and IRI in Zeb2-cKO mice (Figure 5c).
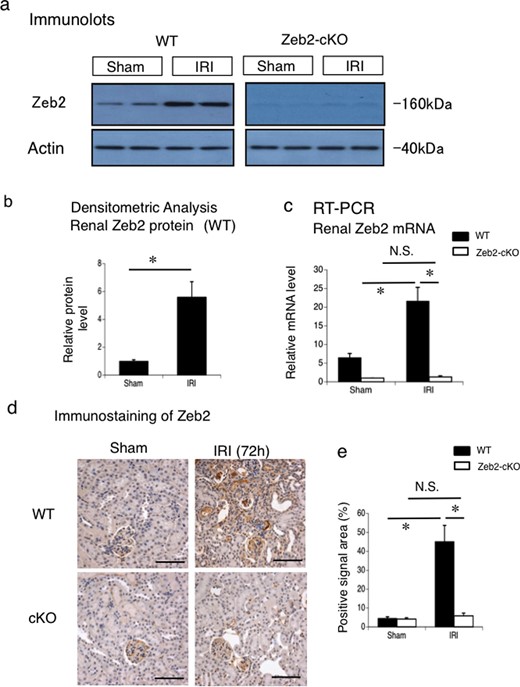
Zeb2 mRNA and protein expression in IRI-induced AKI. (a) Protein expression of Zeb2 in the mouse kidneys, examined using western blotting, at 72 h after IRI or sham operation (control) in WT and Zeb2-cKO mice. (b) Quantitative analysis of Zeb2 protein expression after IRI or sham operation (control) in WT mice. The expression levels were normalized to that of β-actin and are presented as values relative to that in sham-operated kidney. (c) mRNA expression of Zeb2 in mouse kidneys, examined using real-time PCR, at 72 h after IRI or sham operation (control) in WT mice. The expression levels were normalized to that of 18S rRNA and are presented as values relative to that of Zeb2-cKO sham-operated kidney. (d) Immunohistochemical staining of Zeb2 expression in the renal cortex of WT and Zeb2-cKO mice after sham operation and IRI. (e) Quantitative assessment of Zeb2-positive area in WT and Zeb2-cKO mice at 72 h after sham operation or IRI. Data are presented as mean ± SEM, n = 6. *P < 0.05, N.S., not significant. Scale bars = 50 μm.
We examined Zeb2 expression in the kidneys of mice after sham operation and IRI using immunostaining. In Zeb2-cKO mice, no detectable staining was observed in the renal tubules and slight staining was detected in the glomeruli (Figure 5d). In WT mice, Zeb2 staining in the renal tubules increased after IRI (Figure 5d). Quantitative analysis revealed that the number of Zeb2-positive cells increased significantly after IRI in WT mice (Figure 5e).
Hypoxia and CoCl2 upregulated Zeb2 promoter activity and the mRNA and protein expression in MCT cells
To identify the types of stimuli that upregulate Zeb2 expression in renal tubules, we performed promoter-luciferase assay of Zeb2 in MCT cells under conditions of hypoxia or CoCl2 treatment (chemical hypoxia) (Figure 6a). Zeb2 expression in hypoxic or CoCl2-treated MCT cells was evaluated using RT-PCR and western blot analyses, respectively (Figure 6b and c). Hypoxia and CoCl2 stimulated promoter activity and the mRNA and protein expression of Zeb2 in MCT cells (Figure 6). The densitometric analysis revealed significantly higher Zeb2 protein expression under conditions of hypoxia or CoCl2 treatment (Figure 6d). These results indicate that hypoxic stress could stimulate Zeb2 expression post-IRI in vivo.
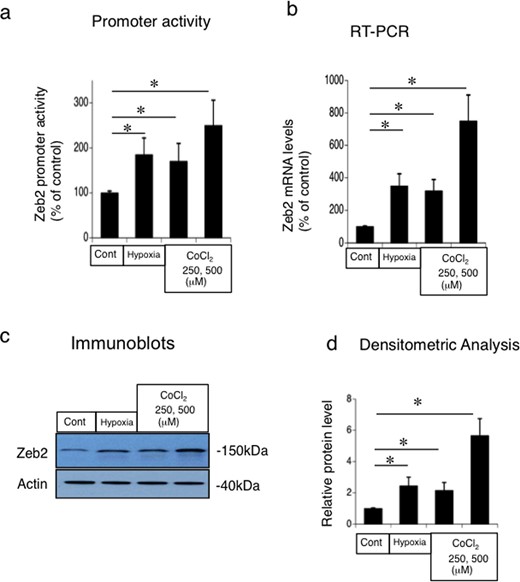
Hypoxia and CoCl2-mediated upregulation of Zeb2 promoter activity and the mRNA and protein expression in mouse renal tubular epithelial (MCT) cell line. (a) Promoter-luciferase assay of Zeb2 in MCT cells under conditions of hypoxia (0% O2; 2 h) or CoCl2 treatment (250 μM, 500 μM; 4 h). (b) RT-PCR analysis of Zeb2 mRNA under conditions of hypoxia (0% O2; 2 h) or CoCl2 treatment (250 μM, 500 μM; 4 h). (c) Immunoblot analysis of Zeb2 under conditions of hypoxia (0% O2; 2 h) or CoCl2 treatment (250 μM, 500 μM; 4 h). (d) Quantitative analysis of Zeb2 protein expression. The expression levels were normalized to that of β-actin and are presented as values relative to that under control condition. Data are presented as mean ± SEM, n = 6. *P < 0.05 versus control.
Regulation of TGF-β, IL-6 and TNF-α expression post IRI in Zeb2-cKO mice
To examine the involvement of cytokines, such as TGF-β, IL-6 and TNF-α, in IRI-induced AKI in Zeb2-cKO mice, we evaluated the mRNA expression in renal tissue at 24 h post-IRI. IRI induced increase in TGF-β, IL-6 and TNF-α mRNA expression in WT and in Zeb2-cKO mice (Figure 7). The increase in the mRNA expression of all three cytokines was relatively high in the WT mice; however, the expression levels did not differ significantly between WT and Zeb2-cKO mice (Figure 7).
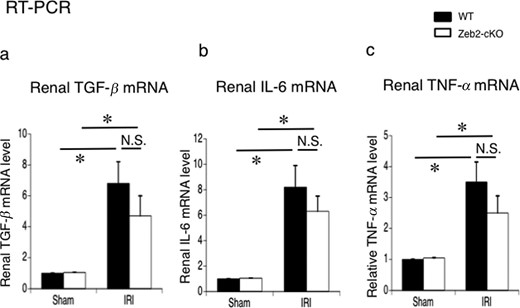
Expression of TGF-β, IL-6 and TNF-α in the mouse kidneys after sham operation (control) and IRI. (a–c) mRNA expression of TGF-β, IL-6 and TNF-α in the kidneys, examined using real-time PCR, at 24 h after IRI or sham operation (control) in WT and Zeb2-cKO mice. The expression levels were normalized to that of 18S rRNA and are presented as values relative to respective expression levels in control. Data are shown as mean ± SEM, n = 6. *P < 0.05, N.S., not significant.
Zeb2 siRNA reduced TGF-β-stimulated collagen type IV, α-SMA, fibronectin, CTGF, CCL2 and CCL5 expression in MCT cells
To evaluate the role of Zeb2 in regulation of fibrotic markers, we treated MCT cells with TGF-β followed by transfection with Zeb2 siRNA or control siRNA. TGF-β treatment significantly increased the mRNA expression of collagen type IV, α-SMA, fibronectin and CTGF in control siRNA-transfected cells, but not in Zeb2 siRNA-transfected cells (Figure 8a). TGF-β treatment upregulated the protein expression of collagen type IV, α-SMA, fibronectin and CTGF in control siRNA-transfected cells, but not in Zeb2 siRNA-transfected cells (Figure 8b and c).
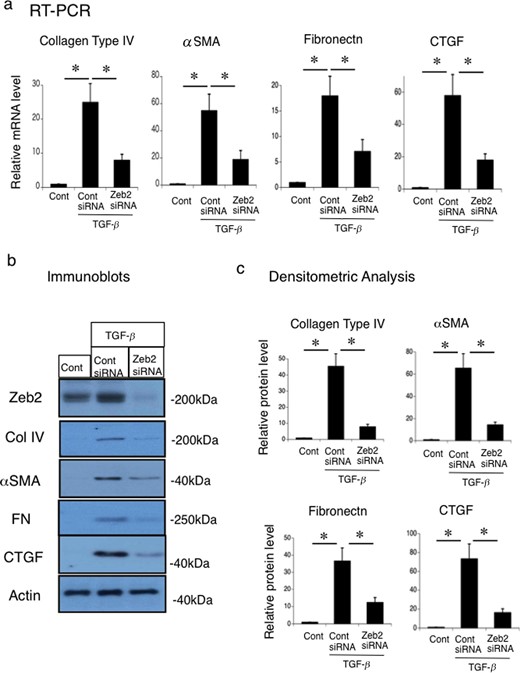
Zeb2 siRNA reduces the TGF-β-stimulated collagen type IV, α-SMA, fibronectin and CTGF expression in mouse renal tubular epithelial (MCT) cell line. MCT cells were transfected with Zeb2 siRNA or control siRNA. At 24 h after transfection, cells were either not treated (control) or stimulated with 50 ng TGF-β for 12 h. (a) mRNA expression of collagen type IV, α-SMA, fibronectin and CTGF were examined using RT-PCR. The expression levels were normalized to that of 18S rRNA and are presented as values relative to the respective expression levels in control. (b) Protein expression of Zeb2, collagen type IV, α-SMA, fibronectin and CTGF were examined using immunoblotting. (c) Quantitative analysis of collagen type IV, α-SMA, fibronectin and CTGF protein expression. The expression levels were normalized to that of β-actin and are presented as values relative to the respective expression levels under control condition. Data are presented as mean ± SEM, n = 6. *P < 0.05 versus control.
To evaluate the role of Zeb2 in the regulation of inflammation mediators, we treated MCT cells with TGF-β and TNF-α followed by transfection with Zeb2 siRNA or control siRNA. TGF-β did not alter the mRNA and protein expression of CCL2 and CCL5 in MCT cells (Figure 9). Zeb2 siRNA did not affect the mRNA and protein expression of CCL2 and CCL5 in the presence of TGF-β in MCT cells. However, TNF-α induced the mRNA and protein expression of CCL2 and CCL5 in MCT cells (Figure 9). Zeb2 siRNA did not affect the TNF-α-induced CCL2 and CCL5 mRNA and protein expression in MCT cells (Figure 9). Therefore, it was considered with Zeb2 does not directly affect CCL2 and CCL5 expression in MCT cells. Zeb2 could induce renal fibrosis mainly through fibrotic molecules such as collagen type IV, α-SMA, fibronectin and CTGF.
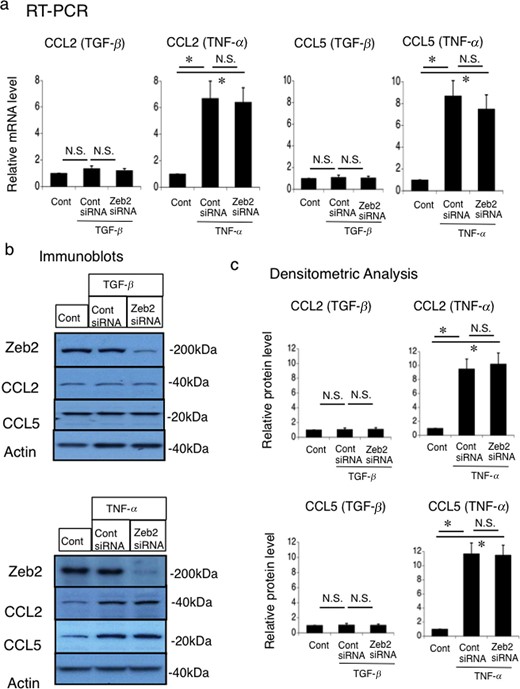
Effects of Zeb2 siRNA on the TGF-β-stimulated and TNF-α-stimulated CCL2 and CCL5 expression in mouse renal tubular epithelial (MCT) cell line. MCT cells were transfected with Zeb2 siRNA or control siRNA. At 24 h after transfection, cells were either not treated (control) or stimulated with 50 ng/mL TGF-β or 10 ng/mL TNF-α for 24 h. (a) mRNA expression of CCL2 and CCL5 was evaluated using RT-PCR. The expression levels were normalized to that of 18S rRNA and are presented as values relative to the respective expression levels in the control. (b) Protein expression of Zeb2, CCL2 and CCL5 was examined using immunoblotting. (c) Quantitative analysis of CCL2 and CCL5 protein expression. The expression levels were normalized to that of β-actin and are presented as values relative to the respective expression levels under control condition. Data are presented as mean ± SEM, n = 6. *P < 0.05 versus control, N.S., not significant.
Increased Zeb2 expression in renal tissues of patients with AKI-to-CKD transition
We analyzed Zeb2 expression in the kidneys of patients with AKI-to-CKD transition by performing immunohistochemical staining of the renal biopsy tissues. In renal tissues of patients with AKI-to-CKD transition, Zeb2 staining was detected mainly in renal tubular cells (Figure 10a). In contrast, weak Zeb2 staining was observed in renal tubular cells of patients with minimal-change nephrosis and immunoglobulin A (IgA) nephropathy (histological grade I) (Figure 10b). Similar results were obtained using immunohistochemical analysis of the renal biopsy tissues from four other patients with AKI-to-CKD transition, two patients with minimal-change nephrosis, and two patients with IgA nephropathy (histological grade I) (data are not shown) (Supplementary data, Table S3).
![Immunostaining for Zeb2 in renal biopsy samples from patients with AKI-to-CKD transition, minimal change and IgA nephropathy. (a) Immunohistochemical staining of Zeb2 in renal biopsy samples from patients with AKI-to-CKD transition. AKI and CKD were defined according to the criteria of Kidney Disease: Improving Global Outcomes Clinical Practice Guideline [26]. upper left: 65-year-old male, drug-induced AKI; upper right: 77-year-old male, pre-renal AKI; lower left: 53-year-old male, drug-induced AKI; lower right: 64-year-old female, pre-renal AKI. (b) Immunohistochemical staining of Zeb2 in renal biopsy samples from patients with minimal change and IgA nephropathy. Left: 34-year-old male, minimal change; Right: 48-year-old female, IgA nephropathy (histological grade I). Scale bars = 50 μm.](https://oup.silverchair-cdn.com/oup/backfile/Content_public/Journal/ndt/37/3/10.1093_ndt_gfab311/1/m_gfab311fig10.jpeg?Expires=1747992007&Signature=1VSbMv-U~IzHApeYGn7-4wI~9pgD3Xoj7pkmZSGc3vyQ6s7cFQEHLOu76rOy-oW3v26HUx9BJtLF7PTfdbgyGY4WvLT4CEIM0lmx-e5Kf4OHSH5iSF7seUzwYyGVJjekJtdwXmQ0dq~lT9XWymHAD~kK7SN4vVj6oLdGbt0mH4gDhy~Gy2baDesFvCZPiDBX4wHJjEk-NmxPoeFvKMm5sp5r9t68zs7etFkeSpfs23i6WSbUMWyKK25PoDXAhhjGePW8SYtVeAbiu2GAcASkxvsCxCzhIGJbRscwSARaypN6h4v5bweWpH9xNqtbCO24vBOAcgVzN7TQ8LwQdGrJOA__&Key-Pair-Id=APKAIE5G5CRDK6RD3PGA)
Immunostaining for Zeb2 in renal biopsy samples from patients with AKI-to-CKD transition, minimal change and IgA nephropathy. (a) Immunohistochemical staining of Zeb2 in renal biopsy samples from patients with AKI-to-CKD transition. AKI and CKD were defined according to the criteria of Kidney Disease: Improving Global Outcomes Clinical Practice Guideline [26]. upper left: 65-year-old male, drug-induced AKI; upper right: 77-year-old male, pre-renal AKI; lower left: 53-year-old male, drug-induced AKI; lower right: 64-year-old female, pre-renal AKI. (b) Immunohistochemical staining of Zeb2 in renal biopsy samples from patients with minimal change and IgA nephropathy. Left: 34-year-old male, minimal change; Right: 48-year-old female, IgA nephropathy (histological grade I). Scale bars = 50 μm.
DISCUSSION
We studied the role of Zeb2 in the pathogenesis of AKI and AKI-to-CKD transition in vivo using Cre-mediated Zeb2-cKO mice, employing a tamoxifen-inducible Cre-Loxp system. We deleted Zeb2 in renal proximal tubule just before IRI in our system. There are two novel findings: first, Zeb2 expression is upregulated following AKI in human and mouse renal tissues. Second, renal tubule-specific deletion of Zeb2 ameliorated fibrosis and improved prognosis in mice with IRI-induced AKI. Therefore, Zeb2 could play key roles in AKI and AKI-to-CKD transition pathogenesis especially in fibrosis, and it could be used as a new therapeutic target for AKI and AKI-to-CKD transition.
Zeb2 was originally identified as a transcriptional co-repressor of the TGF-β signaling pathway through binding to Smad proteins [27, 28]. Zeb2 mutations in humans cause Mowat–Wilson syndrome, craniofacial abnormalities, Hirschsprung disease, congenital heart defects and increased risk of congenital kidney anomalies [10, 11]. The roles of Zeb2 in the pathogenesis of fibrotic diseases with collagen involvement, such as Mowat–Wilson syndrome, and embryogenesis of renal tubules are already documented [12, 29]; however, the pathological function of Zeb2 in AKI and AKI-to-CKD transition is poorly understood. Therefore, we assessed the pathological function of Zeb2 using Zeb2-cKO mice and renal biopsy samples of patients with AKI-to-CKD transition. This study is the first to demonstrate the upregulation of Zeb2 mRNA and protein levels in the renal tissues in mice with post-IRI AKI and in humans with AKI-to-CKD transition.
Inflammation and fibrosis during epithelial injury are major mediators of AKI and AKI-to-CKD transition, and TGF-β, TNF-α and IL-6 are the major cytokines involved in AKI pathogenesis [8, 9]. Our animal study showed that renal tubular cell-specific deletion of Zeb2 ameliorated fibrotic changes after IRI-induced AKI with reduction in collagen type IV, α-SMA, fibronectin and CTGF accumulation. We demonstrated the inhibitory effects of Zeb2 siRNA on TGF-β-stimulated mRNA and protein expression of collagen type IV, α-SMA, fibronectin and CTGF in cultured renal tubular cells. Therefore, the mechanisms underlying the amelioration of renal damage in Zeb2-cKO mice following IRI is, at least in part, because of the reduced fibrotic molecules. Our findings are in accordance with a recent study that showed redundant skin and dermal hypoplasia and miniaturized collagen fibrils in mesoderm-specific Zeb2-deleted mice [15]. The number of infiltrated neutrophils and monocytes was reduced in AKI of Zeb2-cKO mice, compared with that in WT mice. Therefore, Zeb2 plays a role in the inflammatory process after IRI. The mechanisms underlying the influence of Zeb2 in the infiltration of neutrophils and monocytes are not clear; however, there are several possibilities including the direct effects of Zeb2 and that of other microenvironmental conditions. The histological examination was performed 14 days after IRI; therefore, the renal function and tubular injury score were found ameliorated in Zeb2-cKO mice, compared with in the WT mice. It is important to note that many microenvironmental conditions can affect the infiltration of neutrophils and monocytes. Interestingly, there was no significant difference in the expression levels of TGF-β, IL-6 and TNF-α between Zeb2-cKO and WT mice after IRI. The reduction in collagen type IV, α-SMA, fibronectin and CTGF expression could be attributed to the inhibitory effects of Zeb2 deletion on TGF-β signaling. To the best of our knowledge, this is the first study to demonstrate that Zeb2 plays a role in the fibrotic changes after IRI-induced AKI. The precise mechanism of renal fibrosis in AKI-to-CKD transition is still controversial. G2/M cell cycle arrest of tubular epithelial cells following AKI produces profibrogenic cytokines such as TGF-β, activate pericytes and myofibroblasts, and contributes to the development of progressive fibrotic kidney disease [30]. Epithelial-to-mesenchymal transition, regulated by Snail1, plays a key role in renal fibrosis in several mice models [31]. Therefore, the interaction between tubular epithelial cells, pericytes and myofibroblasts, and profibrogenic cytokines (especially TGF-β) are the key factors in the fibrotic changes in AKI-to-CKD transition. This study shows that Zeb2 plays a role in TGF-β-induced fibrosis in AKI-to-CKD transition.
Zeb2 protein expression is upregulated in the renal tubules of patients with AKI-to-CKD transition; however, there is only a marginal increase in the expression of Zeb2 in renal tissue from minimal change and IgA nephropathy (histological grade I). AKI and fibrotic changes are a major risk factor for the progression to CKD and a major pathological factor in AKI-to-CKD transition, respectively; our findings suggest that Zeb2 could play a pathological role in human AKI-to-CKD transition.
We examined the mechanism of Zeb2 induction during IRI. Hypoxia stimulates Zeb2 expression in podocytes, and that hypoxia-inducible factor (HIF)-1α regulates the promoter activity of Zeb2 gene [14, 32]. Hypoxia and CoCl2 treatment (chemical hypoxia) stimulated promoter activity as well as Zeb2 mRNA and protein expression in MCT cells. Therefore, hypoxia caused by IRI may stimulate Zeb2 promoter activity and protein expression in vivo.
There are certain limitations to this study. The number of renal biopsy samples was small. Our evaluation of renal biopsy samples was limited in number and classification of AKI-to-CKD transition. Therefore, evidence for the pathological roles of Zeb2 pathway in human AKI-to-CKD transition is insufficient and further investigations are required to elucidate the clinical relevance of the Zeb2 system in AKI.
In conclusion, to the best of our knowledge, this is the first study to demonstrate increased renal Zeb2 expression post-IRI in mice. Zeb2 protein expression was detected in renal tissues of patients with AKI-to-CKD transition. Zeb2 likely contributes to the pathogenesis of AKI and AKI-to-CKD transition through upregulation of fibrotic molecules. This study offers potential new targets for developing therapeutic and diagnostic strategies for AKI and CKD. Detailed investigation of the role of Zeb2 in AKI-to-CKD transition could provide insights into the pathogenic mechanisms underlying AKI and AKI-to-CKD progression.
ACKNOWLEDGEMENTS
We thank Reiko Matsumoto and Sekie Saito for technical assistance.
AUTHORS’ CONTRIBUTIONS
S.I., Y. Terada, and Y. Taniguchi designed research; S.I., K.N., H.N., T.M. and T.H. performed research; S.F. contributed new reagents/analytic tools; S.S. supervised work; S.I., M.Y. and Y. Terada analyzed data; and M.Y. and Y. Terada wrote the paper.
FUNDING
This work was supported by the Kochi Organization for Medical Reformation and Renewal (grant number ISAI402037 to Y. Terada) and the Ministry of Education, Science, Culture, and Sports of Japan (grant number 18K08212 to Y. Terada).
CONFLICT OF INTEREST STATEMENT
None declared.


Comments