


Abstract
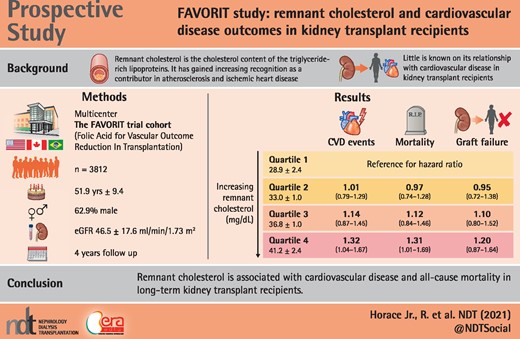
The cholesterol content of circulating triglyceride-rich lipoproteins is characterized as remnant cholesterol, although little is known about its role in the development of cardiovascular disease (CVD) outcomes, all-cause mortality or transplant failure in kidney transplant recipients (KTRs). Our primary aim was to investigate the prospective association of remnant cholesterol and the risk of CVD events in renal transplant recipients with secondary aims evaluating remnant cholesterol and renal graft failure and all-cause mortality among participants in the Folic Acid for Vascular Outcome Reduction in Transplantation (FAVORIT) trial.
Among 4110 enrolled participants, 98 were excluded for missing baseline remnant cholesterol levels and covariates. Nonfasting remnant cholesterol levels were calculated based on the lipid profiles in 3812 FAVORIT trial participants at randomization. A Wilcoxon-type test for trend was used to compare baseline characteristics across remnant cholesterol quartiles. Cox proportional hazards regression was used to evaluate the association of baseline remnant cholesterol levels with time to primary and secondary study outcomes.
During a median follow-up of 4.0 years we documented 548 CVD incident events, 343 transplant failures and 452 all-cause deaths. When comparing the highest quartile (quartile 4) to quartile 1, proportional hazard modeling revealed a significant increase in CVD risk {hazard ratio [HR] 1.32 [95% confidence interval (CI) 1.04–1.67]} and all-cause mortality risk [HR 1.34 (95% CI 1.01–1.69)]. A nonsignificant increase in transplant failure was seen as well [HR 1.20 (95% CI 0.87–1.64)].
Remnant cholesterol is associated with CVD and all-cause mortality in long-term KTRs. A randomized controlled clinical trial in KTRs that assesses the potential impact of remnant cholesterol-lowering therapy on these outcomes may be warranted.
KEY LEARNING POINTS
What is already known about this subject?
Rates of cardiovascular disease (CVD) death in renal transplant recipients (RTRs) remain higher than in the general population, with the rate of CVD death 10 times higher and the annual rate of fatal or nonfatal CVD events 50 times that of the general population.
To our knowledge, we are the first to demonstrate the relationship among elevated remnant cholesterol levels and the risk of CVD events and all-cause mortality in RTRs.
Our findings are important, as many kidney transplant recipients (KTRs) receive less-aggressive CVD risk factor management than would be expected given their underlying comorbid burden.
What this study adds?
In stable KTRs, higher remnant cholesterol level is associated with both CVD events (32% increased risk) and all-cause mortality (31% increased risk). Low-density lipoprotein seems to play an important role in remnant cholesterol and CVD risk.
What impact this may have on practice or policy?
These prospective observations should be confirmed by large randomized controlled intervention trials in order to determine the clinical impact of remnant cholesterol reduction on CVD and all-cause mortality outcomes in stable KTRs.
ADDITIONAL CONTENT
An author video to accompany this article is available at: https://dbpia.nl.go.kr/ndt/pages/author_videos.
INTRODUCTION
Remnant cholesterol is the cholesterol content of triglyceride-rich lipoproteins and is composed of very-low-density lipoproteins (VLDLs) [1] and intermediate-density lipoproteins (IDLs) in the fasting state and of VLDL, IDL and chylomicron remnants in the nonfasting state. Patients with chronic kidney disease (CKD), particularly those with renal transplantation, are at increased risk of developing cardiovascular disease (CVD) [2]. CVD in turn also enhances the rapidity of progression of CKD as is seen in the Chronic Renal Insufficiency Cohort study [3]. Along with CKD progression, metabolic abnormalities may progress further, contributing to atherosclerotic changes and adversely affecting renal function [2, 4]. Rates of CVD death in kidney transplant recipients (KTRs) remain higher than in the general population, with the rate of CVD death 10 times higher and the annual rate of fatal or nonfatal cardiovascular events 50 times that of the general population [4].
Remnant cholesterol in both fasting and nonfasting states is associated with inflammation, oxidative stress, accelerated atherosclerosis and ischemic heart disease [1–10]. Higher levels of triglycerides or non-high-density lipoprotein (HDL) cholesterol in chronic KTRs have been associated with CVD (mainly coronary heart disease) outcomes, total mortality and renal graft loss [1]. While remnant cholesterol, elevated triglycerides and non-HDL cholesterol are correlated, remnant cholesterol remains a distinct class of lipoproteins and therefore its role in cardiovascular outcomes and all-cause mortality in KTRs is unknown.
Therefore our primary aim was to evaluate the association of remnant cholesterol in renal transplant recipients (RTRs) and the risk of CVD events, with secondary aims of evaluating the association of remnant cholesterol and renal graft failure, all-cause mortality and CVD events, using the large Folic Acid for Vascular Outcome Reduction in Transplantation (FAVORIT) trial cohort.
MATERIALS AND METHODS
The completed FAVORIT study was a unique multicenter, multiethnic controlled clinical trial [5, 6] that provided definitive evidence that high-dose, folic acid–based lowering of plasma homocysteine—a putatively thromboatherogenic, amino acid by-product of methionine metabolism [5, 6] did not reduce hard, centrally adjudicated CVD events (both fatal and nonfatal), graft failure or total mortality in chronic stable KTRs [5]. FAVORIT randomized 4110 stable KTRs from August 2002 through January 2007 to either a standard multivitamin with high doses of folic acid (5 mg), vitamin B6 (pyridoxine; 50 mg) and vitamin B12 (cyanocobalamin; 1 mg) versus a multivitamin containing low doses of vitamin B6 (1.4 mg) and vitamin B12 (2 µg) with no folic acid. Follow-up contacts occurred every 6 months through 31 January 2010 to obtain study-related outcomes through 24 June 2009. Both men and women ages 35–75 years who had a kidney transplant for at least 6 months were screened for eligibility at 30 transplantation centers located in the USA, Canada and Brazil. Entry criteria included stable kidney function and CVD event.
Analytic cohort
Among 4110 enrolled participants, 200 were excluded for missing baseline remnant cholesterol levels and 98 with other missing covariates or outcomes (CVD), leaving 3812 participants described in the analysis. KTRs were included in the study population if they had clinically stable kidney function and valid remnant cholesterol data (Figure 1). Demographics data (age, sex and race), smoking status (yes or no), past medical history (diabetes mellitus), physical examination findings [body mass index (BMI), systolic and diastolic blood pressure (SBP and DBP)] and laboratory variables (creatinine and lipoproteins) were collected at study enrollment. Baseline hypertension was defined by SBP ≥140 mmHg, DBP ≥90 mmHg or antihypertensive medication use. Diabetes was defined by the use of insulin or oral hypoglycemic medications or patient history. Smoking status was defined as a current smoker. Race was defined as non-Hispanic white, non-Hispanic black or other. eGFR was estimated using the Chronic Kidney Disease Epidemiology Collaboration equation, a newer estimating equation with better performance at higher GFR levels [8, 10]. BMI was calculated using the formula weight (kg)/height (m) [2]. Serum remnant cholesterol was defined as total cholesterol (TC = HDL + LDL). Nonfasting plasma lipids were measured by standard enzymatic methods with the following intra- and interassay coefficients of variation: TC, intra-assay 1.6% and interassay 2.8%; HDL cholesterol, intra-assay 3.0% and interassay 4.0%; total triglycerides, intra-assay 2.0% and inter-assay 3.4%. Nonfasting plasma LDL cholesterol was estimated using the Friedewald equation at triglyceride levels <400 mg/dL. Consistent with the recent findings of Jorgensen et al. [9], who evaluated nonfasting direct versus estimated LDL among individuals with triglyceride of 88–885 mg/dL (R2 = 0.85, P < 0.001), comparison of LDL values within a mildly to moderately hypertriglyceridemic subsample of our population (i.e. n = 227 subjects with triglyceride levels of 400–<1000 mg/dL), direct versus Friedewald equation-estimated, yielded similar results (R2 = 0.74, P < 0.001), notwithstanding the accepted performance limitations of these estimates in this range of triglycerides. All values of remnant cholesterol were log transformed and categorized into quartiles. Quartiles were based on log transformation prior to exclusion, therefore quartiles have different numbers of participants due to differential exclusions.
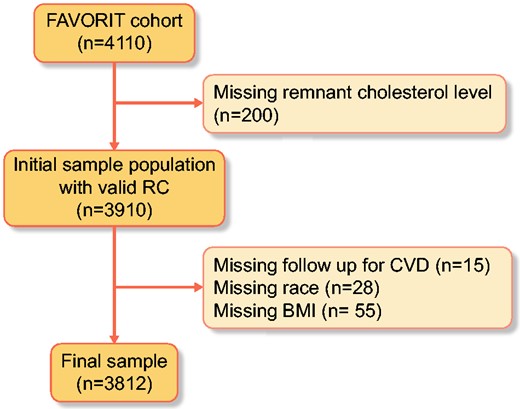
Complete remnant cholesterol cohort. Eligible FAVORIT participants were the 3812 who were not missing baseline remnant cholesterol, baseline CVD, race and BMI.
The primary FAVORIT outcome was pooled incident or recurrent CVD that comprised CVD death, myocardial infarction, resuscitated sudden death, stroke, coronary artery revascularization, lower extremity revascularization or amputation above the ankle for severe arterial disease, carotid endarterectomy or angioplasty, abdominal aortic aneurysm repair or renal artery revascularization [5–7]. The first four components of this primary outcome were centrally reviewed and adjudicated by the FAVORIT Clinical Endpoints Committee; the remaining outcomes were identified through medical record abstraction. The Clinical Endpoints Committee also reviewed records for unstable angina cases and urgent coronary revascularization procedures in search of myocardial infarctions that were not identified by the clinical site staff. All-cause mortality and dialysis-dependent kidney graft failure were secondary outcomes [5].
Jonckheere–Terpstra tests for ordered alternatives (for continuous variables) and a Wilcoxon-type test for trend (for categorical variables) were used to compare baseline characteristics across remnant cholesterol quartiles. Kaplan–Meier survival analysis was used to estimate the survival function among study participants by remnant cholesterol quartiles. Remnant cholesterol was log transformed and categorized into four groups using the respective median value for the analysis. Cox proportional hazards regression was used to evaluate the association of baseline remnant cholesterol levels with time to primary and secondary study outcomes. These models were adjusted for HMG CoA reductase inhibitor (statin) or other lipid-lowering drug use, body mass index, SBP, DBP, albuminuria, age, race, gender, diabetes, graft vintage, smoking status, mechanistic target of rapamycin (mTOR) inhibitors, donor type and treatment arm. Maintenance of proportional hazards assumptions was assessed for the primary and secondary outcome analyses by examination of log–log plotting of survival probability. Additionally, two sensitivity analyses were performed. The first examined the relationship of remnant cholesterol and CVD outcomes with HDL, LDL and triglycerides in the adjusted model. The second sensitivity analysis examined remnant cholesterol and all-cause mortality outcome with HDL, LDL and triglycerides in the extended models. Additionally, we performed a mediation analysis on graft loss against transplant failure outcomes. Analyses were performed using Stata version 15 software (StataCorp, College Station, TX, USA). Two-sided P-values <0.05 were considered statistically significant for all analyses.
RESULTS
Our analytic cohort consisted of 3812 kidney transplant participants, the mean age was 51.9 ± 9.4 years and they were predominantly male (62.9%) and predominantly non-Hispanic white (76.3%). A large percentage had a history of diabetes mellitus (59.6%), largely normotensive and with modestly decreased eGFR (46.5 ± 17.6 mL/min/1.73 m2) (Table 1). The mean serum remnant cholesterol was 34.8 ± 5.2 mg/dL. Individuals with higher remnant cholesterol levels were more overweight or obese, had higher triglycerides, had lower HDL levels, were predominantly male and had slightly lower eGFRs, more albumuria and were more likely to be on lipid-lowering medications.
Baseline characteristics by remnant cholesterol levels
| Characterisitcs | Q1: 28.9 ± 2.4 mg/dL (n = 1070) | Q2: 33.0 ± 1.0 mg/dL (n = 909) | Q3: 36.8 ± 1.0 mg/dL (n = 895) | Q4: 41.2 ± 2.4 mg/dL (n = 938) | Overall : 34.8 ± 5.2 mg/dL (n = 3812) | P-value |
|---|---|---|---|---|---|---|
| Gender, n (%) | <0.001 | |||||
| Male | 680 (62.9) | 584 (63.4) | 555 (61.6) | 580 (61.4) | 2399 (62.9) | – |
| Female | 400 (37.1) | 337 (36.6) | 346 (39.4) | 365 (39.6) | 1413 (37.1) | – |
| Age (years), mean ± SD | 51.3 ± 9.3 | 51.9 ± 9.4 | 51.2 ± 9.6 | 51.8 ± 9.3 | 51.9 ± 9.4 | 0.01 |
| Race/ethnicity, n (%) | <0.001 | |||||
| Non-Hispanic White | 785 (73.3) | 674 (74.1) | 696 (77.8) | 753 (80.3) | 2908 (73.3) | – |
| Non-Hispanic Black | 220 (20.6) | 182 (20) | 142 (15.9) | 121 (12.9) | 665 (20.6) | – |
| Other | 65 (6.1) | 53 (5.9) | 57 (6.3) | 64 (6.8) | 239 (6.1) | – |
| Smoking status, n (%) | 0.009 | |||||
| No | 983 (91.9) | 805 (88.6) | 787 (87.9) | 821 (87.5) | 3396 (89.1) | – |
| Yes | 87 (8.1) | 104 (11.4) | 108 (12.1) | 117 (12.5) | 416 (10.9) | – |
| SBP (mmHg), mean ± SD | 135.5 ± 19.6 | 136.2 ± 19.9 | 136.2 ± 19.4 | 136.6 ± 20.1 | 136.1 ± 19.8 | <0.001 |
| DBP (mmHg), mean ± SD | 78.0 ± 11.8 | 78.3 ± 12.5 | 79.2 ± 12.2 | 78.9 ± 12.5 | 78.6 ± 12.2 | 0.01 |
| Diabetes, n (%) | <0.001 | |||||
| Yes | 490 (45.8) | 337 (37.1) | 330 (37.1) | 381 (40.6) | 2274 (59.6) | – |
| No | 580 (54.2) | 572 (62.9) | 560 (62.9) | 557 (59.4) | 1538 (40.4) | – |
| BMI (kg/m2), mean ± SD | 26.6 ± 5.79 | 28.6 ± 6.29 | 29.6 ± 6.13 | 30.9 ± 6.14 | 29.16 ± 6.02 | <0.001 |
| LDL cholesterol (mg/dL), mean ± SD | 96.9 ± 28 | 101.3 ± 32.7 | 102.4 ± 34.2 | 102.2 ± 41.7 | 100.5 ± 33.9 | 0.01 |
| HDL cholesterol (mg/dL), mean ± SD | 52.9 ± 15.2 | 47.2 ± 13.3 | 44.3 ± 12.4 | 39.5 ± 10.5 | 46.3 ± 13.9 | <0.001 |
| Triglycerides (mg/dL), mean ± SD | 89.9 ± 26.3 | 144.4 ± 59.9 | 202.5 ± 37.9 | 371.6 ± 289.2 | 198.5 ± 182.3 | <0.001 |
| TC (mg/dL), mean ± SD | 167.7 ± 34.9 | 176.8 ± 37.9 | 186.2 ± 39.2 | 209.9 ± 51.1 | 167.7 ± 34.14 | <0.001 |
| eGFR (mL/min/1.73 m2), mean ± SD | 51.5 ± 17.4 | 49.8 ± 17.6 | 47.8 ± 18.3 | 46.0 ± 16.7 | 46.5 ± 17.6 | <0.001 |
| Lipid-lowering medication, n (%) | <0.001 | |||||
| No | 541 (50.6) | 431 (47.4) | 381 (42.6) | 353 (37.7) | 1707 (44.8) | – |
| Yes | 528 (49.4) | 478 (52.6) | 513 (57.4) | 584 (62.3) | 2105 (55.2) | – |
| Donor type, n (%) | – | |||||
| Living | 451 (42.3) | 334 (38.2) | 372 (40.83) | 416 (43.9) | 1567 (42.1) | – |
| Cadaver | 615 (57.7) | 540 (61.8) | 539 (59.17) | 531 (56.1) | 2225 (57.9) | – |
| Albuminuria (μg/mg), n (%) | <0.01 | |||||
| <10 | 400 (36.53) | 319 (34.08) | 278 (30.19) | 289 (30.17) | 1286 (32.89) | – |
| 10–29 | 271 (24.75) | 220 (23.50) | 232 (25.19) | 227 (23.7) | 950 (24.3) | – |
| 30–99 | 321 (29.32) | 292 (31.2) | 298 (32.36) | 289 (30.17) | 1200 (30.69) | – |
| >300 | 103 (9.41) | 105 (11.22) | 113 (12.27) | 153 (15.97) | 474 (12.12) | – |
| Asprin (mg), n (%) | – | |||||
| 0–325 | 74 (6.76) | 74 (7.91) | 58 (6.3) | 62 (6.47) | 267 (6.86) | – |
| 325–650 | 636 (58.08) | 533 (56.94) | 549 (59.61) | 563 (58.77) | 2281 (58.34) | – |
| >650 | 385 (35.16) | 329 (35.15) | 314 (34.09) | 333 (34.76) | 1361 (34.81) | – |
P-value comparisons across remnant cholesterol levels are based on Wilcoxon-type tests for trend for categorical variables and Jonckheere–Terpstra tests for continuous variables.
Among the 3812 participants with complete outcome data, there were 584 new CVD events with 777 participants at risk of an event. When remnant cholesterol was examined as a categorical variable, risk increased progressively through the quartiles (Figure 2A) (P for linear trend <0.001). Within our univariate hazard ratio (HR), we found that smoking status, statins and SBP were all significant covariates within our model across all three outcomes (Table 2). Comparing the highest quartile (Q4: 41.2 ± 2.4 mg/dL) to the reference group (Q1: 28.9 ± 2.4 mg/dL) revealed a statistically significant result of a 32% increase in CVD risk {HR 1.32 [95% confidence interval (CI) 1.04–1.67]} (Table 3). Remnant cholesterol was also associated with increased all-cause mortality compared with Q4 (Figure 2B). There were 466 participants at risk of an event, with 452 events over a mean follow-up time of 4.0 (standard deviation 1.5) years. We observed a higher proportion of events occurring at higher remnant cholesterol levels. Comparison of Q1 with Q4 showed a statistically significant increased risk of 31% [HR 1.31 (95% CI 1.01–1.69); P < 0.04, P for trend = 0.01] (Table 3). A test for trend among quartiles was significant as well (P < 0.02). We found no statistically significant association between remnant cholesterol and graft failure, with 343 graft failure events (Figure 2C).
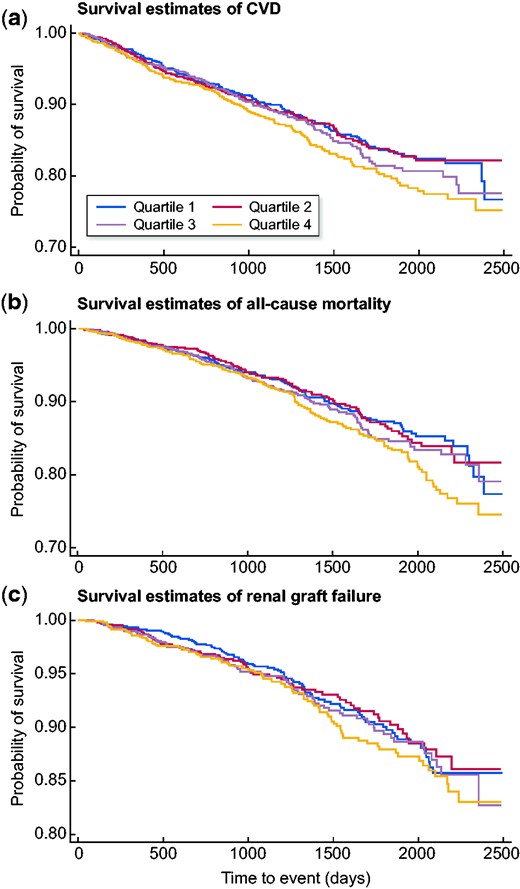
Survival estimates for (A) primary CVD outcomes, (B) all-cause mortality outcomes and (C) renal graft failure stratified by baseline remnant cholesterol levels. Analyses exclude participants with missing covariate data.
Univariate adjusted models for CVD, transplant failure and all-cause mortality events
| Characteristics | Q1: 28.9 ± 2.4 mg/dL | Q2: 33.0 ± 1.0 mg/dL | Q3: 36.8 ± 1.0 mg/dL | Q4: 41.2 ± 2.4 mg/dL | P-value trend |
|---|---|---|---|---|---|
| CVD | |||||
Age | Ref | 0.97 (0.79–1.20) | 1.06 (0.86–1.29) | 1.27 (1.09–1.54) | 0.002 |
| BMI | Ref | 1.00 (0.81–1.23) | 1.16 (0.94–1.42) | 1.34 (1.1–1.63) | – |
| Gender | Ref | 0.98 (0.81–1.21) | 1.13 (0.93–1.38) | 1.30 (1.07–1.57) | – |
| Smoking status | Ref | 0.98 (0.81–1.21) | 1.13 (0.93–1.38) | 1.30 (1.07–1.57) | 0.011 |
| Diabetes | Ref | 1.07 (0.87–1.32) | 1.22 (1.00–1.49) | 1.37 (1.13–1.66) | 0.0001 |
| Race | Ref | 0.98 (0.81–1.21) | 1.12 (0.91–1.36) | 1.30 (1.07–1.57) | – |
| Graft vintage | Ref | 0.98 (0.82–1.23) | 1.13 (0.93–1.38) | 1.30 (1.07–1.58) | – |
| Avg systolic | Ref | 0.98 (0.81–1.21) | 1.12 (0.92–1.37) | 1.19 (1.07–1.56) | 0.001 |
| Avg diastolic | Ref | 0.98 (0.80–1.21) | 1.14 (0.94–1.39) | 1.31 (1.09–1.59) | – |
| Lipid lower drugs | Ref | 0.98 (0.79–1.21) | 1.11 (0.91–1.36) | 1.27 (1.051.54) | 0.009 |
| mTOR inhibitors | Ref | 0.99 (0.81–1.22) | 1.13 (0.92–1.38) | 1.30 (1.07–1.57) | – |
| Donor type | Ref | 0.98 (0.81–1.23) | 1.13 (0.93–1.38) | 1.33 (1.09–1.61) | – |
| Albuminuria | Ref | 0.97 (0.78–1.21) | 1.11 (0.89–1.36) | 1.25 (1.02–1.53) | – |
| Transplant failure | |||||
| Age | Ref | 0.99 (0.72–1.36) | 1.10 (0.81–1.50) | 1.19 (0.89–1.61) | – |
| BMI | Ref | 1.00 (0.73–1.39) | 1.04 (0.76–1.42) | 1.18 (0.87–1.02) | – |
| Gender | Ref | 0.98 (0.71–1.34) | 1.07 (0.78–1.46 | 1.17 (0.87–1.59) | – |
| Smoking status | Ref | 0.96 (0.69–1.31) | 1.04 (0.77–1.42) | 1.13 (1.04–1.53) | 0.001 |
| Diabetes | Ref | 1.02 (0.740–1.39) | 1.11 (0.82–1.51) | 1.20 (0.89–1.62) | – |
| Race | Ref | 0.99 (0.72–1.36) | 1.11 (0.81–1.51) | 1.22 (0.90–1.64) | – |
| Graft vintage | Ref | 0.94 (0.68–1.29) | 1.05 (0.77–1.43) | 1.18 (1.05–1.59) | 0.016 |
| Avg systolic | Ref | 0.97 (0.71–1.36) | 1.06 (0.78–1.46) | 1.15 (1.02–1.55) | 0.001 |
| Avg diastolic | Ref | 0.98 (0,72–1.34) | 1.07 (0.78–1.45) | 1.17 (1.06–1.57) | 0.023 |
| Lipid lower drugs | Ref | 0.99 (0.72–1.36) | 1.09 (0.79–1.48) | 1.19 (1.06–1.61) | 0.001 |
| mTOR inhibitors | Ref | 0.98 (0.72–1.35) | 1.07 (0.78–1.45) | 1.17 (0.56–1.07) | – |
| Donor type | Ref | 1.00 (0.731.37) | 1.09 (0.81–1.49) | 1.19 (0.88–1.61) | – |
| Albuminuria | Ref | 1.01 (0.73–1.41) | 1.03 (0.75–1.41) | 1.02 (0.74–1.37) | – |
| All-cause mortality | |||||
| Age | Ref | 0.98 (0.75–1.29) | 1.03 (0.79–1.34) | 1.25 (0.98–1.60) | 0.01 |
| BMI | Ref | 1.02 (0.78–1.34) | 1.14 (0.88–1.49) | 1.34 (1.04–1.72) | – |
| Gender | Ref | 1.00 (0.77–1.31) | 1.10 (0.85–1.43) | 1.29 (1.01–1.65) | – |
| Smoking status | Ref | 0.99 (0.75–1.29) | 1.09 (0.84–1.42) | 1.27 (1.00–1.62) | 0.004 |
| Diabetes | Ref | 1.06 (0.821.39) | 1.19 (0.92–1.54) | 1.35 (1.06–1.72) | 0.001 |
| Race | Ref | 1.00 (0.76–1.31) | 1.11 (0.86–1.45) | 1.33 (1.04–1.70) | – |
| Graft vintage | Ref | 1.02 (0.771.33) | 1.11 (0.85–1.44) | 1.31 (1.02–1.67) | – |
| Avg systolic | Ref | 0.99 (0.76–1.29) | 1.11 (0.85–1.43) | 1.28 (1.00–1.64) | 0.001 |
| Avg diastolic | Ref | 0.98 (0.75–1.28) | 1.12 (0.86–1.45 | 1.31 (1.02–1.67) | – |
| Lipid lower drugs | Ref | 0.99 (0.76–1.30) | 1.09 (0.84–1.42) | 1.28 (0.99–1.63) | 0.002 |
| mTOR inhibitors | Ref | 1.00 (0.77–1.31) | 1.10 (0.85–1.43) | 1.28 (1.00–1.61) | – |
| Donor type | Ref | 0.99 (0.76–1.30) | 1.10 (0.85–1.43) | 1.33 (1.04–1.71) | – |
| Albuminuria | Ref | 0.98 (0.75–1.31 | 1.07 (0.82–1.41) | 1.26 (0.97–1.63) | – |
Values are presented as HRs and 95% CIs for the univariate model.
Multivariable-adjusted model estimates for clinical events with remnant cholesterol quartiles
| Variables | Q1: 28.9 ± 2.4 mg/dL | Q2: 33.0 ± 1.0 mg/dL | Q3: 36.8 ± 1.0 mg/dL | Q4: 41.2 ± 2.4 mg/Dl | P-value trend | Total events |
|---|---|---|---|---|---|---|
| CVD events | 548 | |||||
| Number at risk | 201 | 165 | 187 | 224 | – | – |
| Crude | Ref | 0.99 (0.81–1.22) | 1.13 (0.93–1.38) | 1.30 (1.08–1.57) | – | – |
| Age adjusted | Ref | 0.97 (0.79–1.19) | 1.06 (0.87–1.29) | 1.27 (1.05–1.54) | <0.001 | – |
| Adjusted for all covariates | Ref | 1.01 (0.79–1.29) | 1.14 (0.87–1.45) | 1.32 (1.04–1.67) | – | – |
| All-cause mortality events | 452 | |||||
| Number at risk | 120 | 99 | 110 | 137 | – | – |
| Crude | Ref | 1.01 (0.77–1.31) | 1.11 (0.86–1.43) | 1.29 (1.01–1.66) | – | – |
| Age adjusted | Ref | 0.98 (0.75–1.29) | 1.03 (0.79–1.34) | 1.25 (0.98–1.60) | 0.013 | – |
| Adjusted for all covariates | Ref | 0.97 (0.74–1.28) | 1.12 (0.84–1.46) | 1.31 (1.01–1.69) | – | – |
| Transplant failure events | – | 343 | ||||
| Number at risk | 96 | 80 | 86 | 98 | – | – |
| Crude | Ref | 0.98 (0.71–1.35) | 1.07 (0.78–1.46) | 1.17 (0.87–1.58) | – | – |
| Age adjusted | Ref | 0.99 (0.72–1.36) | 1.1 (0.81–1.50) | 1.19 (0.89–1.61) | 0.65 | – |
| Adjusted for all covariates | Ref | 0.95 (0.72–1.38) | 1.10 (0.80–1.52) | 1.20 (0.87–1.64) | – | – |
| Adjusted for all covariates without statins | Ref | 0.96 (0.068–1.32) | 1.11 (0.79–1.51) | 1.31 (1.02–1.71) | 0.045 | – |
Values presented as HRs and 95% CIs adjusted for age, race, gender, albuminuria, smoking, diabetes, mTOR inhibitors, treatment arm, SBP, BMI, DBP, graft vintage and lipid-lowering drugs (statins) and living versus deceased donor kidney. Each quartile has the number of participants at risk of an event.
Sensitivity analyses for the outcome of CVD and all-cause mortality risk was examined to assess and compare remnant cholesterol with categorical LDL, HDL and triglycerides (Supplementary Table S1). Our results show decreased risk of CVD events among HDL cholesterol groups (>50 mg/dL) in Q1–Q4 [HR 1.02 (95% CI 0.83–1.26)] compared with lower levels of HDL [<40 mg/dL; HR 1.18 (95% CI 0.98–1.42)]. Increased levels of LDL also carried a 26% increased risk of CVD events with higher levels of LDL >160 mg/dL [HR 1.2 (95% CI 1.01–1.53)] compared with medium (100–159 mg/dL) and lower levels (<99 mg/dL) of LDL. Similar results were seen among the all-cause mortality group, with increased LDL conferring a 16% increased mortality rate in those with LDL >160 mg/dL [HR 1.16 (95% CI 1.04–1.51)]. The total risk for triglycerides showed a nonsignificant and minimal overall effect for CVD risk in all categories. Additionally, our mediation analysis found nonsignificant and marginal effects of graft loss on transplant failure outcome. We found that each 5 mg/dL increase in remnant cholesterol was associated with a 14% increased risk of CVD events and a 13% increased risk of all-cause mortality.
DISCUSSION
We found that in stable KTRs, higher remnant cholesterol level is associated with an increased risk of CVD and all-cause mortality events in our large multicenter long-term KTR cohort after adjustments for the above covariates. These associations do not appear to be confounded by LDL and HDL cholesterol, although HDL seems to have a protective effect and decreased risk when adjusted for. LDL seems to play an important role in remnant cholesterol and CVD risk. Our findings are important, as many KTRs receive less-aggressive CVD risk factor management than would be expected given their underlying comorbid burden [11].
To our knowledge, we are the first to demonstrate the relationship among elevated remnant cholesterol levels and the risk of CVD events and all-cause mortality in RTRs. Currently LDL cholesterol is the target for pharmacotherapy in transplant patients and not triglyceride-rich lipoprotein such as remnant cholesterol. Currently there are no randomized clinical trials evaluating remnant cholesterol treatment targets in KTRs. There also seems to be a lack of information from large multicenter randomized trials as to whether reducing remnant cholesterol in KTRs will reduce the CVD risk, all-cause mortality and graft failure outcomes. However, evidence for increased triglyceride-rich lipoproteins as causal risk factors for CVD and all-cause mortality is emerging [12–17]. We believe that graft loss is not a confounder of the mortality outcomes but rather a mediator in the causal pathway. An observational study by Pilmore et al. examining extreme nonfasting remnant cholesterol versus extreme LDL cholesterol found only extreme nonfasting remnant cholesterol to be stepwise associated with increased all-cause mortality in the general population [11]. Similar observational results showed a causal association between increased concentrations of nonfasting triglycerides (a marker of increased remnant cholesterol) and all-cause mortality [14, 15]. Our study also showed that statin use was associated with reduced mortality rates in a large cohort of KTRs. Previous trials have consistently demonstrated that statins reduce cardiovascular morbidity and mortality in the general population; however, in renal patients—especially in KTRs—the beneficial effects of statins are less well established [18, 19].
The biological mechanisms that explain the results are the following: remnant cholesterol is the cholesterol content of the triglyceride-rich lipoproteins composed of VLDL and IDL in the fasting state and of these two lipoproteins together with chylomicron remnants in the nonfasting state [4]. Recent studies indicated that the atherogenicity of chylomicron remnants is also strong and chylomicron remnants are contained in atherosclerotic plaque as VLDL remnants [20] and these atherogenic remnants in patients with advanced CKD and kidney transplant have major adverse consequences [21]. By limiting the reuptake of lipids in the adipocytes, downregulation of lipoprotein receptors and lipase contributes to the accelerated progression of reduced renal ability, especially in renal transplant patients [22]. Additionally, oxidized LDL binding and other phospholipids to the receptors cause a cascading event that releases pro-inflammatory cytokines that contribute to the development of inflammation associated with chronic kidney disease [23]. Therefore the circulating oxidized lipoprotein remnants disseminate and sustain the flames of oxidative stress throughout the body by initiating a lipid peroxidation chain reaction [24, 25]. In this context, oxidized lipids and lipoproteins are both the cause and consequence of oxidative stress that could play a role in CVD and total mortality events.
We acknowledge the strengths of the study. First, the robust sample size of the FAVORIT cohort, ascertainment of outcome events and measurement of the laboratory values were valuable in the study. There are also limitations. One limitation in the study included the fact that trial participants were excluded for missing remnant cholesterol levels, although this was uncommon. Compared with the general CKD population, our study may have some limitations in terms of generalizability because of restriction to KTRs. Additionally, we lack information on baseline coronary artery disease, duration of dialysis and acute transplant rejection that would enhance our understanding of those who are at risk at baseline. Some caution is warranted when interpreting our statin results. Because our study patients were not randomly allocated to statin treatment, the possibility of confounding by indication must be considered due to the possibility that those with higher CVD risk are more than likely prescribed statins, causing bias within the statin group. Furthermore, the data are purely observational, based on a calculation of remnant cholesterol, and cannot address directly whether lowering remnant cholesterol concentrations would favorably affect any of the outcomes studied. The calculations of remnant cholesterol include both HDL and LDL, therefore we cannot directly put all three within the model.
In conclusion, in a large cohort of patients with kidney transplants followed for 4 years, we found that baseline levels of remnant cholesterol were highly associated with CVD and all-cause mortality. These prospective observations should be confirmed by large randomized controlled intervention trials in order to determine the clinical impact of remnant cholesterol reduction on CVD and all-cause mortality outcomes in stable KTRs.
SUPPLEMENTARY DATA
Supplementary data are available at ndt online.
ACKNOWLEDGEMENTS
We would like to acknowledge the tremendous contributions of the participants in the study and the contributions of the doctors, nurses and administrative staff in the hospitals and clinical centers in Brazil, Canada and the USA who assisted with the trial.
FUNDING
The FAVORIT trial is supported by cooperative agreement U01-DK61700 from the National Institutes of Health National Institute of Diabetes and Digestive and Kidney Diseases. Funders of this study did not have any role in study design; collection, analysis and interpretation of data; writing the article; or the decision to submit the article for publication.
CONFLICT OF INTEREST STATEMENT
All of the authors declare that they have no relevant financial interests. The authors whose names are listed as authors on this manuscript certify that they have no affiliations with or involvement in any organization or entity with any financial interest (such as honoraria; participation in speakers’ bureaus; membership, employment, consultancies, stock ownership or other equity interest; and expert testimony or patent-licensing arrangements), or nonfinancial interests (such as personal or professional relationships, affiliations, knowledge or beliefs) in the subject matter or materials discussed in this article.


Comments