


Abstract
Intradialytic cycling (IDC) may provide cardiovascular benefits to individuals receiving haemodialysis, but the exact mechanism behind these improvements remains unclear. The primary aim of this study was to investigate the effect of a 6-month programme of IDC on circulating endotoxin (secondary analysis from the CYCLE-HD trial). Secondary aims were to investigate changes in circulating cytokines [interleukin-6 (IL-6), IL-10, tumour necrosis factor-α, C-reactive protein (CRP) and the IL-6:IL-10 ratio] and their associations with physical activity, fitness and cardiovascular outcomes.
Participants were randomized to either a 6-month programme of IDC (thrice weekly, moderate intensity cycling at a rating of perceived exertion of 12–14) in addition to usual care (n = 46) or usual care only (control group; n = 46). Outcome measures were obtained at baseline and then again at 6 months.
There was no significant (P = 0.137) difference in circulating endotoxin between groups at 6 months (IDC group: 0.34 ± 0.08 EU/mL; control group: 0.37 ± 0.07 EU/mL). There were no significant between-group differences in any circulating cytokine following the 6-month programme of IDC. Higher levels of physical activity and fitness were associated with lower levels of endotoxin, IL-6, CRP and IL-6:IL-10 ratio.
Our data show no change in circulating endotoxin or cytokines following a 6-month programme of IDC. However, higher levels of physical activity outside of haemodialysis were associated with lower levels of inflammation.
KEY LEARNING POINTS
What is already known about this subject?
Systemic inflammation is an independent risk factor associated with mortality in the haemodialysis (HD) population. Intradialytic cycling (IDC) programmes have been shown to induce an anti-inflammatory response and have the potential to mitigate this risk.
Individuals receiving HD have elevated levels of circulating endotoxin. Exercise-induced alterations in haemodynamics may exacerbate this phenomenon through disturbances to the gastrointestinal barrier (a vulnerable vascular bed).
The subsequent translocation of endotoxin, a highly pro-inflammatory particle, may expose individuals to heightened mortality risk.
It is currently unclear as to what effect IDC has on circulating endotoxin and cytokines.
What this study adds?
Following a 6-month programme of IDC (as part of the CYCLE-HD trial), there was no significant change in circulating endotoxin.
We did not observe any change in measured cytokines [interleukin-6 (IL-6), IL-10, tumour necrosis factor-α and C-reactive protein (CRP)] following the 6-month programme. In addition, we found that levels of endotoxin and inflammation were associated with physical activity and physical fitness. Similar to findings in other populations, we also reported higher levels of endotoxin in diabetic participants.
What impact this may have on practice or policy?
We have shown that a 6-month programme of IDC did not increase circulating endotoxin or any measured cytokine. This provides further evidence that IDC is safe.
We also found that higher levels of physical activity were associated with lower levels of endotoxin and inflammation. Therefore, programmes of IDC (alongside other lifestyle advice) may play a role in initially encouraging behaviour change (increased physical activity levels) away from the HD unit, which may lower levels of inflammation in the long term.
INTRODUCTION
Individuals with end-stage kidney disease (ESKD) have a significantly increased risk of cardiovascular disease (CVD) [1], which is the leading cause of death in this population [2]. This excessive rate of CVD in individuals with ESKD who are receiving haemodialysis (HD) is not explained by traditional risk factors alone [3] and is believed to be the result of the different pathophysiological processes that drive CVD in this population. Thus targeting the non-traditional risk factors that are specific to chronic kidney disease (CKD), such as systemic inflammation [4], may be more efficacious in lowering risk in this population.
The gastrointestinal tract is the principle source of endotoxin, a potent inducer of pro-inflammatory cytokines in the HD population [5, 6]. Individuals with ESKD receiving HD are susceptible to several unique factors that can alter the integrity of the intestinal barrier, resulting in the translocation of endotoxin into the central circulation [5]. Chronically elevated levels of circulating endotoxin and markers of inflammation, including interleukin-6 (IL-6), C-reactive protein (CRP) and tumour necrosis factor-α (TNF-α) have been reported in individuals receiving HD [6–8] and are associated with both an increased risk of cardiovascular events and mortality [6, 7].
Programmes of cycling during dialysis [intradialytic cycling (IDC)] are being increasingly employed at HD units [9] and may offer therapeutic benefits, including purported anti-inflammatory effects [10]. However, strenuous exercise in the general population has been shown to disturb the intestinal barrier and results in increases in circulating endotoxin [11]; these physiological changes may be exacerbated when cycling during dialysis [5]. Lastly, low levels of physical activity have been associated with increased levels of endotoxin in the general population [12, 13]. How physical activity and fitness levels are associated with levels of endotoxin in the HD population is currently not known. Therefore the primary aim of this study was to investigate the effect of a 6-month programme of IDC on circulating endotoxin in individuals receiving prevalent HD. Secondary aims were to investigate the effect of a 6-month programme of IDC on circulating cytokines (IL-6, IL-10, TNF-α, CRP and the IL-6:IL-10 ratio) and to investigate associations between levels of physical activity, circulating endotoxin, cytokines and cardiovascular outcomes. Lastly, we also investigated the effect of diabetes status, HD vintage and vascular access on circulating endotoxin.
MATERIALS AND METHODS
Study design
This is a secondary pre-specified analysis of data from participants enrolled in the CYCLE-HD trial (ISRCTN11299707; Improving cardiovascular health in dialysis patients using a structured programme of exercise) [14]. Detailed descriptions of the trial design, including randomization, specific inclusion and exclusion criteria and data collection procedures, are described elsewhere [15]. Briefly, in an open-label, blinded endpoint, cluster randomized controlled trial, adults undergoing maintenance HD (standard treatment of 4 h, three times a week) received either a 6-month structured, progressive programme of IDC (IDC group) or standard care (control group). The primary outcome of the CYCLE-HD trial was to assess the effects of a 6-month intradialytic programme of exercise on left ventricular (LV) mass, with pre-specified secondary outcomes including endotoxin, IL-6, IL-10, CRP and TNF-α (blood markers of inflammation) reported here.
Participants
Prevalent (>3 months) individuals receiving HD ≥18 years of age were eligible for inclusion. Major exclusion criteria included inability to participate in the current exercise programme due to perceived physical or psychological barriers, unable to undergo magnetic resonance imaging (MRI) scanning and unfit to undertake exercise according to the American College of Sports Medicine guidelines. The trial was given ethical approval by the National Health Service (NHS) Research Ethics Committee East Midlands (Northampton, UK; Ref: 14/EM/1190). The trial was conducted according to the Declaration of Helsinki and all participants provided written informed consent.
Intradialytic exercise intervention, control and adherence
As part of the CYCLE-HD trial, the intervention group used specially adapted and calibrated exercise bicycles (Letto series; Motomed, Reck, Germany) three times a week during dialysis for 6 months, aiming for 30 min continuous cycling at a Borg rating of perceived exertion (RPE) of 12–14 (‘somewhat hard’) [16], which was recorded at the end of each session. Resistance was adjusted by increasing the gears on the bike as required to progress training. Progressive training was allowed for participants unable to complete 30 min of continuous cycling until the target was achieved and participants were allowed to complete longer exercise periods if they requested. Participants were visited regularly throughout the intervention to ensure compliance and progression. Apart from the exercise intervention in the IDC group, usual care was continued in both groups. Both groups continued ‘standard care’ to allow assessment of the effects of IDC in addition to usual dialysis care. Adherence to the IDC programme was measured by the number and percentage of sessions that participants cycled against the number that they were eligible to cycle for.
Samples size
As this is a secondary per-protocol analysis of the CYCLE-HD trial [14, 15], no a priori sample size calculation is provided.
Blood sampling
Blood samples were collected from the arterial needle immediately before HD (but not after the ‘long’ interdialytic break). Briefly, 7.5 mL of blood was collected into a S-Monovette K3 ethylenediaminetetraacetic acid (EDTA)-treated tube (Sarstedt, Nümbrecht, Germany) to be centrifugated at 2500 g for 15 min at 20°C. The plasma from the EDTA-treated tube was pipetted into a 2-mL polypropylene microtube (Sarstedt) before being stored at −80°C for later analysis (plasma endotoxin, IL-6, IL-10, TNF-α and CRP).
Physical activity
Levels of physical activity were measured from bi-axial accelerometers (SenseWear; BodyMedia, Pittsburgh, PA, USA). Participants were given the accelerometer and instructed to wear it for 7 days on the upper arm (the opposite arm of their vascular access). They were instructed to remove the equipment only for bathing or any other water activity. Accelerometer data were included for analysis as long as it was worn for a minimum of 3 days and included at least one HD day and two non-HD days, as previously recommended [17]. Total steps taken were calculated. For each participant, steps-per-day data were calculated as the average for total days worn (the total number divided by days worn).
Physical fitness
Physical fitness was assessed using the incremental shuttle walking test (ISWT) and the 60-s sit-to-stand (STS60) test. The ISWT required participants to walk up and down a 10-m course as previously described [18]. The STS60 is a measure of lower body strength and muscle endurance. For this test, the participant sat on a seat with his/her feet slightly apart. With hands across the chest, participants were asked to perform as many STS cycles as they could in 60 s. These tests were chosen because they have been well tolerated when used previously in this population [19, 20].
Endotoxin measurement
Plasma endotoxin was quantified according to the manufacturer’s protocol using the Limulus Amebocyte Assay (LAL) Chromogenic Endotoxin Quantification Kit (Pierce Biotechnology, Rockford, IL, USA). The detection limit of this assay was 0.1 EU/mL. All samples were run in duplicate and background subtracted. Endotoxin analysis was performed in May 2019.
Cytokine analysis
IL-6, -10 and TNF-α were quantified according to the manufacturer’s instructions using the Proinflammatory Panel 1 assay (Meso Scale Discovery, Rockville, MD, USA). Briefly, the sample and solution containing the labelled detection antibodies were mixed over the course of one or more incubation periods. A Meso Scale Discovery read buffer was then added and the plate was added into the instrument for analysis. The interassay coefficient of variation (CV) was 5.2%, 5.7% and 6.1% and the lower limit of detection was 0.06, 0.03 and 0.04 for IL-6, IL-10 and TNF-α, respectively. CRP was quantified according to the manufacturer’s instructions using the CardioPhase high-sensitivity CRP assay (Siemens Healthcare Diagnostics, Marburg, Germany). Briefly, the plasma sample was mixed with the latex reagent and turbidity was measured at 571 nm. The interassay CV was 5.3% and the minimum detection limit was 0.16 mg/L. Cytokine analysis was performed in December 2019.
Cardiovascular outcome measurement
All participants underwent cardiac MRI (CMR) as part of the CYCLE-HD trial on a 3-T platform (Skyra; Siemens Medical Imaging, Erlangen, Germany). LV mass and volumes, LV ejection fraction, aortic pulse wave velocity and native T1 mapping were acquired using CMR; acquisition and analysis has been previously described [14].
Statistical analysis
All statistical analysis of data was performed using SPSS for Windows, version 22.0 (IBM, Armonk, NY, USA). Figures were produced on GraphPad Prism version 7 (GraphPad Software, San Diego, CA, USA). All data are presented as mean ± standard deviation unless otherwise stated. Data were checked for normality by observing the histogram plot and the P-value from the Shapiro–Wilk test. Data not normally distributed (IL-6, IL-10, CRP and IL-6/IL-10) were converted by natural log (base-e) transformation prior to analysis. An independent sample t-test was performed to assess the difference in circulating endotoxin between participants based on the presence of diabetes and HD vintage (<1 year compared with >1 year). A one-way analysis of variance (ANOVA) was used to compare differences between vascular access type. An analysis of covariance (ANCOVA) was performed to compare differences between groups (IDC versus control) at 6 months for plasma endotoxin, IL-6, IL-10, TNF-α, CRP and IL-6:IL-10 ratio with baseline value, age, presence of diabetes and ischaemic heart disease controlled as covariates. A Pearson’s correlation was performed to investigate associations between circulating endotoxin, cytokines and cardiovascular outcomes. Multiple linear regression analysis was performed to evaluate the independent association of baseline endotoxin, IL-6, IL-10, TNF-α, CRP and IL-6:IL-10 ratio with steps per day, STS60 score and distance walked in the ISWT (unadjusted model). Age, presence of diabetes and ischaemic heart disease were used as additional covariates in an adjusted model. Effect size (ES) was calculated using Cohen’s D for the 6-month endotoxin values. Statistical significance was accepted at P < 0.05.
RESULTS
The CYCLE-HD trial recruited from March 2015 until April 2018. A total of 92 participants (IDC group, n = 46; control group, n = 46) had endotoxin data at baseline and 6 months (Supplementary data, Figure S1). Table 1 shows the baseline demographics for all participants. Participants performed an average of 3047 ± 3036 steps per day at baseline. Participants walked on average 266 ± 171 m in the ISWT and scored 16 ± 12 in the STS60 at baseline. Baseline endotoxin values were significantly higher in participants with diabetes at baseline compared with non-diabetic participants (0.37 ± 0.07 versus 0.32 ± 0.09; P = 0.018) (Table 2). There was no statistically significant difference in endotoxin levels based on HD vintage or vascular access (Table 2).
Baseline demographic data
| Group | Control group (n = 46) | IDC (n = 46) |
|---|---|---|
| Age (years), mean ± SD | 61 ± 14 | 53 ± 15 |
| Male, n (%) | 38 (83) | 29 (63) |
| Height (cm), mean ± SD | 168 ± 12 | 168 ± 10 |
| Target weight (kg), mean ± SD | 78 ± 22 | 77 ± 16 |
| BMI (kg/m2), mean ± SD | 27.47 ± 6.15 | 27.06 ± 5.71 |
| Dialysis vintage (months), mean ± SD | 25 ± 32 | 26 ± 29 |
| Dialysis access, n (%) | ||
| Arteriovenous fistula | 36 (78.3) | 27 (58.7) |
| Venous catheter | 8 (17.4) | 16 (34.8) |
| Arteriovenous graft | 2 (4.3) | 3 (6.5) |
| Ultrafiltration volume (L), mean ± SD | 2.2 ± 0.9 | 2.1 ± 0.8 |
| Systolic BP (mmHg), mean ± SD | 145 ± 35 | 130 ± 31 |
| Diastolic BP (mmHg), mean ± SD | 66 ± 17 | 68 ± 18 |
| Hypertension, n (%) | 30 (65%) | 30 (65%) |
| Diabetes, n (%) | 21 (46%) | 15 (33%) |
| Albumin (g/L), mean ± SD | 36 ± 5 | 37 ± 5 |
| Parathyroid hormone (pmol/L), mean ± SD | 39 ± 34 (n = 32) | 42 ± 43 (n = 34) |
| Haemoglobin (g/L), mean ± SD | 110 ± 21 | 116 ± 13 |
| Calcium (mmol/L), mean ± SD | 2.35 ± 0.21 | 2.35 ± 0.13 |
| Phosphate (mmol/L), mean ± SD | 1.60 ± 0.57 | 1.73 ± 0.54 (n = 45) |
| Total weekly dose EPO (U), mean ± SD | 7552 ± 5171 | 6383 ± 6320 |
| Total weekly dose intravenous iron (mg), mean ± SD | 54 ± 97 | 55 ± 110 |
| ACEi/ARB, n (%) | 8 (17) | 14 (30) |
| β-blocker, n (%) | 22 (48) | 22 (48) |
| Calcium channel blockers, n (%) | 20 (43) | 17 (37) |
| Diuretics, n (%) | 16 (35) | 7 (15) |
All participants received HD for 4 h, three times a week. The dialysis surface area and the dialysate concentrations were all individualized (and therefore heterogeneous) for participants and are not reported.
Comparisons between endotoxin levels at baseline for presence of diabetes, HD vintage and vascular access
| Presence of diabetes | Endotoxin value (EU/mL) | P-value for independent t-test | HD vintage | Endotoxin value (EU/mL) | P-value for independent t-test | Vascular access | Endotoxin value (EU/mL) | P-value for one-way ANOVA |
|---|---|---|---|---|---|---|---|---|
| Diabetes (n = 36) | 0.37 ± 0.08 | 0.018 | <1 year (n = 42) | 0.34 ± 0.08 | 0.804 | Arteriovenous fistula (n = 63) | 0.34 ± 0.09 | 0.169 |
| Non-diabetic (n = 56) | 0.32 ± 0.09 | >1 year (n = 50) | 0.34 ± 0.09 | Central venous catheter (n = 24) | 0.33 ± 0.08 | |||
| Arteriovenous graft (n = 5) | 0.41 ± 0.05 |
Adherence to training programme and progression of training
The participants in the IDC group completed 2813 of 3824 offered exercise sessions (74%). Similar to the exercise data from the participants included in the main CYCLE-HD analysis, exercise intensity measured using RPE for the last 12 exercise sessions was comparable to that of the first 12 exercise sessions (12 ± 2 versus 12 ± 1). There was an increase in overall exercise duration (36 ± 12 to 39 ± 17 min), exercise energy expenditure (74 ± 56 to 86 ± 51 kcal) and average power per session (15 ± 11 to 18 ± 10 W) in the last 12 sessions compared with the first 12 sessions.
Circulating endotoxin
Circulating levels of endotoxin did not change from baseline to 6 months in the IDC group (0.34 ± 0.08 to 0.34 ± 0.08 EU/mL) but there was a small increase in the control group (0.34 ± 0.09 to 0.37 ± 0.07 EU/mL) (Figure 1). The between-group 6-month difference was not significant (ANCOVA difference between groups at 6 months P = 0.137; ES = 0.39).
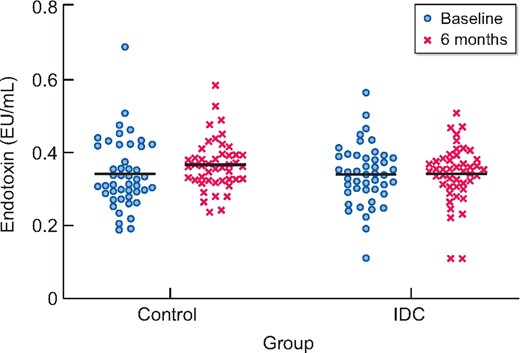
Plasma endotoxin concentrations for IDC (n = 46) and control (n = 46) participants at baseline and 6 months. Line indicates the mean value. No between-group difference at 6 months (P = 0.137).
Circulating cytokines
There were five CRP samples below the minimum detection limit of <0.16, which were assigned the value of 0.16. The effect of a 6-month programme of IDC on circulating IL-6, IL-10, TNF-α, CRP and IL-6:IL-10 ratio is presented in Table 3. There was no significant difference between groups after the 6-month programme of IDC in any circulating cytokine (Table 3).
Circulating cytokines for all participants at baseline and 6 months
| Cytokines | Control (n = 46) | IDC (n = 46) | ANCOVA P-value (group) | ||
|---|---|---|---|---|---|
| Baseline | 6 months | Baseline | 6 months | ||
| IL-6 (ng/L), mean ± SD | 3.02 ± 3.18 | 3.11 ± 2.31 | 3.12 ± 2.75 | 3.17 ± 2.73 | 0.087 |
| IL-10 (ng/L), mean ± SD | 0.51 ± 0.27 | 0.54 ± 0.37 | 0.55 ± 0.54 | 0.46 ± 0.24 | 0.372 |
| TNF-α (ng/L), mean ± SD | 6.44 ± 1.77 | 6.24 ± 2.00 | 6.73 ± 2.05 | 6.11 ± 1.37 | 0.575 |
| CRP (mg/L), mean ± SD | 13.10 ± 18.61 | 13.80 ± 18.39 | 13.93 ± 31.02 | 15.76 ± 33.30 | 0.250 |
| IL-6:IL-10 ratio, mean ± SD | 6.63 ± 5.86 | 6.93 ± 6.06 | 7.15 ± 6.56 | 9.02 ± 10.13 | 0.497 |
Baseline association between circulating endotoxin, cytokines, physical activity and physical fitness
There were significant negative associations between endotoxin and both steps per day (β = −0.235, P = 0.035) (Figure 2) and the STS60 (β = −0.240, P = 0.027) in the unadjusted model (Figure 3). However, when adjusting for covariates (age, presence of diabetes and ischaemic heart disease), the associations were not significant (β = −0.178, P = 0.143 and β = −0.229, P = 0.071 for steps per day and STS60, respectively). There was a non-significant negative association between distance walked in the ISWT and circulating endotoxin (β = −0.188, P = 0.086 for the unadjusted model and β = −0.152, P = 0.232 when adjusting for covariates) (Figure 4). Associations between steps per day, ISWT, STS60 and circulating cytokines are displayed in Table 4. There were significant negative associations between steps per day and levels of IL-6 and CRP that remained after adjustment for covariates (Table 4). An association between steps per day and the IL-6:IL-10 ratio was observed, but this did not remain after adjustment (Table 4). There were also significant associations between the ISWT, STS60 and both CRP and the IL-6:IL-10 ratio, respectively (remaining after adjustment) (Table 4). There was one participant who performed 19 905 steps per day. When this participant was removed from the analysis, the unadjusted negative association between endotoxin and steps per day was not significant (β = −0.148, P = 0.189). However, removing this participant did not change the pattern of results for IL-6, CRP and the IL-6:IL-10 ratio (see Supplementary data, Table S1).
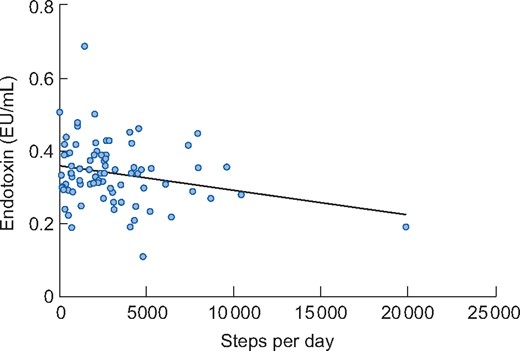
Association between endotoxin and steps per day in participants (n = 81) at baseline. There was a significant association in the unadjusted model (β = −0.235, P = 0.035). However, when adjusting for covariates (age, presence of diabetes and ischaemic heart disease), the association was not significant (β = −0.178, P = 0.143).
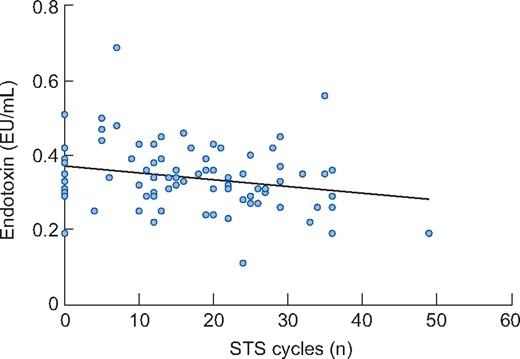
Association between endotoxin and the number of cycles performed in the STS60 in participants (n = 85) at baseline. There was a significant association between endotoxin and the STS60 in the unadjusted model (β = −0.240, P = 0.027). However, when adjusting for covariates (age, presence of diabetes and ischaemic heart disease), the association was not significant (β = −0.229, P = 0.071).
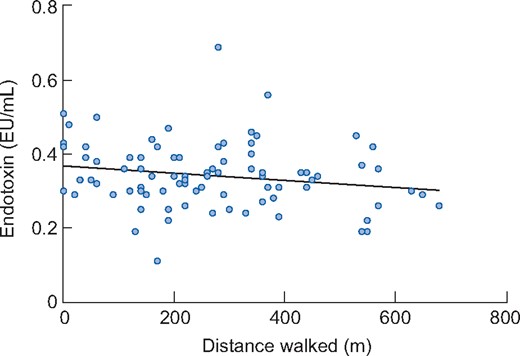
Association between endotoxin and the distance walked in the ISWT in participants (n = 85) at baseline. The association was not significant in the unadjusted (β = −0.188, P = 0.086) or adjusted (β = −0.152, P = 0.232) regression models.
Multiple linear regression showing the association between steps per day, distance walked in the ISWT, STS60 score and circulating cytokines at baseline.
| Cytokines | Unadjusted | Adjusted (Model 1) | ||
|---|---|---|---|---|
| Standardized coefficients β (95% CI) | P-value | Standardized coefficients β (95% CI) | P-value | |
| Steps per day (n = 81) | ||||
| Endotoxin | −0.235 (<0.001–<0.001) | 0.035 | −0.178 (<0.001–<0.001) | 0.143 |
| IL-6 | −0.318 (<0.001–<0.001) | 0.004 | −0.358 (<0.001–<0.001) | 0.004 |
| IL-10 | −0.153 (<0.001–<0.001) | 0.174 | −0.152 (<0.001–<0.001) | 0.224 |
| TNF-α | −0.118 (<0.001–<0.001) | 0.296 | −0.135 (<0.001–<0.001) | 0.283 |
| CRP | −0.374 (<0.001–<0.001) | 0.001 | −0.392 (<0.001–<0.001) | 0.001 |
| IL-6:IL-10 ratio | −0.230 (<0.001–<0.001) | 0.039 | −0.221 (<0.001–<0.001) | 0.072 |
| ISWT (distance walked in metres) (n = 85) | ||||
| Endotoxin | −0.188 (<0.001–<0.001) | 0.086 | −0.152 (<0.001–<0.001) | 0.232 |
| IL-6 | −0.185 (−0.001–<0.001) | 0.090 | −0.230 (−0.001–<0.001) | 0.076 |
| IL-10 | −0.144 (<0.001–<0.001) | 0.188 | −0.139 (<0.001–<0.001) | 0.283 |
| TNF-α | 0.032 (−0.002–0.003) | 0.770 | 0.086 (−0.002–0.004) | 0.510 |
| CRP | −0.233 (−0.001–<0.001) | 0.032 | −0.268 (−0.002–<0.001) | 0.038 |
| IL-6:IL-10 ratio | 0.391 (91.779–285.799) | <0.001 | 0.320 (67.863–241.262) | 0.001 |
| STS60 (cycles) (n = 85) | ||||
| Endotoxin | −0.240 (−0.003–<0.001) | 0.027 | −0.229 (−0.004–<0.001) | 0.071 |
| IL-6 | −0.207 (−0.019–<0.001) | 0.058 | −0.249 (−0.023–<0.001) | 0.055 |
| IL-10 | −0.142 (−0.007–0.001) | 0.196 | −0.151 (−0.008–0.002) | 0.244 |
| TNF-α | 0.050 (−0.027–0.042) | 0.650 | 0.080 (−0.028–0.054) | 0.540 |
| CRP | −0.351 (−0.026 to −0.007) | 0.01 | −0.383 (−0.029 to −0.006) | 0.002 |
| IL-6:IL-10 ratio | −0.296 (−0.015 to −0.003) | 0.006 | −0.305 (−0.016 to −0.002) | 0.017 |
Standardized coefficients β and P-value from the regression analysis. Unadjusted model is only either steps per day, ISWT, STS60 and relevant circulating cytokine (no covariants). Adjusted model controls for age, diabetes and ischaemic heart disease. Significance set at P < 0.05.
Associations between circulating endotoxin, cytokines and cardiovascular outcomes
There was a significant negative association between LVM/LV end-diastolic volume and both TNF-α (R = −0.259, P = 0.014) and CRP (R = −0.219, P = 0.039). Associations are presented in Supplementary data, Table S2.
DISCUSSION
For the first time we have shown that a 6-month programme of IDC does not significantly change endotoxin or the circulating cytokines IL-6, IL-10, TNF-α and CRP. In addition, higher levels of physical activity and fitness are associated with lower levels of endotoxin (for the unadjusted model only), IL-6, CRP and the IL-6:IL-10 ratio in the HD population. At baseline, participants with diabetes had significantly higher endotoxin levels. There was no association between circulating endotoxin, cytokines and cardiovascular outcomes.
Endotoxin can translocate across the intestinal barrier and enter into the circulation where it is a potent promoter of systemic inflammation [5]. Circulatory endotoxin is believed to contribute to higher levels of inflammation and subsequent increased risk of cardiovascular events as well as increased cardiovascular and all-cause mortality in the HD population [5–7]. In addition, individuals undergoing HD are subject to significant disruptions to the intestinal barrier catalysed by the uraemic environment and, importantly, the HD process itself [5, 21], ultimately leading to much higher levels of circulating endotoxin than in the general population.
It is known that HD in combination with ultrafiltration results in systemic haemodynamic perturbations with significant splanchnic ischaemia and hypoxia [22] and subsequent translocation of endotoxin; this effect is accentuated in individuals who have large ultrafiltration volumes during HD [23]. Exercise during dialysis might exacerbate these changes to the intestinal barrier. As blood is redistributed towards the exercising muscles and the skin for heat dissipation, there is a corresponding reduction in splanchnic blood flow, allowing endotoxin to translocate into the central circulation. Reassuringly, we have shown that a 6-month programme of IDC did not increase circulating levels of endotoxin or any other circulating inflammatory cytokine. It is possible that regular IDC may induce preconditioning on the intestine (also a vulnerable vascular bed), therefore protecting it against reductions in blood flow and reducing endotoxin translocation. One previous study investigated the effect of a single session of intradialytic exercise on circulating endotoxin [24]. The investigators reported very low levels of circulating endotoxin in their participants and, similar to our data, demonstrated no significant change as a consequence of intradialytic exercise [24]. We have also shown that higher levels of circulating endotoxin are associated with lower levels of physical activity and fitness in individuals undergoing HD (although this was not significant when adjusting for covariates). In the present study, participants with diabetes had significantly higher endotoxin levels, which is in agreement with a previous study showing that diabetic patients with kidney dysfunction have higher levels of serum endotoxin activity [25]. A previous study reported an increase in inflammatory marker levels in a sample of 583 incident HD patients with a central venous catheter compared with an arteriovenous fistula [26]. However, we found no difference in endotoxin levels between vascular access types in our data.
Consistent with the findings presented here, previous studies have shown no significant effects of IDC on circulating IL-6, IL-10, TNF-α, CRP or the IL-6:IL-10 ratio [10, 20, 27]. A 12-month study of protein supplementation in combination with IDC has also reported no effect on circulating IL-6 and CRP [28]. It is possible that a 6-month programme of IDC is insufficient in length to induce significant changes in circulating cytokines. Previous findings have suggested that regular activity may need to be performed for several years before the benefits of exercise are observed (independent of weight loss and reduced adiposity) on circulating markers of inflammation (such as IL-6 and CRP) [29]. It is worth noting that although participants reported a moderate exercise intensity (RPE 12–14), the initial average power output was low at 15 W. A previous trial [30] investigating the effects of exercise training in the HD population also showed a similar expenditure of 19 W, which despite such a low work rate, gave a subjective RPE of ‘very hard’. Exercise intensity is known to play a key role in the release of anti-inflammatory cytokines (such as IL-10) by way of skeletal muscle contraction and thus it makes sense that programmes of IDC may not show such clear benefit at such low absolute intensities [31].
Although there was no change in levels of circulating cytokines after IDC, there was evidence that physical activity levels (measured by steps per day) were inversely associated with concentrations of IL-6 and CRP. The levels of physical activity that we report are low, although comparable to other reported data [32, 33] in this cohort. Self-reported activity levels in the HD population have been shown to be inversely associated with levels of CRP [34] and (in agreement with our data) this has been supported by physical activity data collected using accelerometry [35]. A previous investigation [36] reported an association between mitochondrial dysfunction and worse 6-min walk test performance and further associations between mitochondrial dysfunction and both circulating TNF-α and IL-6. Therefore mitochondrial dysfunction may play a role in the association between lower levels of physical activity and higher circulating levels of cytokines that we observed in this study. Our data suggest that higher habitual levels of physical activity outside of HD may be more important (possibly through being able to work at higher exercise intensities) in modifying systemic inflammation than shorter (≤6 months) structured programmes of IDC. This supports data from the general population showing associations between levels of inflammation and physical activity or fitness [37, 38]. It is important to point out that the results from the main CYCLE-HD trial [14] showing a reduction in LV mass following a programme of IDC demonstrate the cardiovascular benefits of this form of exercise. Changing exercise habits in the HD population is challenging, therefore programmes of IDC (alongside other lifestyle advice) may play a role in initially encouraging behaviour change (increased physical activity levels) away from the HD unit, which may lower levels of inflammation in the long term. Data from the main CYCLE-HD trial [14] showing an overall increase in steps per day following IDC would seem to support this. Interventions that increase physical activity in the HD population are of critical importance, as sedentary behaviour is clearly associated with mortality [39, 40].
Limitations
It has been suggested that beta d-glucan may interfere with the LAL assay [41], resulting in false positives. However, our data are consistent with those that have previously been reported in the HD population. Furthermore, the elevated levels of beta d-glucan in individuals receiving HD are thought to be a result of cellulose dialysis membranes [42]. The participants in the present study were dialysed using polysulfone high-flux dialysers. These data represent a secondary analysis of the CYCLE-HD trial [15], therefore an a priori sample calculation was not performed. Our observed Cohen’s D effects size for 6-month between-group endotoxin data was 0.39, a previous randomized controlled trial (reporting endotoxin as an outcome) in individuals receiving dialysis [43] reported a larger ES of 0.53 for 6-month post-intervention (probiotic supplementation) data (median and interquartile range converted) [44, 45].
CONCLUSION
In summary, this is the first study to demonstrate that a programme of IDC does not increase circulating levels of endotoxin. We did not observe any significant changes in circulating cytokines. The findings show that levels of endotoxin and circulating cytokines were associated with physical activity. This highlights the benefits of being more active outside of treatment for individuals receiving HD.
SUPPLEMENTARY DATA
Supplementary data are available at ndt online.
ACKNOWLEDGEMENTS
An abstract that included some of the data in this article was presented (P1454) at the 57th ERA-EDTA virtual congress. This work falls under the portfolio of research conducted within the NIHR Leicester Biomedical Research Centre.
FUNDING
This work was supported by the National Institute of Health Research (NIHR) in the UK (grant reference CS-2013-13-014 to J.O.B.). The views expressed are those of the authors and not necessarily those of the NHS, the NIHR or the Department of Health and Social Care. After the award of funding, the funder (NIHR) did not have any input into trial design, data collection, data analysis, data interpretation, writing the report or deciding to submit for publication. This research has no relationship with industry. Part of this work was funded by the Leicester Kidney Care Appeal, Leicester Hospitals Charity, Leicester, UK.
AUTHORS’ CONTRIBUTIONS
J.O.B. conceptualized the study and designed and developed the methodology. D.S.M., M.P.M.G.-B., P.J.H., D.R.C., H.M.L.Y. and M.D. conducted the research and investigation process and were responsible for the project administration. J.O.B., A.C.S., N.C.B. and D.J.S. supervised the study. D.S.M., K.-B.L., T.N., C.C.S. and J.O.B. were responsible for the formal analysis of the project. D.S.M. wrote the original draft of the manuscript. All authors reviewed and edited the final manuscript. Each author contributed important intellectual content during manuscript drafting or revision and accepted overall accountability for the work.
DATA AVAILABILITY STATEMENT
Deidentified individual participant data collected for the study, and a data dictionary defining each field in the set, will be made available to others on specific request to the chief investigator and corresponding author provided all regulatory and data sharing approvals are obtained after.
CONFLICT OF INTEREST STATEMENT
No conflicts of interest, financial or otherwise are declared by the authors. The results presented in this article have not been published previously in whole or part, except in abstract form.


Comments