


ABSTRACT
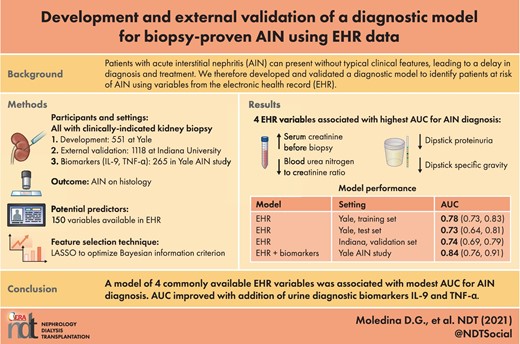
Patients with acute interstitial nephritis (AIN) can present without typical clinical features, leading to a delay in diagnosis and treatment. We therefore developed and validated a diagnostic model to identify patients at risk of AIN using variables from the electronic health record.
In patients who underwent a kidney biopsy at Yale University between 2013 and 2018, we tested the association of >150 variables with AIN, including demographics, comorbidities, vital signs and laboratory tests (training set 70%). We used least absolute shrinkage and selection operator methodology to select prebiopsy features associated with AIN. We performed area under the receiver operating characteristics curve (AUC) analysis with internal (held-out test set 30%) and external validation (Biopsy Biobank Cohort of Indiana). We tested the change in model performance after the addition of urine biomarkers in the Yale AIN study.
We included 393 patients (AIN 22%) in the training set, 158 patients (AIN 27%) in the test set, 1118 patients (AIN 11%) in the validation set and 265 patients (AIN 11%) in the Yale AIN study. Variables in the selected model included serum creatinine {adjusted odds ratio [aOR] 2.31 [95% confidence interval (CI) 1.42–3.76]}, blood urea nitrogen:creatinine ratio [aOR 0.40 (95% CI 0.20–0.78)] and urine dipstick specific gravity [aOR 0.95 (95% CI 0.91–0.99)] and protein [aOR 0.39 (95% CI 0.23–0.68)]. This model showed an AUC of 0.73 (95% CI 0.64–0.81) in the test set, which was similar to the AUC in the external validation cohort [0.74 (95% CI 0.69–0.79)]. The AUC improved to 0.84 (95% CI 0.76–0.91) upon the addition of urine interleukin-9 and tumor necrosis factor-α.
We developed and validated a statistical model that showed a modest AUC for AIN diagnosis, which improved upon the addition of urine biomarkers. Future studies could evaluate this model and biomarkers to identify unrecognized cases of AIN.
What is already known about this subject?
Patients with acute interstitial nephritis (AIN) can present without typical clinical features, leading to a delay in diagnosis and treatment.
There is no diagnostic tool available to clinicians that can help assess the risk of AIN before a kidney biopsy.
What this study adds?
Using data from patients who underwent a kidney biopsy at two US healthcare systems, the authors developed and externally validated a diagnostic model to identify patients at risk of AIN.
This model consists of four readily available variables from the electronic health record and showed consistent performance in an external validation cohort.
The model could be further improved by the addition of diagnostic urine biomarkers of AIN.
What impact this may have on practice or policy?
These findings could help identify unrecognized cases of AIN in the at-risk population before the occurrence of permanent kidney damage.
INTRODUCTION
Establishing a diagnosis of acute interstitial nephritis (AIN) is challenging for clinicians. Initial reports of AIN were in patients using beta-lactam antibiotics such as methicillin; patients with AIN caused by these drugs presented with classic allergic features such as rash, fever and an increase in eosinophils, as well as rapid onset of acute kidney injury (AKI). However, the potential etiologies of AIN have expanded to include drugs such as proton pump inhibitors (PPIs) [1–3], non-steroidal anti-inflammatory drugs (NSAIDs) [4] and immune checkpoint inhibitors [5–7]. It is now increasingly recognized that a majority of patients with AIN present with no symptoms or signs [8] and often have long latent periods between drug initiation and the occurrence of AKI [9]. Moreover, the loss of kidney function is slowly progressive in AIN, such that only half of the patients meet AKI criteria, leading to delayed or missed diagnosis [10].
To establish the diagnosis of AIN, a clinician must have sufficient clinical suspicion to prescribe a kidney biopsy for histological diagnosis. While AIN is reported in 10–15% of kidney biopsies performed for evaluation of AKI, it is expected that this is an underrepresentation of the overall cases of AIN due to the absence of reliable clinical features or non-invasive diagnostic tests [11, 12]. Urine eosinophil testing [13, 14], urinalysis and urine microscopy have been shown to lack sensitivity and specificity [15]. In contrast, urine cytokines tumor necrosis factor (TNF)-α and interleukin (IL)-9 were shown to be associated with AIN. However, they have not been externally validated and are not available for clinical use [16]. It is therefore not surprising that prebiopsy clinical suspicion of AIN is a poor predictor of AIN on biopsy [8, 16] and that some cases of AIN are diagnosed late or may remain undiagnosed.
A delay in diagnosis is associated with permanent kidney damage in the form of interstitial fibrosis/tubular atrophy and leads to chronic kidney disease (CKD) [9, 17]. Well-controlled analyses from large datasets have shown that those taking medications associated with AIN are at an increased risk of CKD, which may be due to undiagnosed AIN [18–23]. The goal of this study was to develop and validate a diagnostic model for AIN that identifies patients at increased risk of AIN using easily available features. We hypothesized that a model of easily available clinical variables would have a modest area under the receiver operating characteristics curve (AUC) for AIN diagnosis. Such a model could help clinicians to refine their prebiopsy odds of AIN and thus pursue a biopsy selectively in those with intermediate odds or to consider treatment when the odds are high and a biopsy is not feasible.
MATERIALS AND METHODS
Participants and settings
This is a retrospective study that included participants from three cohorts. We trained and tested the model in a discovery cohort at Yale University, externally validated it in the Biopsy Biobank of Indiana and included biomarker information from the Yale AIN study (Figure 1 and Supplemental data, Figure S1). In the discovery cohort, we included consecutive adult patients with kidney biopsy reports available in the Yale University's electronic health record (EHR) from 2013 to 2018. We excluded those who underwent a biopsy of a kidney allograft or who underwent a biopsy for evaluation of kidney cancer. We additionally excluded those who underwent a biopsy outside our healthcare network and those who did not have two serum creatinine measurements in our system. We also excluded participants with positive test results for antineutrophil cytoplasmic autoantibody (ANCA) or double-strand DNA before biopsy, since lupus nephritis and ANCA-associated vasculitis can present with interstitial nephritis but are generally not considered causes of AIN and are usually easy to distinguish from AIN. In those who underwent more than one biopsy, we only included the first biopsy encounter. This part of the study was approved by the Yale Human Investigation Committee (HIC; number 2000023888) and operated under a waiver of informed consent.
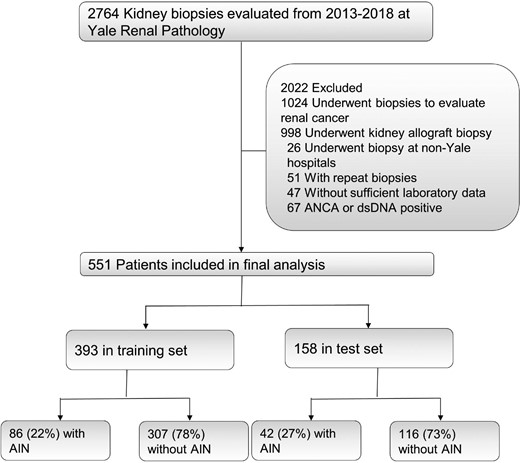
Standards for Reporting of Diagnostic Accuracy flow diagram.
Exposure and outcomes
Our primary outcome was the diagnosis of AIN, which was defined as a biopsy report of AIN in the absence of accompanying primary glomerulonephritis (Supplemental data, Figure S2). The histological diagnosis was made by clinical pathologists who did not have access to our clinical model. Our exposures of interest were structured EHR data obtained within 1 year before the biopsy for demographics, comorbidities [using the International Classification of Diseases, Ninth (ICD-9) and Tenth (ICD-10) Revision codes) and blood and urine laboratory test results. For laboratory test results, we included the information closest to the biopsy. We also included medication use and vital signs for up to 90 days before the biopsy. For outpatient medications, we assumed a medication was administered if it was prescribed in our EHR system and for inpatient medications we included medications only when they were administered. We defined fever as any temperature >100.4° F up to 90 days before the biopsy. We determined the estimated glomerular filtration rate (eGFR) using the Chronic Kidney Disease Epidemiology Collaboration equation [24]. All data were obtained from querying Clarity, the relational database underlying the Epic EHR (Verona, WI, USA). Biopsy reports were available as free text that were converted to structured diagnosis reports via string searches. We validated these diagnoses through chart review in 10% of the sample and noted a 100% match. All analyses were conducted using temporal 70:30 training and test set splits [25].
The Biopsy Biobank Cohort of Indiana (BBCI) and Yale AIN study
We performed external validation of our model in participants from the BBCI. The details of this study have been previously published [16, 26–28]. Briefly, the BBCI included participants with kidney biopsy reports at Indiana University from 2002 to 2019. Similar exclusions were applied to the BBCI as in the Yale cohort. This study was approved by the institutional review board at Indiana University (approval number 1906572234).
In participants from the Yale AIN study, we compared the model's performance with that of clinicians’ caring for the patients before a biopsy and assessed the improvement in model performance after the addition of urine biomarkers. This study has been described previously [17, 29]. The Yale AIN study enrolled all participants who underwent a kidney biopsy at two Yale New Haven Hospital–affiliated centers between 2015 and 2018. Three renal pathologists adjudicated the presence or absence of AIN through review of histology. Of these, AIN was thought to be due to a medication in 47%, other causes in 41% and undetermined in 12%. We obtained clinicians’ prebiopsy impression through a chart review of nephrology progress or consult notes documented before the biopsy date. We also measured cytokines IL-9 and TNF-α using a Meso Scale Diagnostics (Rockville, MD, USA) discovery device and reviewed the EHR for clinicians’ prebiopsy suspicion of AIN. This part of the study was approved by the HIC (number 11110009286) and all participants provided written informed consent. The Yale AIN study recruited patients from one of the centers included in the discovery cohort and we noted an overlap between the two cohorts such that 152 (23%) participants were in both cohorts, 400 (60%) in the discovery cohort alone and 113 (17%) in the Yale AIN study alone. Of the 265 participants in the Yale AIN study, 97 (37%) participants were in the training set of the discovery cohort, and we conducted a sensitivity analysis to evaluate model performance after excluding these participants.
Statistical analysis
We compared univariable associations between AIN and various continuous or categorical predictors using the Wilcoxon rank-sum test or chi-squared test, respectively. We also presented analysis of the AUC for each predictor with AIN diagnosis. We calculated Q-values using the Simes method for false discovery rate [30]. After excluding highly collinear features (R2 > 0.90, n = 20) and those with low prevalence (<2%, n = 12), we analyzed 153 potential features for selection (Supplemental data, Table S1). We natural log transformed continuous variables prior to analysis. For feature selection, we used the least absolute shrinkage and selection operator (LASSO) algorithm. The LASSO technique regularizes model parameters by shrinking the regression coefficients, reducing coefficients for some variables to zero and eliminating them from the model [31]. Thus the LASSO algorithm can provide a parsimonious list of features. To construct sequential models we adjusted the lambda parameter and selected the model with the lowest Bayesian information criterion (BIC). All of these analyses were conducted in the training set (70%). We used the -lasso2- command in Stata (StataCorp, College Station, TX, USA) to implement this algorithm. For validation, we performed AUC analysis using model weights derived from the training set in the held-out test set (30%) and BBCI. We also applied model weights to participants in the Yale AIN study and compared the AUC of the EHR model with that of a model additionally containing biomarkers and clinicians’ prebiopsy suspicion of AIN using the -roccomp- command [32]. We created precision–recall curves using -prtab- and calibration plots using -hl- commands in Stata. We report test characteristics [sensitivity, specificity and positive and negative likelihood ratios (LRs) at three cut-offs]. The four key variables included in the model were missing in <10% of participants (Supplemental data,Table S2). For deriving and applying model weights, we replaced missing values for continuous values with medians and assumed the absence of ≤1+ proteinuria for those with missing dipstick protein. We used the LR test to compare the model with clinicians’ prebiopsy impression with that containing both prebiopsy information and the EHR model, as well as to compare the EHR model with that containing diagnostic biomarkers. In a sensitivity analysis, we used the diagnosis of AIN when it was listed as first on the biopsy report and excluded patients in whom AIN was listed as second or later. We conducted all analyses using Stata (version 14 or higher) and SAS (version 9.4; SAS Institute, Cary, NC, USA).
RESULTS
Training and test set participant characteristics
Of the 2764 kidney biopsy reports evaluated at Yale between 2013 and 2018, we included 551 kidney biopsy reports in the final analysis (Figure 1). We divided these into training (first 70%, n = 393) and test (subsequent 30%, n = 158) sets, which had 22% and 27% AIN on histology, respectively. We noted that the training and test sets had comparable baseline characteristics (Table 1) except that the BBCI participants tended to be younger, less likely to have diabetes and had a higher eGFR.
Baseline characteristics of study participants
| Discovery set (Yale) | ||||
|---|---|---|---|---|
| Validation set | Biomarker set | |||
| Characteristics | Training | Test | (BBCI) | (Yale AIN study) |
| Patients | 393 | 158 | 1118 | 265 |
| Patients with AIN, n (%) | 86 (22) | 42 (27) | 119 (11) | 30 (11) |
| Demographics and medical history | ||||
| Age (years), median (IQR) | 57 (44–66) | 59 (45–68) | 43 (15–60) | 58 (45–67) |
| Female, n (%) | 207 (53) | 85 (54) | 532 (48) | 115 (43) |
| Black race, n (%) | 95 (24) | 41 (26) | 253 (22) | 63 (24) |
| Body mass index (kg/m2) | N/A | N/A | 29 (25–37) | 30 (25–35) |
| Diabetes, n (%) | 150 (38) | 67 (42) | 140 (13) | 95 (36) |
| Hypertension, n (%) | 279 (71) | 129 (82) | 472 (42) | 191 (72) |
| Cirrhosis, n (%) | 26 (7) | 18 (11) | N/A | 23 (9) |
| CKD, n (%) | 104 (26) | 73 (46) | 296 (26) | 166 (67) |
| AKI, n (%) | 145 (37) | 57 (36) | N/A | 101 (38) |
| Laboratory values at biopsy, median (IQR) | ||||
| Serum creatinine (mg/dL) | 2.1 (1.4–3.6) | 2.4 (1.6–3.7) | 1.8 (0.8–3.3) | 2.5 (1.6–4.2) |
| eGFR | 31 (15–52) | 26 (16–41) | 75 (59–117) | 24 (14–40) |
| BUN (mg/dL) | 32 (23–50) | 35 (26–55) | 26 (15–44) | 37 (26–59) |
| BUN:creatinine ratio | 15 (11–19) | 15 (12–21) | 15 (11–22) | 15 (11–20) |
| Hemoglobin level (g/dL) | 11.3 (9.7–12.9) | 10.9 (9.1–12.5) | N/A | 10.6 (8.8–12.7) |
| Platelets (*1000/mm3) | 232 (180–290) | 231 (166–285) | 257 (192–334) | 216 (166–273) |
| Blood eosinophil count (/mm3) | 162 (89–284) | 170 (90–266) | 150 (69–284) | 220 (118–378) |
| Bicarbonate | 22 (20–25) | 22 (20–25) | N/A | 22 (19–25) |
| Anion gap | 14 (12–16) | 15 (13–17) | N/A | 15 (12–18) |
| Medication use, n (%) | ||||
| PPI use | 210 (53) | 62 (39) | N/A | 98 (37) |
| NSAID use | 90 (23) | 25 (16) | N/A | 47 (18) |
| Antibiotic use | 283 (72) | 88 (56) | N/A | 117 (45) |
| Immunotherapy | 6 (2) | 0 (0) | N/A | 3 (1) |
| Number of allergies, median (IQR) | 0 (0–2) | 1 (0–1) | N/A | N/A |
| Urine dipstick features, n (%) | ||||
| Leukocyte esterase (≥2+) | 94 (24) | 35 (22) | 77 (7) | 47 (19) |
| Blood (≥2+) | 249 (63) | 103 (65) | N/A | 154 (62) |
| Protein (≥2+) | 112 (28) | 53 (34) | 396 (35) | 185 (74) |
| Specific gravity, median (IQR) | 1.015 (1.012–1.020) | 1.015 (1.010–1.020) | 1.013 (1.010–1.018) | 1.020 (1.015–1.025) |
N/A, not available.
Univariable association of prebiopsy factors with AIN
The univariable association of selected prebiopsy factors with AIN in the training set is shown in Table 2 and complete data for >150 features are presented in the Supplemental data, Table S1. We noted higher odds of AIN with higher serum creatinine before the biopsy and the absence of proteinuria. We noted higher odds of AIN with lower blood urea nitrogen (BUN):creatinine ratio, urine specific gravity, serum bicarbonate, hematocrit and rate of decline of eGFR in the 365 days before the biopsy. Immunotherapy and fever before biopsy were also associated with AIN. All of these factors, except eGFR slope and hematocrit, were statistically associated with AIN after correcting for multiple comparisons.
Univariable association of selected features with AIN in the training set
| Factors associated with AIN | AUC | P-value | Q-value (FDR) | ORa | OR direction |
|---|---|---|---|---|---|
| Top 10 features by the AUC | |||||
| Serum creatinine before biopsy (mg/dL) | 0.73 | 1.21E–13 | 2.09E–11 | 3.51 | ↑ |
| BUN-to-creatinine ratio (unit) | 0.70 | 6.76E–12 | 3.87E–10 | 0.19 | ↓ |
| Urine specific gravity (0.001 unit) | 0.67 | 7.79E–07 | 2.68E–05 | 0.91 | ↓ |
| Serum bicarbonate (mEq/L) | 0.62 | 4.20E–04 | 7.22E–03 | 0.08 | ↓ |
| Urine dipstick proteinuria (≥2+ versus ≤1+) | 0.62 | 1.50E–05 | 3.69E–04 | 0.33 | ↓ |
| Serum anion gap (unit) | 0.60 | 2.74E–05 | 5.90E–04 | 4.18 | ↑ |
| BUN (mg/dL) | 0.60 | 9.39E–04 | 0.01 | 1.77 | ↑ |
| eGFR countb (30 days before biopsy) | 0.59 | 6.30E–03 | 0.07 | 1.34 | ↑ |
| eGFR slope (365 days before biopsy) | 0.58 | 9.87E–03 | 0.08 | 1.24 | ↓ |
| Serum magnesium | 0.58 | 0.03 | 0.18 | 1.99 | ↓ |
| Other selected features | |||||
| Blood eosinophil count (× 1000/mm3) | 0.57 | 0.10 | 0.34 | 4.33 | ↑ |
| Immunotherapy (yes versus no) | 0.53 | 4.62E–04 | 0.01 | 18.89 | ↑ |
| Number of allergies (count) | 0.53 | 0.11 | 0.37 | 0.76 | ↓ |
| Sterile pyuria (yes versus no) | 0.53 | 0.07 | 0.28 | 2.76 | ↑ |
| Fever (≥100.4° F versus <100.4° F) | 0.53 | 0.002 | 0.02 | 1.59 | ↑ |
| Beta-lactam use (yes versus no) | 0.52 | 0.30 | 0.63 | 1.25 | ↑ |
| PPI use (yes versus no) | 0.52 | 0.97 | 0.99 | 1.20 | ↑ |
| Fluoroquinolone (yes versus no) | 0.52 | 0.54 | 0.79 | 1.17 | ↑ |
| NSAID use (yes versus no) | 0.51 | 0.29 | 0.62 | 1.11 | ↑ |
Data from the training set (n = 393; 86 with AIN). P-value comparing AIN versus no AIN using rank-sum test. Q-value calculated using the Simes method including data from factors evaluated (complete data presented in Supplemental material). FDR, false discovery rate; OR, odds ratio.
Per natural log change for continuous variables.
Number of eGFR measurements within 30 days before the biopsy.
Feature selection and EHR-based model
We created sequential models using LASSO and selected the model with the lowest value of BIC (Table 3). We noted that the model with four variables, including prebiopsy serum creatinine, BUN:creatinine ratio and urine dipstick specific gravity and protein, had the lowest BIC value (–713.1), with worsening of BIC after adding another variable (BIC –721.2). This four-variable model showed higher odds of AIN with higher serum creatinine before the biopsy, lower BUN:creatinine ratio, lower specific gravity and an absence of proteinuria (Table 4 and Supplemental data, Figure S3). The AUC of this model in the training set was 0.78 (95% CI 0.73–0.83) (Figure 2). We applied this model to the test set and noted an AUC of 0.73 (95% CI 0.64–0.81). Predicted probability from the model was higher in those with AIN than in those without AIN (Supplemental data, Figure S4). The precision–recall curves and calibration plots from the test set are presented in Supplemental data, Figures S5 and S6, respectively, and show good calibration of our model in the test set.
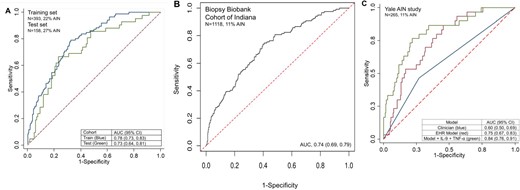
AUC of the four-variable EHR model in the discovery and validation cohorts. (A) AUC of the AIN model in the training (70%, blue) and test (30%, red) sets. (B) AUC of the AIN model in the validation set (BBCI). (C) AUC in the Yale AIN study of AIN EHR model (red), the EHR model, IL-9 and TNF-α (green) and clinicians’ prebiopsy suspicion of AIN (blue).
Sequential models using LASSO
| AUC | ||||||
|---|---|---|---|---|---|---|
| Model | Training | Test | Variable 1 | Variable 2 | Variable 3 | Variable 4 |
| 1 | 0.73 (95% CI 0.67–0.78) | 0.70 (95% CI 0.60–0.79) | Last creatinine | |||
| 2 | 0.76 (95% CI 0.70–0.81) | 0.73 (95% CI 0.64–0.82) | Last creatinine | BUN:creatinine ratio | ||
| 3 | 0.78 (95% CI 0.73–0.83) | 0.74 (95% CI 0.65–0.83) | Last creatinine | BUN:creatinine ratio | Urine protein | |
| 4 | 0.78 (95% CI 0.73–0.83) | 0.73 (95% CI 0.64–0.81) | Last creatinine | BUN:creatinine ratio | Urine protein | Urine specific gravity |
Details of the four-variable model in the training set
| Variables associated with AIN | OR (95% CI) |
|---|---|
| Serum creatinine before biopsy (per natural log increase) | 2.31 (1.42–3.76) |
| BUN:creatinine ratio (per natural log increase) | 0.40 (0.20–0.78) |
| Absence of proteinuria (0 and 1+ versus 2+ or higher) | 2.55 (1.45–4.43) |
| Urine specific gravity (per 0.001 unit increase) | 0.95 (0.91–0.99) |
Odds ratio per mg/dL increase in creatinine, unit decrease in BUN:creatinine ratio, 0.001 decrease in specific gravity and absence of proteinuria. Urine specific gravity and proteinuria evaluated on dipstick. Model intercept = 0.770 398. Model weights provided in the Supplement.
Validation results
We then applied the model weights derived from the training set to the participants in the BBCI, which included 119 AIN cases (11%) among 1118 total participants (Supplemental data, Figure S1). We noted that the four-variable model had a similar AUC in the BBCI as in our test set [0.74 (95% CI 0.69–0.79), Figure 2]. Precision–recall curves and calibration plots from validation cohorts are presented in Supplemental data, Figures S5 and S6, respectively, and show good calibration of our model in the BBCI. We evaluated model performance characteristics at three cut-offs: 0.05, 0.10 and 0.25 (Table 5). We noted that at a model cut-off point of 0.10 (10% probability of AIN), the sensitivity was 71% and the specificity was 63%. We noted that the sensitivity improved to 94% at a cut-off of 0.05 (with a corresponding decrease in specificity to 32%) and the specificity improved to 94% at a cut-off of 0.25 (with a corresponding decrease in sensitivity to 27%). At a cut-off of 0.10 (close to the prevalence in this cohort of 11%), we noted that the LR of positive and negative tests was 1.93 and 0.45, respectively, and the positive and negative predictive values (PPVs and NPVs) were 0.19 and 0.95, respectively.
Test characteristics of the EHR model in the test and validation sets
| Cohort | Cut-off | Sensitivity | Specificity | LR+ | LR– | PPV | NPV |
|---|---|---|---|---|---|---|---|
| BBCI | 0.05 | 0.94 | 0.32 | 1.38 | 0.18 | 0.14 | 0.98 |
| 0.1 | 0.71 | 0.63 | 1.93 | 0.45 | 0.19 | 0.95 | |
| 0.25 | 0.27 | 0.94 | 4.63 | 0.78 | 0.36 | 0.92 | |
| Test set | 0.05 | 0.98 | 0.09 | 1.08 | 0.25 | 0.28 | 0.92 |
| 0.10 | 0.93 | 0.23 | 1.21 | 0.31 | 0.30 | 0.90 | |
| 0.25 | 0.67 | 0.73 | 2.49 | 0.45 | 0.47 | 0.86 |
The prevalence of AIN: BBCI = 11%, test set = 27%.
Urine biomarkers IL-9 and TNF-α
To ascertain the additional value of recently described diagnostic urine biomarkers for AIN, we applied the model to the participants in the Yale AIN study. This cohort included 30 AIN cases adjudicated by three pathologists from among 265 participants. In the Yale AIN study, we noted a model AUC of 0.75 (95% CI 0.67–0.83), which improved to 0.84 (95% CI 0.76–0.91) (P < 0.001, LR test) by the addition of two urine biomarkers of AIN, IL-9 and TNF-α. We also noted that the AUC in our model was higher than the AUC of the clinician's prebiopsy likelihood of AIN [0.60 (95% CI 0.50–0.69), P < 0.001; Figure 2C]. In a sensitivity analysis excluding 97 participants who were also included in the training set of the discovery cohort, we noted an AUC of 0.53 (95% CI 0.41–0.66) for clinicians, 0.75 (95% CI 0.62–0.87) for the EHR-based model and 0.80 (95% CI 0.67–0.93) for the EHR model and biomarkers (Supplemental data, Figure S7).
Sensitivity analysis: AIN as the first diagnosis
Typically, pathology reports provide the diagnoses in order of predicted clinical impact, with the most important diagnosis listed first. Since small areas of interstitial infiltrate can be seen in many forms of chronic renal disease (and are sometimes reported second or later on a biopsy report), we conducted a sensitivity analysis by defining AIN on histology only if it was listed as the first diagnosis of a biopsy report. We noted that 59 (12%) of 482 participants had AIN listed as the first diagnosis after excluding 69 cases where AIN was listed second or later. Applying model weights of the AIN model, we noted a higher AUC of 0.80 (95% CI 0.75–0.85) in this group with good calibration (Supplemental data, Figure S8).
DISCUSSION
In this study we created a parsimonious model that provides a modest AUC for the diagnosis of AIN using four laboratory variables in the EHR. We noted only a minimal decrease in model performance in the external validation cohort. The model was further improved by the addition of urine biomarkers IL-9 and TNF-α. Our model can guide clinicians in making evidence-based decisions while caring for patients suspected to have AIN and guide research into identifying patients with subclinical AIN.
Due to a lack of reliable noninvasive tests to accurately identify AIN, clinicians need to maintain a high index of suspicion and perform a kidney biopsy in appropriate patients to establish a diagnosis. However, kidney biopsy carries risks, particularly in patients with AKI, and thus is frequently withheld in the absence of a strong clinical suspicion [28, 33–35]. This tendency to obtain a kidney biopsy only when uncertain of the diagnosis is reflected by the poor predictive ability of the clinicians’ prebiopsy suspicion for a postbiopsy AIN diagnosis [16]. While prior studies have described the prevalence of individual features in cases with AIN, including white blood cell casts [36], pyuria [15], proteinuria [15], urine eosinophils [13] and imaging studies [37], none of these studies combined all clinically available features to create a diagnostic model for AIN. Our goal in this study was to help clinicians further improve their prebiopsy assessment of AIN by creating a parsimonious diagnostic model for this disease.
We conducted a comprehensive evaluation of >150 features available in the EHR for their association with AIN and created a parsimonious model for AIN diagnosis consisting of four variables using the LASSO algorithm. Our model showed a modest AUC for AIN diagnosis in the held-out test set. In a large external validation cohort, we noted a minimal decrease in model AUC, suggesting good external validity of the model when applied to patients at other centers who have been selected for a biopsy by their clinicians. Finally, we showed that the addition of urine cytokines such as IL-9 and TNF-α to this model further improved the AUC for AIN diagnosis. This model has a high NPV in both the test and validation cohorts and thus could help clinicians rule out AIN. Our model is available for immediate clinical use to help estimate the probability of AIN in patients being considered for a kidney biopsy and, in the future, could incorporate information from diagnostic biomarkers to further refine the AIN risk estimate.
The systematic evaluation of EHR variables associated with AIN also provides interesting clinical insights. AIN is suspected clinically in those with a loss of kidney function, without evidence of acute tubular injury or prerenal azotemia and without significant glomerular disease. Variables selected in our unsupervised model captured these aspects of the clinical presentation of patients with AIN. We noted a higher risk of AIN with high serum creatinine, indicating a loss of kidney function, but with low urine specific gravity and a BUN:serum creatinine ratio indicating the absence of an absolute or relative hypovolemic state, which is the most common cause of loss of kidney function. We noted a higher risk of AIN with no or mild proteinuria, indicating the absence of glomerular disease. We also noted that patients with AIN tended to have lower bicarbonate levels, which may reflect AIN-associated tubular dysfunction and a slower decline in kidney function, which has been noted before [10]. Finally, medication use (except immunotherapy), allergies, blood eosinophil count and sterile pyuria were not associated with AIN.
Our findings can be applied to clinical practice and can support future research. In clinical settings, our model, particularly when combined with urine biomarkers IL-9 and TNF-α, can add incremental value to clinician judgment and help improve their ability to identify patients at risk for AIN. Based on these results, patients with a low probability of AIN can be evaluated for alternate diagnoses, while those with an intermediate or high probability can be further evaluated with a kidney biopsy. Patients who are at high risk from a biopsy could be treated without a biopsy. We developed our model in patients who were selected for a kidney biopsy, since histological examination of kidney biopsy tissue is the gold standard for AIN diagnosis. Thus the external validity of our findings is limited to patients in whom a kidney biopsy is indicated. These clinical scenarios could include patients with progressive CKD despite good blood pressure and diabetes control, patients with progressive CKD who are taking medications that are known to cause AIN or patients with AKI or AKD whose etiology, duration or general clinical presentation are atypical [38].
This model can also help identify patients with ‘subclinical’ AIN, i.e. those who may be taking medications that put them at risk of AIN but are not being monitored for this disease. Many patients with AIN present after fibrosis has already affected a significant portion of their kidney tissue. This has raised the possibility of ‘subclinical’ AIN, where interstitial inflammation is ongoing but a loss of kidney function has not yet occurred. Patients who have good kidney function reserve may be able to compensate for some degree of kidney inflammation and may be most at risk for subclinical AIN. This AIN model can identify patients at risk of ‘subclinical’ AIN, i.e. those patients with a high probability of AIN who have not yet been diagnosed with the disease, alerting their primary care providers who can refer them to a clinical or research nephrologist. A subsequent evaluation could include an evaluation of diagnostic biomarkers or, in a subset of patients, a kidney biopsy to uncover ‘subclinical’ AIN.
Our study has several important strengths. First, to our knowledge, this is the first study to systematically evaluate >150 variables available in the EHR for their association with AIN. Second, this is a study with external validation that showed good discrimination and a minimal decrease in performance. However, given the lower prevalence of AIN in the validation cohort, we noted a lower PPV and a higher NPV in that cohort. Therefore our model would likely need to be calibrated to each individual center's AIN prevalence. Third, we compared our model with clinicians’ impressions and the additive value of urine biomarkers. Finally, our model contains clinically available variables and can be used by practicing clinicians immediately. (A link to an online calculator using results from this article is available for use at: https://ainriskprediction.shinyapps.io/ain_calc/.) Our study also has some important limitations. First, this model was derived and validated in a cohort of patients who were selected for a biopsy by their treating clinicians, therefore the accuracy of this model in patients who did not undergo a biopsy is unknown and could be different from that seen in our study. In this study we did not collect data on participants who were treated for presumed AIN without a kidney biopsy but hope to do so in a future study. Second, we did not include unstructured data such as notes and imaging reports, as well as various combinations of risk factors such as medications, which could further improve the accuracy of this model. Third, only one of the three cohorts had an AIN diagnosis adjudicated by multiple pathologists. However, in the other two cohorts, the diagnosis was established by histological exam by a trained renal pathologist, which is the current standard of care. Biomarker information and clinicians’ prebiopsy diagnosis were also available in only one of three cohorts and could not be validated. Fourth, the low performance of clinicians in accurately predicting AIN may be due to selection bias; clinicians more frequently order a biopsy when unsure of the diagnosis and therefore a higher percentage of equivocal cases are included in our study. However, we demonstrate that in this cohort of patients selected for a biopsy, our model may help clinicians refine their prebiopsy odds of AIN. Fifth, our use of EHR data has some limitations, including inaccuracy of ICD code–based comorbidity assessment and the lack of reliable data on over-the-counter medications and prescriptions filled. We also used static (rather than time-updated) variables for feature selection; using time-updated variables might provide more information for AIN diagnosis. Finally, it must be stressed that this EHR model alone will not help avoid kidney biopsy in all patients at risk of AIN. We expect that this model will be a starting point of evaluation; it will help refine prebiopsy odds of patients being considered for a biopsy and, when combined with diagnostic biomarkers, avoid biopsy in a subset of patients at highest or lowest risk of AIN.
In conclusion, we show that a model of four variables from the EHR can provide a modest prebiopsy estimate of AIN diagnosis, which can be further improved by the addition of urine biomarkers. These findings can guide clinicians in making biopsy decisions and guide future research into uncovering ‘subclinical’ AIN.
ACKNOWLEDGEMENTS
This study was supported by National Institute of Diabetes and Digestive and Kidney Diseases (NIDDK) awards K23DK117065 (to D.G.M.), R01DK128087 (to D.G.M.), R01DK12681 (to D.G.M., L.G.C. and C.R.P.), R01DK113191 (to F.P.W.), R01HL085757 (to C.R.P.), U01DK082185 (to C.R.P.), UH3DK114866 (to C.R.P., D.G.M. and F.P.W.) and K08DK107864 (to M.T.E.), and the Yale O'Brien Center (P30DK079310). The content is solely the responsibility of the authors and does not necessarily represent the official views of the National Institutes of Health. T.H.S. was supported by the Indiana University Grand Challenge.
AUTHORS’ CONTRIBUTIONS
D.G.M., M.T.E., M.S., F.P.W., R.L., T.S., M.A.P., L.G.C. and C.R.P. were responsible for designing the research studies. D.G.M. and W.O. conducted the experiments. D.G.M., W.O., G.M., M.K., M.K. F.C. and M.S. were responsible for the aquisition of data. D.G.M., F.P.W., C.R.P. and T.S. analyzed the data. All authors wrote the manuscript.
CONFLICT OF INTEREST STATEMENT
D.G.M. and C.R.P. are named co-inventors on the pending patent ‘Methods and Systems for Diagnosis of Acute Interstitial Nephritis’, which is subject to an option for a license agreement with Renalytix AI. C.R.P. serves as a member of the advisory board of and owns equity in Renalytix AI. F.P.W. is the founder of Efference, a medical communications company. These findings were presented at the American Society of Nephrology Virtual Meeting held in October 2020.


Comments