


Blood volume (BV) is tightly controlled by the kidneys and the interstitial space plays an important role in this control. Blood is in contact with the interstitial space not only for the exchange of metabolites and for the control of the cellular environment, but also because the interstitial space serves as a volume buffer in case of volume excess or volume depletion. It is the purpose of this buffer to maintain adequate circulatory and diastolic filling pressures, and thereby to maintain a functional circulation of the blood [1]. BV is approximately one-third of the extracellular volume (ECV) under physiological conditions [1]. In haemodialysis patients without renal function, ECV is expanded because fluid is accumulated in the interdialytic period. This volume excess has to be removed during dialysis by ultrafiltration of blood.
The questions therefore arise, (i) how is this volume-excess distributed between intra and extravascular compartments in dialysis patients and (ii) how is this distribution affected by ultrafiltration?
BV and ECV were measured in 79 stable chronic haemodialysis patients of a single centre with moderate volume overload (1.85 ± 1.22 L) and without cardiac dysfunction. Only patients with a well-functioning fistula were included. The study was approved by the Ethics Committee of the Charité Berlin (approval number EA1/116/16) and all patients provided written informed consent. Patient and treatment characteristics are summarized in Table 1.
Patient and treatment characteristics (n = 79)
| Age (years) | 69.0 ± 14.8 |
|---|---|
| Sex (f/m) | 32/47 |
| Dialysis vintage (months) | 98 (7–414) |
| Renal disease | (n) |
| Vascular nephropathy, n (%) | 22 (28) |
| Glomerulonephritis/vasculitis, n (%) | 21 (27) |
| Diabetic nephropathy, n (%) | 17 (21) |
| Polycystic kidney disease, n (%) | 9 (11) |
| Pyelonephritis/interstitial nephritis, n (%) | 8 (10) |
| Other, n (%) | 2 (3) |
| Residual renal function | |
| Anuric, n (%) | 67 (85) |
| ˂200 mL, n (%) | 12 (15) |
| Dialysis duration (min) | 296 ± 56 |
| Pre-dialysis systolic blood pressure (mmHg) | 135 ± 17 |
| Post-dialysis systolic blood pressure (mmHg) | 129 ± 19 |
| Ultrafiltration volume (L) | 2.48 ± 0.87 |
| Ultrafiltration rate (mL/h) | 490 ± 165 |
| Specific ultrafiltration rate (mL/kg/h) | 6.98 ± 3.02 |
| Dry weight (kg) | 74.8 ± 19.2 |
| Pre-dialysis body mass (kg) | 76.6 ± 19.6 |
| Post-dialysis body mass (kg) | 74.9 ± 19.2 |
| Volume overload (L) | 1.85 ± 1.22 |
| Pre-dialysis extracellular volume (L) | 17.91 ± 3.90 |
| Post-dialysis extracellular volume (L) | 16.22 ± 3.57 |
| Absolute blood volume beginning (L) | 5.76 ± 1.54 |
| Absolute blood volume end (L) | 5.20 ± 1.41 |
| Specific blood volume beginning (mL/kg) | 77.3 ± 9.6 |
| Specific blood volume end (mL/kg) | 69.7 ± 8.5 |
Immediately before treatment, ECV and volume overload were evaluated by bioimpedance spectroscopy using the body composition monitor [BCM, Fresenius Medical Care (FMC), Bad Homburg, Germany] [2]. ECV at the end of treatment was calculated by subtracting the intra-dialytic weight loss from pre-dialysis ECV.
The actual BV at the beginning of dialysis was determined by indicator dilution, using an online infusate bolus of 240 mL which was administered immediately after the beginning of the dialysis session and subsequent calculation using the data of the relative BV monitor integrated in the haemodiafiltration machine 5008 [Fresenius Medical Care (FMC), Bad Homburg, Germany]. BV at the end of the dialysis session was calculated from measured absolute BV at the beginning and the relative BV at the end of dialysis. Theory and method are described elsewhere in more detail [3–5].
The relationship of BV (5.76 ± 1.54 L) to ECV (17.91 ± 3.90 L) was 0.321 ± 0.039 at dialysis start and 0.319 ± 0.040 at the end (BV 5.20 ± 1.41 L, ECV 16.22 ± 3.57 L). The mean deviation between pre- and post-dialysis was −0.002 ± 0.018. Although females had lower BV and ECV, there were no significant differences in the BV to ECV ratio between the sexes (0.316 ± 0.023 females, 0.323 ± 0.042 males). There were strong correlations (P < .001) between BV and ECV both at the beginning (r = 0.88) and at the end (r = 0.88) of dialysis (Figure 1).
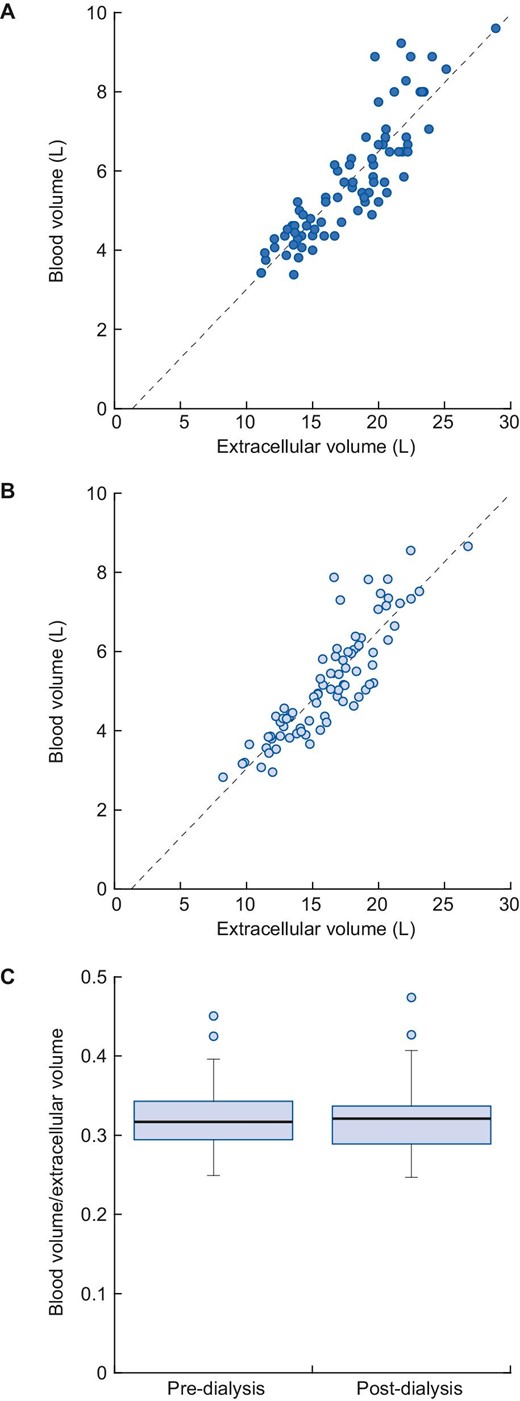
Relationship of blood volume to extracellular volume at the beginning (r = 0.88) (A) and at the end (B) of the haemodialysis session (r = 0.88). The blood volume to extracellular volume ratio remains constant during dialysis treatments (C).
These data show that (i) the BV to ECV ratio in haemodialysis patients is close to one-third assumed under physiologic conditions [1] and (ii) this ratio remains unchanged in spite of ultrafiltration.
To the best of our knowledge this is the first time that these relationships are reported in dialysis patients.
Most interdialytic fluid accumulation occurs in the interstitial space, whereas the vascular space is less affected [6]. The constant relationship between the two compartments is maintained under conditions of haemodialysis with volume removal by low specific ultrafiltration rates (6.98 ± 3.02 mL/kg/h). This confirms previous findings that the vascular refilling volume is only about 70% of UF volume [6–12] during dialysis itself with the refilling process continuing after the end of treatment.
Notice that a constant BV to ECV ratio does not imply a constant BV.
Despite the lack of kidney function, the mechanisms to adequately distribute volume excess between intra- and extravascular appear to be maintained. These are controlled by the Starling forces (capillary pressure, colloid osmotic pressure) vascular capacitance, compliance and tone [1, 7]. The volume shift between plasma and interstitial volumes prevents both inter-dialytic cardio-vascular burden and intra-dialytic hypotension. Therefore, haemodialysis patients with moderate volume overload are likely to be adequately protected from volume-related complications. In these patients, the relationship between BV and ECV is linear, and the BV to ECV ratio is constant. With moderate inter-dialytic weight gain (2.3 kg), a long dialysis time (296 min) and, therefore, a low specific UF rate (6.98 mL/kg/h), the physiological volume balance is maintained.
It is, however, a limitation of this study that the examined patients are not fully representative of the overall dialysis population.
In case of extreme volume overload, the relationship between BV and ECV becomes nonlinear [1], and beyond some point of volume excess, there is no further increase in BV. All further volume excess is found in the interstitial space.
Because the measurement using the described method [4] requires the infusion of almost one-quarter of a litre of additional volume-severely volume overloaded patients were excluded from this study. But with methodical progress [5], those patients will be of utmost interest to be examined in the future.
In conclusion, in stable haemodialysis patients with moderate volume overload, the relationship between BV and ECV is in the physiologic range and constant between and during dialysis treatments.
AUTHORS’ CONTRIBUTIONS
S.K. and J.K. designed the study, S.K. wrote the first draft of the article and D.S. revised the article. J.K. was responsible for data acquisition. All authors took part in the data analysis and interpretation of the results and approved the final version of the article.
CONFLICT OF INTEREST STATEMENT
D.S. is co-inventor of the US patent application US2020086027 A1 ‘Absolute blood volume estimation device and method’. All remaining authors have nothing to disclose.


Comments