


ABSTRACT
Although associated with better quality of life and potential economic advantages, home dialysis use varies greatly internationally and appears to be underused in many countries. This study aimed to estimate the dialysis-network variability in home dialysis use and identify factors associated with (i) the uptake in home dialysis, (ii) the proportion of time spent on home dialysis and (iii) home dialysis survival (patient and technique).
All adults ≥18 years old who had dialysis treatment during 2017–2019 in mainland France were included. Mixed-effects regression models were built to explore factors including patient or residence characteristics and dialysis network associated with variation in home dialysis use.
During 2017–2019, 7728/78 757 (9.8%) patients underwent dialysis at least once at home for a total of 120 594/1 508 000 (8%) months. The heterogeneity at the dialysis-network level and to a lesser extent the regional level regarding home dialysis uptake or total time spent was marginally explained by patient characteristics or residence and dialysis-network factors. Between-network heterogeneity was less for patient and technique survival. These results were similar when the analysis was restricted to home peritoneal dialysis or home hemodialysis.
Variability between networks in the use of home dialysis was not fully explained by non-modifiable patient and residence characteristics. Our results suggest that to increase home dialysis use in France, one should focus on home dialysis uptake rather than survival. Financial incentives and a quality improvement programme should be implemented at the dialysis-network level to increase home dialysis use.
What is already known about this subject?
Home dialysis use varies greatly internationally and intra-nationally.
Factors other than patient characteristics could explain the variability in the use of home dialysis.
What this study adds?
The heterogeneity among dialysis networks regarding home dialysis uptake was marginally explained by patient characteristics or residence and dialysis-network factors.
Living in an area with high-income inequity and a small housing surface (<30 m²) was associated with reduced home dialysis uptake and reduced proportion of time on home dialysis.
Unlike other studies, we explored various outcomes that are complementary: home dialysis uptake, time spent on home dialysis before death, renal transplantation or switch to facility-based dialysis and a more global indicator which is the total time spent at home to the total dialysis time.
What impact this may have on practice or policy?
According to patient trajectories and health organizations, in some countries, identifying sources of variation in home dialysis use may require analysis of the dialysis network rather than the centre.
Our results also suggest that to increase home dialysis use, one should focus first on home dialysis uptake rather than survival.
Financial incentives and a quality improvement programme should be implemented at the dialysis-network level to increase home dialysis use.
INTRODUCTION
As compared with in-centre haemodialysis (HD), home dialysis is associated with better quality of life and has potential economic advantages. The rate of home dialysis varies greatly internationally and intra-nationally, and the procedure seems to be underutilized in many countries [1]. Efforts are needed to overcome barriers to home dialysis [2]. Patient characteristics such as comorbidities and socioeconomic factors affect the use of home dialysis [3, 4]. However, home dialysis uptake is also affected by the healthcare system, dialysis reimbursement and factors at the centre level that are modifiable [2, 5–7]. As compared with other European countries, in France, the use of home haemodialysis (HHD) or peritoneal dialysis (PD) is low [8]. Furthermore, the proportion of patients treated at home varies across administrative districts from 0 to 25% of all patients on dialysis [the French Renal Epidemiology and Information Network (REIN) annual report: https://www.agence-biomedecine.fr/Les-chiffres-du-R-E-I-N]. In France, nurse-assisted PD is fully covered by the national health insurance and allows the nephrology team to use home dialysis for treating a wide spectrum of patients. Thus, factors other than those related to patient characteristics could explain the variability in home dialysis use across France [9, 10].
Studies have analysed the role of socioeconomic status or place of residence, and centre effects or the offer of care on the home dialysis rate [3, 11]. However, because the populations included in these studies were incident patients on dialysis, they do not provide an overview of the global activity of home dialysis in a country and cannot give information on the total time spent on home dialysis.
Studies of factors at the centre level that could affect home dialysis use are of interest because these factors are potentially modifiable. However, in France, owing to the complexity of dialysis organization, the centre level is inappropriate for studying home dialysis use. Indeed, dialysis units are widespread throughout the country, with various providers (public, private for-profit, private not-for-profit, university hospital) and various treatment arrangements (hospital-based, satellite unit, self-care unit or home dialysis). Therefore, patient trajectories are fragmented. For example, patients with end-stage renal disease may be followed in the pre-dialysis clinics of a public hospital, trained for home dialysis in public in-centre dialysis units and then transferred to non-profit facilities that are the providers of home dialysis. At the same time, home dialysis patients who need in-centre HD, temporarily or definitively, are retransferred to the centre where they initially started dialysis. Consequently, the organization of dialysis in France leads to facility networks that correspond to groups of institutions (hospital, self-care units, dialysis centre, etc.) working together (care chain) to offer the different treatment types in a given area. Thus, in this context, to identify sources of variation, one must study the effect of the dialysis network, rather than the centre, on home dialysis use.
When studying home dialysis use, many indicators are used. Some studies focussed on home dialysis uptake, which reflects the offering of this alternative to facility-based dialysis. Others have focussed on outcomes (i.e. time spent in this technique before death, renal transplantation and/or switch to facility-based HD), which reflects the benefit of this strategy. A more global indicator is the total time spent at home to the total dialysis time for a given centre or dialysis network.
To guide the actions to be taken to increase home dialysis, it is important to choose the adequate granularity, explore modifiable and non-modifiable factors associated with home dialysis and perform an in-depth analysis of the trajectory point with more practice variability. Therefore, this study aimed to estimate the dialysis-network variability in home dialysis use and to identify factors at the dialysis-network level associated with home dialysis uptake and the proportion of time spent on home dialysis. The study also aimed to identify factors associated with home dialysis survival.
MATERIALS AND METHODS
Data source: the French Renal Epidemiology and Information Network (REIN) registry
The REIN is the French national registry of all patients undergoing renal replacement therapy (RRT) [12]. Clinical, demographic and laboratory data are collected at the start of RRT, along with dialysis modalities and are updated annually. Events such as death, transfer, withdrawal from dialysis, placement on a transplant waiting list and kidney transplantation (from living or deceased donors) are systematically reported in real-time. Short-term transfers of <2 months are not recorded (i.e. hospital stay, vacation).
Study population
We included all adults ≥18 years old who were undergoing dialysis during 2017–2019 in mainland France. We reconstructed the patient trajectories and calculated the contributions in terms of follow-up duration for each patient in each dialysis network during their trajectory. The end of follow-up was death or 31 December 2019. Periods with a functioning graft were excluded.
Study variables (Supplementary data, Table S1)
Patient characteristics
The patient characteristics collected in the REIN registry are age, sex, diabetes, heart failure, peripheral vascular disease, cerebrovascular disease, arrhythmia, coronary heart disease, active malignancy, pulmonary disease, liver disease, autonomy for transfer, severe obesity (body mass index ≥35 kg/m²), behavioural disorders, time with RRT (including transplantation) and the theoretical distance (in minutes) from home to the first dialysis centre. The last available information on 31 December 2019 was used.
Place of residence characteristics
On the basis of the complete address (street and postal code) collected in the REIN registry, the percentage of housing surface <30 m², median income (in €) and income inequity (interdecile ratio of the income) were used to characterize the socioeconomic environment of the place of residence (data from the National Institute of Statistics and Economic Studies: https://www.insee.fr/fr/statistiques).
Administrative district of residence characteristics
To characterize the local provision of care that could affect home care access, we used the number of self-care units (per 100 dialysis patients), number of nephrologists (per 100 dialysis patients) and number of private nurses (per 1000 inhabitants) in each administrative district (data sources: https://data.drees.solidarites-sante.gouv.fr/pages/accueil/). Self-care HD is intended for autonomous patients who can provide their own treatment themselves or with the assistance of a certified nurse for certain actions (e.g. arteriovenous fistula puncture) [13]. Private nurses intervene at home for dialysis care of non-autonomous patients. Districts refer to the French administrative division of a given region, called départements.
Network of treatment characteristics
All 1150 French dialysis units in mainland France (excluding overseas territories) were classified into 158 networks by using the Fast Greedy method [14], a hierarchical agglomeration algorithm for detecting community structures. The classification criterion was the number of transfers of patients between each unit declared in the REIN registry during 2016–2018 (34 943 transfers) [15]. During this period, 80% of transfers were observed within a network. The following network characteristics were used: total number of nurses (per 100 dialysis patients) (data sources: https://www.sae-diffusion.sante.gouv.fr/sae-diffusion/recherche.htm), population size (number of patients treated during the period) and legal status (proportion of patients receiving treatment from a private-for-profit provider).
Outcome
The following outcomes of interest were analysed: (i) home dialysis uptake among patients in facility-based HD or new dialysis patients; (ii) home dialysis cessation due to death, transplantation or transfer to facility-based HD defined as (a) home patient survival censored at transplantation and at modality change, (b) home technique survival (including change to facility-based HD) and censored at transplantation and death, (c) home technique failure (including death and a change to facility-based HD) censored at transplantation and (d) home patient access to transplantation; and (iii) proportion of time spent at home for all dialysis patients during 2017–2019.
Statistical analysis
Different mixed-effects regression models were built to explore factors associated with the different outcomes. Successive analyses involved complete data.
A Poisson regression model was used to identify factors associated with the variability in home dialysis uptake: the number of home dialysis starts relative to the total months on facility-based dialysis during the period. All patients who started dialysis directly at home or switched from facility-based dialysis to home dialysis were included. For patients who started dialysis directly at home, time spent in facility-based HD was coded at 0.1 month to include them in the denominator and to take into account that they may have spent some time in training.
A Poisson regression model was used to estimate the effect of the studied factors on patient and technique ‘survival’: a number of events relative to the time spent on home dialysis, calculated for only patients on home dialysis during the period, including incident patients and patients who were on home dialysis on 1 January 2017. Analysis was carried out according to cause of withdrawal (transplantation, death and switch to facility-based dialysis).
A binomial regression model was used to estimate factors associated with the proportion of time spent at home to the total time spent on dialysis during the 3-year period.
The dataset has a hierarchical structure (Supplementary data, Figure S1), each level of which might be a source of variability in home dialysis access: patient (level 1); dialysis unit network: a group of dialysis units (level 2); and region of residence: geographic division of France (level 3). To study the contribution of variability associated with each level to total variability, we used a multi-level analysis. This mixed model allows for introducing a random effect on the network of dialysis treatment (level 2) or region of residence (level 3). For a given network or a given region of residence, the random effect corresponds to the difference with regard to the mean value of the intercept. By introducing random effects, one can take into account the correlation of the outcome of patients within the same network and the same region of residence. The excess chance of receiving home dialysis can be estimated with the exponential of the standard deviation of the dialysis network effect. A positive deviation from the mean is associated with increased odds of receiving home dialysis and a value below the mean with reduced odds.
We explored the risk of endogeneity by centring patient characteristics on their corresponding network mean (group-mean centring; i.e. ‘patient effect’) and introducing the mean of the network in the model (compositional effect, case-mix, ‘customer effect’) [16, 17]. In the final model, patient characteristics were centred on the national mean (grand-mean centring).
Variability of random effects is expressed as the estimated variance with its standard error. Fixed effects are expressed as incidence rate ratios (IRRs), or odds ratios (ORs), as appropriate, with 95% confidence intervals (95% CI). An optimization technique called Newton–Raphson with Ridging was used to overcome some convergence problems.
Variability between networks was presented by region in boxplot graphs of the estimates of the random effect.
The mixed multi-level models were fitted by using the SAS GLIMMIX procedure.
RESULTS
Patients and networks
During 2017–2019, 78 757 patients underwent dialysis in at least one of the 158 French dialysis networks for a total of 1 508 000 months of dialysis; 7728 (9.8%) underwent dialysis at least once at home for a total 120 594 (8.0%) months: 4671 started home dialysis during the period and the others were already on home dialysis at entry in the cohort (1 January 2017). The dialysis technique used at home was PD for 6859 (89%) patients and HD for 830 (11%); 39 patients successively underwent both (Supplementary data, Figure S2).
Patients undergoing home dialysis were younger and had fewer comorbidities, except heart failure, were more often female and had higher body mass index than those undergoing facility-based HD (Table 1). Patients undergoing home HD were younger, more often male and had a longer history of RRT (4.5 years) and fewer comorbidities, except for malignancy, than home PD patients.
Patients and residence characteristics according to the place of treatment and dialysis technique
| Home dialysis | ||||
|---|---|---|---|---|
| Home dialysis (n = 7728) | Facility-based dialysis (n = 71 029) | Peritoneal dialysis (n = 6898) | Home haemodialysis (n = 869) | |
| Patient characteristics | ||||
| Age (years); median (Q1–Q3) | 68.9 (55.2–79.9) | 70.9 (60.4–80.2) | 70.4 (58.4–80.9) | 51.8 (41.2–62.7) |
| BMI (kg/m²); median (Q1–Q3) | 25.5 (22.5–29.0) | 25.3 (22.0–29.3) | 25.6 (22.6–29.1) | 25.0 (21.9–28.5) |
| History of RRT (years); median (Q1–Q3) | 0.0 (0.0–2.0) | 1.0 (0.0–4.7) | 0.0 (0.0–1.5) | 4.5 (0.4–16.3) |
| Female; n (%) | 2999 (38.8) | 26 205 (36.9) | 2740 (39.7) | 273 (31.4) |
| Primary renal diagnosis (%) | ||||
| Other | 1140 (14.8) | 10 552 (14.9) | 943 (13.7) | 206 (23.7) |
| Glomerulonephritis | 1286 (16.6) | 8915 (12.6) | 1007 (14.6) | 290 (33.4) |
| Hypertensive nephropathy | 1797 (23.3) | 16 991 (23.9) | 1723 (25) | 81 (9.3) |
| Unknown | 1370 (17.7) | 10 675 (15) | 1287 (18.7) | 86 (9.9) |
| Diabetic nephropathy | 1231 (15.9) | 15 630 (22) | 1172 (17) | 60 (6.9) |
| ADPKD | 534 (6.9) | 4212 (5.9) | 457 (6.6) | 79 (9.1) |
| Pyelonephritis | 328 (4.2) | 3569 (5) | 270 (3.9) | 64 (7.4) |
| Vascular nephropathy | 42 (0.5) | 485 (0.7) | 39 (0.6) | 3 (0.3) |
| Comorbidities; n (%) | ||||
| Diabetes mellitus | 2780 (36.2) | 30 933 (43.8) | 2645 (38.6) | 138 (15.9) |
| Heart failure | 2039 (26.8) | 19 118 (27.3) | 1920 (28.4) | 126 (14.6) |
| Coronary heart disease | 2048 (27) | 20 920 (29.9) | 1904 (28.1) | 149 (17.2) |
| Peripheral vascular disease | 1569 (20.8) | 19 209 (27.6) | 1439 (21.5) | 132 (15.3) |
| Dysrhythmia | 2022 (26.6) | 19 696 (28.1) | 1907 (28.2) | 121 (14) |
| Cerebrovascular disease | 880 (11.6) | 9596 (13.7) | 831 (12.2) | 52 (6) |
| Malignancy | 711 (9.4) | 9165 (13.1) | 616 (9.1) | 99 (11.4) |
| Pulmonary disease | 1104 (14.6) | 12643 (18.1) | 1004 (14.9) | 102 (11.8) |
| Behaviour disorder | 224 (3.1) | 3253 (4.8) | 213 (3.3) | 11 (1.3) |
| Liver disease | 297 (4) | 3652 (5.3) | 257 (3.8) | 40 (4.7) |
| Mobility, n (%) | ||||
| Totally dependent | 336 (4.6) | 4855 (7.1) | 324 (5) | 12 (1.4) |
| Autonomy for transfer | 6350 (86.5) | 53 496 (78.7) | 5575 (85.4) | 813 (95.5) |
| Need help | 655 (8.9) | 9609 (14.1) | 629 (9.6) | 26 (3.1) |
| Distance to dialysis centre (minutes); median (Q1–Q3) | 13.0 (7.0–22.0) | 11.0 (6.0–19.0) | 13.0 (7.0–22.0) | 13.0 (7.0–22.0) |
| Residence characteristics | ||||
| % of housing surface <30 m²; median (Q1–Q3) | 1.8 (0.4–4.9) | 2.6 (0.8–6.3) | 1.8 (0.4–4.9) | 2.3 (0.4–5.6) |
| Income (€/year); median (Q1–Q3) | 21 020 (19 370–23 150) | 20 790 (19 110–23 050) | 21 000 (19 370–23 140) | 21 120 (19 330–23 160) |
| Interdecile ratio income; median (Q1–Q3) | 3.2 (2.9–3.6) | 3.3 (2.9–3.7) | 3.2 (2.9–3.6) | 3.3 (2.9–3.7) |
| % with university degree; median (Q1–Q3) | 24.6 (18.6–32.3) | 25.2 (19.1–33.3) | 24.6 (18.6–32.1) | 25.1 (18.6–32.8) |
| Spatial environment (%) | ||||
| Isolated area | 440 (5.8) | 3261 (4.7) | 387 (5.7) | 56 (6.6) |
| Peri-urban area | 2739 (36.2) | 20 488 (29.4) | 2473 (36.6) | 281 (33.3) |
| Urban centre | 4393 (58) | 45 932 (65.9) | 3905 (57.7) | 508 (60.1) |
RRT, renal replacement therapy; ADPKD, autosomal dominant polycystic kidney disease.
Factors associated with home dialysis uptake
Because of possible multiple episodes of home dialysis periods, during the 3 years, 4671 patients showed 4774 home dialysis uptakes (i.e. incidence of 0.32%); 90% of home dialysis uptake was observed in the 3-month period of RRT initiation. Comorbidities, smaller distance to dialysis facility and residence and network characteristics were associated with reduced home dialysis uptake (Table 2). Some factors were differently associated with home PD and HD uptake.
Adjusted incidence rate ratios (aIRR) (95% CI) of the effect of patient, residence and network characteristics on uptake of home dialysis (model with network random effect and region of residence random effect) and according to the technique (PD or HD)
| Home dialysis uptake (N events = 4774) | Home PD uptake (N events = 4235) | Home HD uptake (N events = 539) | |||||||
|---|---|---|---|---|---|---|---|---|---|
| Variable | aIRR | IRR inf | IRR sup | aIRR | IRR inf | IRR sup | aIRR | IRR inf | IRR sup |
| Patient characteristics | |||||||||
| Agea | 0.72 | 0.69 | 0.75 | 0.82 | 0.78 | 0.87 | 0.53 | 0.48 | 0.58 |
| Male | 0.93 | 0.81 | 1.06 | 0.92 | 0.78 | 1.08 | 0.89 | 0.69 | 1.15 |
| Diabetes mellitus | 0.84 | 0.72 | 0.98 | 0.95 | 0.80 | 1.12 | 0.52 | 0.36 | 0.74 |
| Heart failure | 1.15 | 0.98 | 1.37 | 1.18 | 0.98 | 1.43 | 0.94 | 0.64 | 1.40 |
| Dysrhythmia | 1.12 | 0.95 | 1.33 | 1.20 | 0.99 | 1.45 | 0.85 | 0.55 | 1.32 |
| Peripheral vascular disease | 0.80 | 0.66 | 0.956 | 0.84 | 0.69 | 1.03 | 0.97 | 0.64 | 1.47 |
| Cerebrovascular disease | 0.87 | 0.70 | 1.09 | 0.89 | 0.70 | 1.14 | 0.83 | 0.49 | 1.39 |
| Coronary heart disease | 0.97 | 0.82 | 1.15 | 0.99 | 0.82 | 1.19 | 0.94 | 0.64 | 1.40 |
| Pulmonary disease | 0.86 | 0.71 | 1.05 | 0.78 | 0.62 | 0.97 | 1.21 | 0.80 | 1.83 |
| Liver disease | 0.87 | 0.64 | 1.19 | 0.92 | 0.64 | 1.32 | 0.76 | 0.41 | 1.39 |
| Malignancy | 0.77 | 0.61 | 0.97 | 0.79 | 0.61 | 1.02 | 0.81 | 0.50 | 1.32 |
| Behaviour disorder | 0.54 | 0.37 | 0.79 | 0.77 | 0.52 | 1.15 | 0.14 | 0.04 | 0.58 |
| Autonomy for transfer | 1.26 | 1.01 | 1.56 | 1.05 | 0.84 | 1.32 | 3.90 | 1.71 | 8.88 |
| Autosomal polycystic renal disease | 0.96 | 0.74 | 1.23 | 0.92 | 0.66 | 1.27 | 1.50 | 1.01 | 2.24 |
| BMI >35 kg/m² | 0.51 | 0.38 | 0.70 | 0.49 | 0.34 | 0.70 | 0.62 | 0.35 | 1.09 |
| Denutrition | 1.01 | 0.87 | 1.16 | 1.12 | 0.95 | 1.33 | 0.74 | 0.56 | 0.96 |
| History of RRTa | 0.41 | 0.34 | 0.49 | 0.02 | 0.01 | 0.04 | 1.13 | 0.96 | 1.31 |
| Emergency dialysis start | 0.76 | 0.65 | 0.89 | 0.84 | 0.70 | 1.01 | 0.63 | 0.46 | 0.86 |
| Distance to dialysis facility, minutesb | 1.15 | 1.06 | 1.24 | 1.09 | 0.99 | 1.20 | 1.27 | 1.09 | 1.47 |
| Residence characteristics | |||||||||
| Housing surface <30 m²e | 0.70 | 0.53 | 0.93 | 0.74 | 0.53 | 1.03 | 0.63 | 0.37 | 1.08 |
| Median incomed | 1.27 | 0.87 | 1.85 | 1.22 | 0.78 | 1.90 | 1.36 | 0.67 | 2.75 |
| Income inequity | 0.81 | 0.67 | 0.99 | 0.92 | 0.74 | 1.15 | 0.57 | 0.39 | 0.84 |
| University degree | 1.00 | 0.86 | 1.17 | 0.98 | 0.82 | 1.17 | 1.07 | 0.80 | 1.44 |
| Peri-urban and isolated area | 0.84 | 0.70 | 1.01 | 0.94 | 0.76 | 1.16 | 0.74 | 0.52 | 1.05 |
| Health care offer in the administrative district of residence | |||||||||
| Self-care units/10 000 inhabitants | 0.18 | 0.01 | 2.54 | 0.09 | 0.00 | 1.60 | 0.69 | 0.00 | 106.5 |
| Nephrologists/10 000 inhabitants | 1.05 | 0.50 | 2.19 | 0.85 | 0.35 | 2.09 | 2.76 | 0.75 | 10.11 |
| Nurses/1000 inhabitants | 1.12 | 0.93 | 1.34 | 1.09 | 0.90 | 1.33 | 1.16 | 0.81 | 1.66 |
| Network characteristics | |||||||||
| Nephrologists/100 dialysis patients | 1.18 | 0.92 | 1.51 | 1.24 | 0.96 | 1.61 | 0.94 | 0.57 | 1.57 |
| Patients in the networkc | 1.02 | 0.99 | 1.04 | 1.01 | 0.99 | 1.03 | 1.01 | 0.98 | 1.05 |
| Nurses/100 dialysis patients | 0.95 | 0.90 | 1.001 | 0.93 | 0.88 | 0.98 | 0.99 | 0.90 | 1.09 |
| Patients treated in private for profite | 0.91 | 0.88 | 0.95 | 0.91 | 0.87 | 0.95 | 0.92 | 0.85 | 0.995 |
aIRR, incidence rate ratio adjusted on all factors; HD, hemodialysis; PD, peritoneal dialysis; BMI, body mass index; RRT, renal replacement therapy.
aFor 10-year increase, bfor 10-min increase, cfor 100-patient increase, dfor 10 000€/year increase, efor 10% increase.
Reading key:
cells are left in blue when the effect is not significant.
Home dialysis uptake decreases by 30% when the patient's age increases by 10 years or when patients live in a place where the percent of housing <30 m² increases by 10%.
Home dialysis uptake increases by 15% when the distance to dialysis facility increases by 10 min.
After introducing patient, residence and dialysis-network factors, the network and regional variances in home dialysis uptake slightly decreased from 0.34 (SE 0.06) and 0.22 (SE 0.09) to 0.29 (SE 0.07) and 0.13 (SE 0.08), respectively, in the adjusted model (Table 3). Variances were higher for home HD than PD uptake. Variability between networks within a region and between regions is presented in Figure 1.
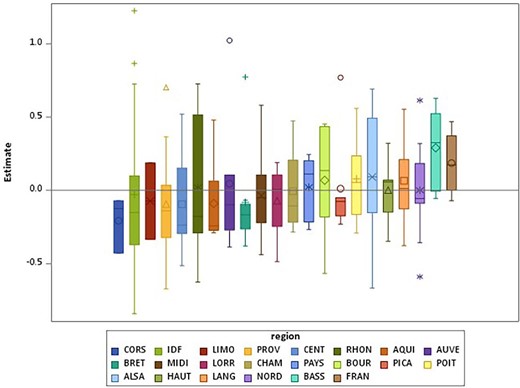
Boxplots of the estimates of the network random effects by region for home dialysis uptake.
Estimates of the random intercept variance between networks and regions for the outcome criteria related to home dialysis
| Crudea | Adjustedb | |||||||
|---|---|---|---|---|---|---|---|---|
| Inter-network variability | Inter-region variability | Inter-network variability | Inter-region variability | |||||
| Estimate | SE | Estimate | SE | Estimate | SE | Estimate | SE | |
| Home dialysis uptake | ||||||||
| All techniques | 0.34 | (0.06) | 0.22 | (0.09) | 0.29c | (0.07) | 0.13 | (0.08) |
| PD | 0.37 | (0.07) | 0.22 | (0.09) | 0.27 | (0.07) | 0.12 | (1.64) |
| HD | 0.54 | (0.13) | 0.38 | (0.18) | 0.60 | (0.17) | 0.56 | (0.31) |
| Death | ||||||||
| All techniques | 0.05 | (0.02) | 0.06 | (0.03) | 0.08 | (0.04) | 0.00 | (0.02) |
| PD | 0.07 | (0.03) | 0.04 | (0.03) | 0.04 | (0.03) | 0.00 | |
| HD | NC | NC | ||||||
| Transplantation | ||||||||
| All techniques | 0.10 | (0.04) | 0.02 | (0.03) | 0.12 | (0.06) | 0.06 | (0.06) |
| PD | 0.09 | (0.04) | 0.03 | (0.03) | 0.06 | (0.06) | 0.08 | (0.07) |
| HD | NC | NC | ||||||
| Switch to facility-based HD | ||||||||
| All techniques | 0.03 | (0.02) | 0.02 | (0.02) | 0.07 | (0.04) | 0.00 | |
| PD | 0.03 | (0.02) | 0.02 | (0.02) | 0.06 | (0.04) | 0.00 | |
| HD | NC | NC | ||||||
| Technique failure | ||||||||
| All techniques | 0.02 | (0.01) | 0.01 | (0.01) | 0.01 | (0.01) | 0.00 | |
| PD | 0.03 | (0.01) | 0.01 | (0.01) | 0.02 | (0.02) | 0.00 | |
| HD | 0.17 | (0.13) | 0.04 | (0.10) | 0.68 | (0.38) | 0.00 | |
| Proportion of home dialysis | ||||||||
| All techniques | 3.04 | (0.41) | 0.41 | (0.26) | 1.98 | (0.28) | 0.27 | (0.20) |
| PD | 4.06 | (0.56) | 0.52 | (0.33) | 2.54 | (0.37) | 0.28 | (0.23) |
| HD | 3.53 | (0.50) | 0.40 | (0.29) | 3.93 | (0.59) | 0.64 | (0.49) |
PD, periotoneal dialysis; HD, hemodialysis; SE, standard error; NC, not calculated.
aEmpty model.
bAdjusted on patient, residence and networks characteristics.
cReading key: the higher the random intercept variance, the more the networks or regions differ from each other.
The excess chance of being treated by home dialysis can be estimated with the exponential of the standard deviation (SD) of the dialysis network effect. The adjusted odds ratio from the network random effect was 1.7 (= exp(sqr(0.29)), so being treated in a network that deviates from the mean by 1 SD increased the odds of being treated by home dialysis by 70%.
Factors associated with time spent on home dialysis
Among the 6889 patients during their PD period, 1607 (39%) died, 1390 (35%) switched to facility-based HD, 216 (5%) were lost to follow-up and 843 (21%) underwent transplantation. Among the 869 patients during their home HD period, 57 (14%) died, 165 (43%) switched to facility-based HD, 3 (1%) were lost to follow-up and 170 (42%) underwent transplantation (Supplementary data, Figure S1).
Comorbidities and residence characteristics were associated with the occurrence of an event (Table 4 and Supplementary data, Table S2a and S2b for home PD and HD patients). The adjusted variability between networks was low for all outcomes (Figure 2). We observed no regional variability except for transplantation (Table 3).
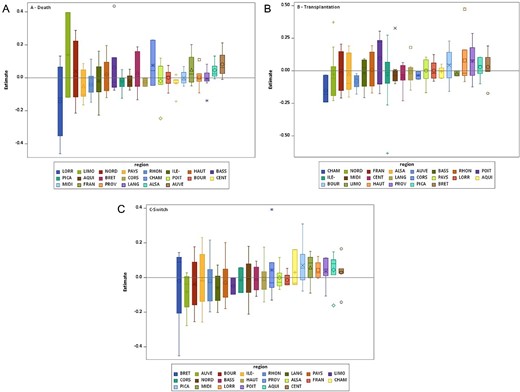
Boxplots of the estimates of the network random effects by region for (A) death in home dialysis, (B) transplantation in home dialysis and (C) switch to facility-based haemodialysis.
Incidence rate ratios (95% CI) of the effect of patient characteristics on home dialysis ‘survival’ (model with network random effect and region of residence random effect) for patients under home dialysis
| Failurea | Death | Switch to facility-based HD | Transplantation | |||||||||
|---|---|---|---|---|---|---|---|---|---|---|---|---|
| Variable | aIRR | IRR inf | IRR sup | aIRR | IRR inf | IRR sup | aIRR | IRR inf | IRR sup | aIRR | IRR inf | IRR sup |
| Patient characteristics | ||||||||||||
| Ageb | 1.13 | 1.08 | 1.18 | 1.79 | 1.65 | 1.95 | 0.88 | 0.84 | 0.93 | 0.69 | 0.65 | 0.74 |
| Male | 1.09 | 0.97 | 1.23 | 1.01 | 0.84 | 1.20 | 1.17 | 0.99 | 1.38 | 1.23 | 0.99 | 1.52 |
| Diabetes mellitus | 1.12 | 0.99 | 1.27 | 1.24 | 1.03 | 1.48 | 1.12 | 0.93 | 1.34 | 0.77 | 0.57 | 1.04 |
| Heart failure | 1.52 | 1.32 | 1.74 | 1.99 | 1.64 | 2.41 | 1.10 | 0.89 | 1.36 | 0.58 | 0.37 | 0.91 |
| Dysrhythmia | 1.22 | 1.07 | 1.39 | 1.48 | 1.23 | 1.77 | 0.96 | 0.78 | 1.19 | 0.55 | 0.35 | 0.87 |
| Peripheral vascular disease | 1.11 | 0.97 | 1.28 | 1.02 | 0.85 | 1.24 | 1.30 | 1.06 | 1.60 | 0.59 | 0.37 | 0.94 |
| Cerebrovascular disease | 0.99 | 0.84 | 1.17 | 0.97 | 0.77 | 1.22 | 1.06 | 0.83 | 1.36 | 0.74 | 0.46 | 1.21 |
| Coronary heart disease | 0.98 | 0.86 | 1.13 | 1.08 | 0.90 | 1.30 | 0.95 | 0.77 | 1.16 | 0.63 | 0.42 | 0.95 |
| Pulmonary disease | 1.11 | 0.95 | 1.29 | 1.18 | 0.96 | 1.46 | 1.11 | 0.88 | 1.41 | 0.77 | 0.47 | 1.26 |
| Liver disease | 1.44 | 1.10 | 1.87 | 2.35 | 1.67 | 3.30 | 0.97 | 0.63 | 1.49 | 0.59 | 0.26 | 1.34 |
| Malignancy | 1.04 | 0.87 | 1.24 | 1.10 | 0.85 | 1.41 | 1.10 | 0.85 | 1.42 | 0.24 | 0.11 | 0.52 |
| Behaviour disorder | 0.95 | 0.72 | 1.25 | 1.17 | 0.82 | 1.68 | 0.76 | 0.48 | 1.20 | 0.32 | 0.10 | 1.01 |
| Autonomy for transfer | 0.79 | 0.67 | 0.92 | 0.75 | 0.62 | 0.92 | 0.95 | 0.73 | 1.23 | 5.89 | 1.87 | 18.57 |
| Autosomal polycystic renal disease | 0.90 | 0.69 | 1.17 | 0.59 | 0.33 | 1.06 | 1.11 | 0.82 | 1.50 | 1.95 | 1.46 | 2.60 |
| BMI >35 kg/m² | 0.92 | 0.68 | 1.23 | 1.23 | 0.82 | 1.84 | 0.72 | 0.47 | 1.11 | 0.52 | 0.26 | 1.02 |
| Denutrition | 1.35 | 1.19 | 1.54 | 1.53 | 1.27 | 1.84 | 1.16 | 0.98 | 1.39 | 0.91 | 0.72 | 1.14 |
| History of RRTc | 0.92 | 0.83 | 1.02 | 1.14 | 0.96 | 1.34 | 0.84 | 0.74 | 0.96 | 0.63 | 0.52 | 0.77 |
| Distance to dialysis facilityc | 0.94 | 0.87 | 1.01 | 0.93 | 0.83 | 1.03 | 0.93 | 0.84 | 1.04 | 1.07 | 0.93 | 1.22 |
| Residence characteristics | ||||||||||||
| Housing surface <30 m²f | 1.02 | 0.81 | 1.28 | 0.96 | 0.67 | 1.36 | 1.01 | 0.74 | 1.39 | 1.45 | 0.95 | 2.19 |
| Median incomee | 1.41 | 1.04 | 1.90 | 0.98 | 0.60 | 1.59 | 1.69 | 1.13 | 2.53 | 1.11 | 0.63 | 1.95 |
| Income inequity | 0.99 | 0.87 | 1.14 | 0.89 | 0.70 | 1.13 | 1.03 | 0.86 | 1.22 | 0.73 | 0.55 | 0.98 |
| University degree | 0.91 | 0.81 | 1.03 | 0.97 | 0.81 | 1.16 | 0.91 | 0.77 | 1.06 | 1.15 | 0.92 | 1.43 |
| Peri-urban and isolated area | 0.96 | 0.83 | 1.12 | 0.91 | 0.73 | 1.14 | 0.99 | 0.80 | 1.22 | 1.07 | 0.81 | 1.41 |
| Health care offer in the administrative district of residence | ||||||||||||
| Self-care units/10 000 inhabitants | 2.52 | 0.51 | 12.36 | 0.82 | 0.06 | 10.97 | 7.77 | 0.80 | 75.48 | 2.92 | 0.12 | 73.25 |
| Nephrologists/10 000 inhabitants | 1.06 | 0.59 | 1.90 | 1.44 | 0.57 | 3.64 | 0.87 | 0.39 | 1.94 | 1.36 | 0.46 | 3.99 |
| Nurses/1000 inhabitants | 0.93 | 0.85 | 1.01 | 0.88 | 0.76 | 1.01 | 0.96 | 0.85 | 1.09 | 0.97 | 0.79 | 1.19 |
| Network characteristics | ||||||||||||
| Nephrologists/100 dialysis patients | 0.99 | 0.86 | 1.15 | 0.97 | 0.77 | 1.24 | 1.01 | 0.81 | 1.25 | 1.15 | 0.84 | 1.57 |
| Patients in the networkd | 1.00 | 0.99 | 1.01 | 1.01 | 0.99 | 1.03 | 1.00 | 0.98 | 1.01 | 0.98 | 0.96 | 1.00 |
| Nurses/100 dialysis patients | 1.02 | 0.99 | 1.05 | 1.04 | 0.99 | 1.08 | 1.00 | 0.96 | 1.05 | 0.97 | 0.92 | 1.03 |
| Patients treated in private for profitf | 1.01 | 0.98 | 1.03 | 0.97 | 0.93 | 1.01 | 1.03 | 0.996 | 1.07 | 0.97 | 0.92 | 1.02 |
aIRR, incidence rate ratio adjusted on patient, residence and networks characteristics; HD, haemodialysis; BMI, body mass index.
aDeath and change to facility-based HD.
bFor 10-year increase, cfor 10-min increase, dfor 100-patient increase, efor 10 000€/year increase, ffor 10% increase.
Reading key:
Cells are left in blue when the effect is not significant.
Home dialysis failure decreases by 21% when the patient is autonomous for transfer as compared with a patient that needs help.
Transfer to renal transplantation increases by 30% when patients live in a place with lower income inequities.
Death increases by 50% in the presence of denutrition.
Factors associated with the proportion of time on home dialysis
During 2017–2019, 1 508 000 months of dialysis were provided in mainland France; 120 594 (8.0%) months were spent at home. Comorbidities, residence and network characteristics were associated with an increased proportion of time spent on home dialysis (Table 5). Some factors were differently associated with time spent on home PD and HD.
Odds ratios (95% CI) estimating the effect patient, residence and network characteristics on the proportion of time spent on home dialysis among the total time on dialysis (model with network random effect and region of residence random effect)
| Home HD | Home PD | Home HD | |||||||
|---|---|---|---|---|---|---|---|---|---|
| Variable | aOR | OR inf | OR sup | aOR | OR inf | OR sup | aOR | OR inf | OR sup |
| Patient characteristics | |||||||||
| Agea | 0.93 | 0.92 | 0.93 | 1.01 | 1.01 | 1.02 | 0.58 | 0.57 | 0.59 |
| Male | 0.83 | 0.81 | 0.84 | 0.75 | 0.74 | 0.76 | 1.35 | 1.29 | 1.42 |
| Diabetes mellitus | 0.77 | 0.76 | 0.78 | 0.79 | 0.77 | 0.80 | 0.53 | 0.50 | 0.57 |
| Heart failure | 0.98 | 0.96 | 0.999 | 0.99 | 0.97 | 1.014 | 0.81 | 0.76 | 0.863 |
| Dysrhythmia | 0.95 | 0.93 | 0.97 | 0.94 | 0.91 | 0.96 | 1.13 | 1.06 | 1.20 |
| Peripheral vascular disease | 0.78 | 0.77 | 0.80 | 0.83 | 0.81 | 0.85 | 0.74 | 0.70 | 0.80 |
| Cerebrovascular disease | 0.89 | 0.87 | 0.91 | 0.92 | 0.89 | 0.94 | 0.73 | 0.66 | 0.79 |
| Coronary heart disease | 1.00 | 0.98 | 1.02 | 1.00 | 0.98 | 1.02 | 1.06 | 0.998 | 1.12 |
| Pulmonary disease | 0.78 | 0.77 | 0.80 | 0.76 | 0.74 | 0.78 | 1.16 | 1.08 | 1.24 |
| Liver disease | 0.63 | 0.60 | 0.66 | 0.63 | 0.60 | 0.66 | 0.53 | 0.48 | 0.59 |
| Malignancy | 0.80 | 0.78 | 0.82 | 0.76 | 0.74 | 0.79 | 1.27 | 1.18 | 1.36 |
| Behaviour disorder | 0.77 | 0.74 | 0.81 | 0.86 | 0.82 | 0.90 | 0.45 | 0.40 | 0.52 |
| Autonomy for transfer | 1.52 | 1.48 | 1.56 | 1.47 | 1.44 | 1.51 | 2.14 | 1.93 | 2.37 |
| Autosomal polycystic renal disease | 0.91 | 0.88 | 0.94 | 0.92 | 0.88 | 0.95 | 1.61 | 1.50 | 1.73 |
| BMI >35 kg/m² | 0.57 | 0.55 | 0.59 | 0.56 | 0.54 | 0.58 | 0.72 | 0.65 | 0.80 |
| Denutrition | 0.85 | 0.84 | 0.87 | 0.86 | 0.84 | 0.88 | 0.77 | 0.74 | 0.81 |
| History of RRTa | 0.64 | 0.63 | 0.65 | 0.28 | 0.27 | 0.28 | 1.76 | 1.73 | 1.79 |
| Distance to dialysis facility, minb | 1.09 | 1.07 | 1.10 | 1.07 | 1.06 | 1.08 | 1.32 | 1.28 | 1.35 |
| Residence characteristics | |||||||||
| Housing surface <30 m²e | 0.70 | 0.67 | 0.72 | 0.72 | 0.69 | 0.75 | 0.60 | 0.55 | 0.65 |
| Median incomed | 1.13 | 1.07 | 1.18 | 1.09 | 1.03 | 1.15 | 1.33 | 1.19 | 1.50 |
| Income inequity | 0.86 | 0.84 | 0.88 | 0.94 | 0.92 | 0.966 | 0.66 | 0.62 | 0.700 |
| University degree | 1.05 | 1.03 | 1.07 | 1.02 | 0.997 | 1.04 | 1.09 | 1.041 | 1.15 |
| Peri-urban and isolated area | 0.94 | 0.92 | 0.96 | 0.97 | 0.94 | 0.99 | 0.78 | 0.73 | 0.83 |
| Health care offer in the administrative district of residence | |||||||||
| Self-care units/10 000 inhabitants | 55.28 | 35.46 | 86.17 | 84.13 | 52.24 | 135.49 | 0.28 | 0.08 | 0.93 |
| Nephrologists/10 000 inhabitants | 1.22 | 1.10 | 1.34 | 1.20 | 1.08 | 1.35 | 1.71 | 1.37 | 2.15 |
| Nurses/1000 inhabitants | 1.08 | 1.04 | 1.12 | 1.05 | 1.002 | 1.10 | 1.52 | 1.389 | 1.65 |
| Network characteristics | |||||||||
| Nephrologists/100 dialysis patients | 1.26 | 0.81 | 1.95 | 1.24 | 0.75 | 2.04 | 1.16 | 0.58 | 2.32 |
| Patients in the networkc | 1.10 | 1.05 | 1.15 | 1.11 | 1.05 | 1.16 | 1.08 | 1.01 | 1.15 |
| Nurses/100 dialysis patients | 0.86 | 0.78 | 0.94 | 0.85 | 0.76 | 0.94 | 0.89 | 0.77 | 1.03 |
| Patients treated in private for profite | 0.82 | 0.77 | 0.88 | 0.80 | 0.74 | 0.87 | 0.84 | 0.75 | 0.93 |
aOR, odds ratio adjusted on patient, residence and dialysis-network characteristics; HD, haemodialysis; PD, peritoneal dialysis; BMI, body mass index; RRT, renal replacement therapy.
aFor 10-year increase, bfor 10-min increase, cfor 100-patient increase, dfor 10 000€/year increase, efor 10% increase.
Reading key:
Cells left in blue when the effect is not significant.
Proportion of time spent at home decreases by 20% when the patient is treated in a network that has 10% more patients in a private facility.
Proportion of time spent is multiplied by 55 when patients live in an administrative district with 10% more self-care units.
After introducing patient, residence and dialysis-network factors, the network and regional variances in home dialysis decreased from 3.04 (SE 0.41) and 0.41 (SE 0.26) to 1.98 (SE 0.28) and 0.27 (0.20), respectively, in the adjusted model (Table 5). Considering home PD, the variance of the network random effect was higher, 2.54 (SE 0.37), with a similar variance of the region random effect, 0.28 (SE 0.23). Considering home HD, both variances increased (network effect size 3.93, SE 0.59; region effect size 0.64, SE 0.49; Table 3). Variability between networks within a region and between regions is presented in Figure 3.
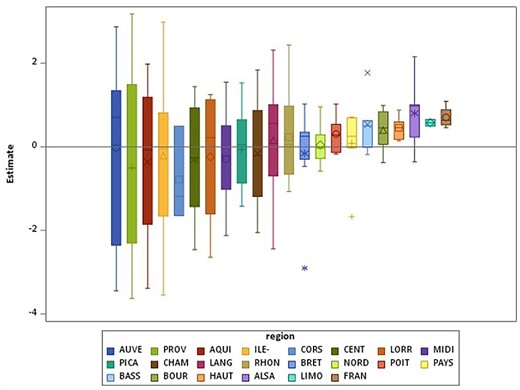
Boxplots of the estimates of the network random effects by region for proportion of time in home dialysis.
DISCUSSION
Our study shows heterogeneity among dialysis networks regarding the uptake of home dialysis, which was marginally explained by patient or residence characteristics and the dialysis network. These results were similar when the analysis was restricted to PD or HHD uptake. The adjusted odds ratio (OR) from the network random effect was 1.7, so being treated in a network that deviated from the mean by 1 (standard deviation) SD increased the odds of receiving home dialysis by 70%. The magnitude of this network effect was greater than that for age, for example (OR 1.4 for a 10-year decrease in age). Variability between the dialysis networks regarding the proportion of time on home dialysis agreed with this finding. The inter-network variability was low for the causes of home dialysis cessation: death, transplantation and switch to facility-based HD. Heterogeneity among the networks was higher for home HD than PD.
Previous studies of home dialysis uptake demonstrated heterogeneity among centres [3, 11]. Our hypothesis was that within one network, the heterogeneity of practice would be small. In the Australian New-Zeland Dialysis and Transplant Registry (ANZDATA) study, the proportion of incident patients on home-based therapies within 6 months of dialysis initiation varied from 0 to 87% across centres [11].
In the USA, the use of home dialysis was positively associated with facility size, with no association with profit status [18]. In Australia and New Zealand, small centre size was associated with less uptake of home dialysis [11]; data from the same countries showed less likelihood of PD treatment for individuals from advantaged areas who more frequently received treatment in private hospitals [19]. In our study, the size of the network was not associated with less home dialysis uptake but with longer time on home dialysis. The number of dialysis nurses negatively affected the time spent on home dialysis. The number of nurses may reflect the fact that more patients received treatment in facility-based units in a given network that requires more nurses. The proportion of patients in treatment in private centres was associated with less likelihood of home dialysis use and shorter time spent on home dialysis. This result should be explored further. Dialysis-related costs are fully covered by the national health insurance whatever the care provider (public, private for-profit, or private not-for-profit) according to a yearly tariff and the modality of treatment [13]. Home dialysis is less well reimbursed than facility-based dialysis, with hidden costs probably less well taken into account (training, monitoring, logistical support).
Home dialysis use was not affected by the number of self-care HD units in the administrative district of residence, although an increasing number of HD units may be associated with the decline of home therapy [20, 21].
Income inequity and low housing-surface proportion in the place of residence were associated both with less home dialysis uptake and less proportion of time on home dialysis. These findings are consistent with the results of two recent studies of the REIN registry data showing that social deprivation affected both home dialysis and self-care dialysis use [22, 23]. Previous studies have demonstrated that housing could be a barrier to home dialysis use [24]. Actions to provide adapted housing in case of medical problems exist in France, and could help overcome this barrier.
The second level of variability was the region of residence, which aimed to take into account not only the regional offer planning but also the impact of the regional university hospital on professional training and access to transplantation. However, the inter-region variability was more modest.
Our results must be compared with caution with other registry-based studies that used other populations and methods. Two ANZDATA studies analysed uptake of home-based dialysis after dialysis initiation, during a median follow-up of 3 years or within the first 6 months [11, 19]. The United Kingdom Renal Registry study analysed uptake of home-based dialysis within the first year after dialysis initiation [3]. The two Canadian Organ Replacement Register (CORR) studies analysed the outcome of patients initiating home dialysis within 1 year after dialysis initiation [25, 26]. We decided to study all dialysis patients (new and prevalent) over 3 years in order to have an overview of factors that could influence home dialysis use in France. This population is especially relevant for home HD, with a median history of RRT of 4.5 years versus 0 years for PD patients at inclusion in our study.
Patient characteristics were associated with home dialysis uptake, transfer to facility-based HD, death, transplantation and the composite endpoint point of death or returning to facility-based HD. Some factors are common between PD and home HD, but some seem specific to one technique.
In accordance with other studies [3, 11, 25, 26], patients treated at home were younger, with fewer comorbidities and patients on home PD were older and with more comorbidities than patients on home HD. This latter finding could be explained by the possibility of nursing assistance at home for PD patients in France [27]. Of note, the median age for home HD is similar in France and Australia or New Zealand, whereas, in France, the median age for PD patients is higher [11]. Autosomal polycystic renal disease was associated with increased home HD use and less PD use, although it could be a reasonable option for these patients [28].
Surprisingly, emergency dialysis start was not associated with reduced PD uptake, but a longer history of RRT decreased the probability of PD start. This finding could illustrate the possibility of an early switch to PD after starting on HD with a temporary catheter and a lower rate of late transfer to PD because of patients’ willingness or the medical decision to leave patients on HD for various medical reasons. However, an emergency start was associated with less home HD uptake, which is consistent with the ANZDATA results showing late referral to nephrologist care associated with lower uptake of home HD than PD [11].
Increased age was associated with increased rates of death and less switch to facility-based HD in PD patients. Despite there being no data on such a practice, nursing-assisted PD may allow nephrology teams to maintain frail and older patients at home ‘until the end’. In addition, the quality of life associated with home therapy may be predominant in older patients’ choice toward palliative care. However, age was associated with increased rates of a switch to facility-based HD for home HD patients. These results are similar to the CORR study, showing age >65 years associated with increased risk of transfer to in-centre HD in home HD patients, with no significant association for PD patients [25]. In France and Canada, easier access to nursing-assisted care or help from a caregiver/family member for PD than home HD in older patients may explain the better technique survival in this group. Comorbidities were associated with a reduced proportion of time spent on home dialysis as a result of less uptake. As in the CORR study, male PD patients showed an increased risk of transfer to facility-based HD, but sex was not associated with the risk of returning to facility-based HD in home HD patients. Male sex was associated with more time spent on home HD and a reduced proportion of time spent on PD. Peripheral vascular disease was associated with an increased rate of a switch to facility-based HD in home HD patients, which may reflect the greater risk of returning to facility-based HD by individuals with vascular access problems [29]. Pulmonary disease and malignancy were associated with an increased proportion of home HD among total time on dialysis, which could reflect patients’ willingness to remain on their dialysis modality because of their medical condition [30] or less access to transplantation. A longer history of RRT was associated with less renal transplantation, less switch to facility-based HD and less time spent on PD, but increased proportion of time on home HD. In some studies, long distance to travel to the nearest renal centre was associated with increased home dialysis use, which was not the case in our work [3]. Nevertheless, long distance to travel was associated with a greater proportion of home dialysis time to total time, which may suggest that distance could affect patients’ decision to stay on home dialysis.
The strength of this study is its large population basis and the use of a methodology allowing for exploring different levels of variability in different outcomes. However, this study has certain limitations. The variations observed could be affected by variations in coding comorbidities. Coding rules are published in the REIN registry protocol and each region; research assistants help the nephrologists collect the data and perform the post hoc quality control analysis [12]. Because it was an observational study, interpreting the direction of some associations such as the number of nurses and the cause or consequence of less home dialysis use is cautioned. Finally, we cannot exclude unmeasured confounders that might explain additional variations.
In conclusion, our study shows that heterogeneity at the dialysis-network level and to a lesser extent the regional level regarding home dialysis uptake is only marginally explained by patient characteristics or residence and dialysis-network factors. One concrete consequence of this study will be the possibility for regional networks to compare themselves with each other and to readjust their policies. Our results also suggest that to increase home dialysis use in France, one should focus first on home dialysis uptake rather than time spent at home. We believe, like others, that financial incentives and a quality improvement programme should be implemented at the dialysis-network level to increase home dialysis use [2].
ACKNOWLEDGEMENTS
The authors thank all REIN registry participants, especially the nephrologists and professionals in charge of data collection and quality control. Dialysis units participating in the registry are listed in the REIN annual report (https://www.agence-biomedecine.fr/Les-chiffres-du-R-E-I-N).
CONFLICT OF INTEREST STATEMENT
The authors have no competing interests to declare that are relevant to the content of this article.


Comments