


Abstract
We investigated 10-year trends in deceased donor kidney quality expressed as the kidney donor risk index (KDRI) and subsequent effects on survival outcomes in a European transplant population.
Time trends in the crude and standardized KDRI between 2005 and 2015 by recipient age, sex, diabetic status and country were examined in 24 177 adult kidney transplant recipients in seven European countries. We determined 5-year patient and graft survival probabilities and the risk of death and graft loss by transplant cohort (Cohort 1: 2005–06, Cohort 2: 2007–08, Cohort 3: 2009–10) and KDRI quintile.
The median crude KDRI increased by 1.3% annually, from 1.31 [interquartile range (IQR) 1.08–1.63] in 2005 to 1.47 (IQR 1.16–1.90) in 2015. This increase, i.e. lower kidney quality, was driven predominantly by increases in donor age, hypertension and donation after circulatory death. With time, the gap between the median standardized KDRI in the youngest (18–44 years) and oldest (>65 years) recipients widened. There was no difference in the median standardized KDRI by recipient sex. The median standardized KDRI was highest in Austria, the Netherlands and the Basque Country (Spain). Within each transplant cohort, the 5-year patient and graft survival probability were higher for the lowest KDRIs. There was no difference in the patient and graft survival outcomes across transplant cohorts, however, over time the survival probabilities for the highest KDRIs improved.
The overall quality of deceased donor kidneys transplanted between 2005 and 2015 has decreased and varies between age groups and countries. Overall patient and graft outcomes remain unchanged.
KEY LEARNING POINTS
What is already known about this subject?
Deceased donor kidneys with higher kidney donor risk index (KDRI) scores have worse survival outcomes than those with lower KDRI scores.
To meet demands, older and more marginal kidneys are being used. It is not known if the increased use of marginal kidneys has resulted in worse transplant outcomes over time.
What this study adds?
Over a 10-year period, transplant recipients ˃45 years of age have received kidneys with increasingly higher KDRIs, i.e. worse quality.
These kidneys are increasingly coming from donors who are older and more likely to have a diagnosis of hypertension (HTN) and are retrieved from donors after circulatory death, though this varied between countries.
This has not translated to poorer 5-year kidney transplant outcomes.
What impact this may have on practice or policy?
As life expectancy in the general population increases and the prevalence of diabetes mellitus, HTN and obesity increases, it is likely that we will continue to see poorer-quality donor kidneys.
To avoid this translating into worse kidney transplant outcomes, the transplant community should focus on identifying therapies and/or preventative strategies aimed at improving kidney transplant outcomes despite these lower-quality allografts.
INTRODUCTION
In order to meet the demand for kidneys for transplantation, which continues to exceed the current supply [1, 2], an increasing number of marginal kidneys are being utilized [3, 4]. Marginal kidneys have been associated with worse graft survival outcomes [5]. The kidney donor risk index (KDRI), derived from 10 deceased donor factors, provides an estimate of how long a deceased donor kidney allograft can be expected to function relative to the ‘median’ deceased donor kidney retrieved in the USA in the previous calendar year [6]. The KDRI has now been validated in several European countries [7–9]. Lower KDRI scores represent a higher estimated graft survival time, whereas higher KDRI scores represent a lower estimated graft survival time [10]. A deceased kidney donor in 2017 with a standardized KDRI score of 1.5 equates to 1.5 times higher relative risk of allograft failure compared with the ‘median’ deceased donor kidney from 2016. Given that the KDRI is standardized to the median donor of the previous year, the reference group is changing on an annual basis and, as a consequence, a donor represented by a KDRI of 1.5 in 1 year may not be the same as a donor represented by a KDRI of 1.5 in previous years. By standardizing the KDRI over a number of years to the same reference donor, i.e. the median deceased donor in a chosen year, one has a quantitative measure with which to assess the quality of deceased donor kidneys in a given population and across populations over time.
Using data from kidney and transplant registries in seven European countries we investigated the trends in the quality of transplanted deceased donor kidneys between 2005 and 2015, expressed as KDRI scores and standardized to a reference KDRI score. We identified annual trends in standardized KDRI scores over a 10-year period by recipient sex, recipient age group, recipient diabetic status and country of transplantation. Furthermore, we assessed patient and graft survival outcomes by KDRI quintile over time.
MATERIALS AND METHODS
Data collection
Data from the European Renal Association–European Dialysis and Transplant Association (ERA-EDTA) Registry with additional data collection from nine individual kidney and transplant registries in seven countries were used: Austrian Dialysis and Transplant Registry, Eurotransplant, Danish Nephrology Registry, Scandiatransplant, Information unit about renal patients from the Basque Country, Dutch Transplant Foundation, Norwegian Renal Registry, Slovenian Renal Registry and the UK Transplant Registry held by NHS Blood and Transplant. The recipients included in the study were restricted to those ≥18 years of age at the time of the first kidney-only, ABO-compatible transplant performed during the period 1 January 2005–31 December 2015. No data were collected regarding deceased donors from whom kidneys were subsequently not recovered or discarded once recovered. All national and regional kidney registries contributing data to the ERA-EDTA Registry followed their national legislation regarding ethics committee approval.
Data analysis
Missing data
Overall, 80% of cases had complete donor details except for donor ethnicity and hepatitis C virus (HCV) status (Supplementary data, Table S1A and B). Where the donor ethnicity and HCV status were unavailable, we assumed that, in this European setting, the donor was Caucasian and HCV negative. Based on the differences between the complete cases and the cases with missing variables, it was concluded that with the exception of donor diabetes and hypertension (HTN) in Norway, the data were missing completely at random, therefore the missing variables were imputed in SAS software (SAS Insitute, Cary, NC, USA) using the multiple imputation procedure (proc mi). The donor variables included in the imputation model were donor age, height, weight, prior diagnosis of HTN, prior diagnosis of diabetes mellitus (DM), creatinine, cause of death and donor type [donation after circulatory death (DCD) or donation after brain death (DBD)]. Five imputed datasets were created. Log transformations were used for non-normally distributed data, which were then transformed back to their original form before the analysis [11]. Missing variables were imputed by the country, for example, only donor and recipient data from Austria was used to impute Austria’s missing data.
Evaluating time trends in the KDRI
Using the donor characteristics and the KDRI beta coefficients as determined by Rao et al. [6], we calculated the ‘donor-only’ KDRI for each individual donor (Box 1). We then determined the distribution of the crude KDRI for the years 2005, 2010 and 2015, overall and by recipient sex, recipient age group (18–44, 45–54, 55–64 and ≥65 years), recipient diabetic status and country. These data were presented as violin plots, which have the advantages of both box plots, thereby allowing the visualization of summary statistics, and density traces, thereby allowing visualization of the data distribution.
We examined for time trends in KDRI between 2005 and 2015. To have a meaningful comparison of the KDRI over time, a scaling factor was applied. In these analyses for all the years in question, we used the median KDRI from 2005 as the scaling factor, thereby giving the 2005 median KDRI of the whole group a score of 1. The same groups as for the distribution of the crude KDRI were examined, i.e. all countries/regions combined (overall and by recipient sex, recipient age group and recipient diabetic status) and time trends in the individual countries/regions. Time trends in the standardized KDRI were examined using Joinpoint regression [12]. The year was taken as the explanatory variable and the scaled median KDRI as the outcome. The average annual percentage change (AAPC) was computed using Poisson regression as provided by the Joinpoint regression programme [13].
Survival analysis
Kaplan–Meier and Cox regression were used to calculate 5-year patient and graft survival probabilities and the risk of death and graft loss, respectively, by transplant cohort and by KDRI. To allow for analysis of 5-year follow-up, the recipients were divided into three transplant cohorts: Cohort 1, 2005–06; Cohort 2, 2007–08; and Cohort 3, 2009–10. Thereafter the cohorts were further subdivided by KDRI quintiles, which had been standardized to the median 2005 KDRI. The KDRI quintiles were 0.45–<0.79; 0.79–<0.96; 0.96–<1.15; 1.15–<1.45; ≥1.45. The date of transplantation was taken as the starting point and the patients were followed until the event of interest. For patient survival, the event of interest was death. For graft failure, the events of interest were either a return to dialysis, retransplantation or death with a functioning allograft. Patients were censored for loss to follow-up and the end of the study period was set as 31 December 2015. In the adjusted analysis, we adjusted for recipient age at transplantation, recipient sex, primary kidney diagnosis, cold ischaemia time (CIT), human leukocyte antigen (HLA) mismatch score and country of transplantation.
Sensitivity analysis
A sensitivity analysis of complete cases, i.e. only cases where all donor variables except for donor HCV status and ethnicity were available, was performed. To account for the increasing number of DCD transplants over time, the crude and standardized KDRI scores for DBD transplants were calculated.
A two-tailed P-value <0.05 was considered statistically significant. Analyses were performed using SAS software version 9.4 and Joinpoint version 4.0.4 [14].
RESULTS
We included 24 177 recipients transplanted between 2005 and 2015. During this period the median recipient age rose from 53 years [interquartile range (IQR) 43.0–61.5] to 55 years (IQR 45.0–65.0) and the percentage of recipients with a diagnosis of DM rose from 12.5% to 17.0%. The median deceased kidney donor age rose from 50 years (IQR 38–59) in 2005 to 55 years (IQR 44–65) in 2015 (Table 1). The percentage of donors with a history of HTN (23–30%), DM (4–8%) and severe obesity [body mass index (BMI) >35 kg/m2; 4–7%] increased.
Deceased kidney donor details by year of transplatation for first kidney only transplants performed between 2005 and 2015 and the AAPC and 95% CI by donor factor for Austria, the Basque Country, Denmark, the Netherlands, Norway, Slovenia and the UK combined
| Year Donor features | 2005 | 2006 | 2007 | 2008 | 2009 | 2010 | 2011 | 2012 | 2013 | 2014 | 2015 | AAPC (95% CI) |
|---|---|---|---|---|---|---|---|---|---|---|---|---|
| Number | 1865 | 1837 | 1852 | 1927 | 2082 | 2204 | 2255 | 2417 | 2560 | 2593 | 2585 | 4.2 (3.5–4.9)* |
| Donor age (years), median (IQR) | 50 (38–59) | 50 (39–59) | 52 (39–60) | 51 (40–60) | 52 (41–61) | 53 (43–63) | 55 (43–64) | 55 (45–64) | 54 (43–65) | 55 (44–65) | 55 (44–65) | 1.1 (0.7–1.4)* |
| Donors with age <18 years, % | 6 | 5 | 6 | 5 | 5 | 4 | 4 | 3 | 3 | 3 | 4 | −6.3 (−9.1 to −3.5)* |
| Donors with age >50 years, % | 51 | 51 | 55 | 53 | 56 | 59 | 63 | 63 | 63 | 64 | 64 | 2.6 (1.9–3.3)* |
| Height (cm), median (IQR) | 170 (165–180) | 170 (165–180) | 172 (165–180) | 172 (165–180) | 170 (165–179) | 171 (165–180) | 170 (164–179) | 171 (165–179) | 171 (165–179) | 171 (165–179) | 171 (164–179) | 0.0 (−0.1–0.1) |
| Weight (kg), mean (SD) | 75 (16.2) | 76 (15.6) | 76 (16.5) | 76 (16.3) | 77 (16.7) | 78 (17.8) | 77 (17.6) | 78 (17.3) | 78 (18.3) | 78 (18.6) | 78 (18.5) | 0.4 (0.3–0.5)* |
| BMI >35 kg/m2, % | 4 | 4 | 5 | 4 | 6 | 5 | 5 | 6 | 7 | 8 | 7 | 6.8 (4.1–9.6)* |
| History of HCV (yes), % | 0.5 | 0.1 | 0.4 | 0.1 | 0.2 | 0.1 | 0.2 | 0.1 | 0.1 | 0.1 | 0.2 | −11.8 (−20.8 to −1.8)* |
| History of HTN (yes), % | 23 | 25 | 25 | 26 | 24 | 30 | 32 | 31 | 32 | 31 | 30 | 3.2 (1.7–4.8)* |
| History of DM (yes), % | 4 | 4 | 5 | 5 | 6 | 6 | 7 | 6 | 7 | 7 | 8 | 6.5 (4.7–8.4)* |
| Cause of death CVA, % | 65 | 64 | 64 | 60 | 62 | 65 | 63 | 61 | 57 | 60 | 56 | −1.2 (−1.9 to −0.4)* |
| Creatinine (mg/dL), median (IQR) | 0.9 (0.7–1.1) | 0.8 (0.7–1.1) | 0.8 (0.6–1.1) | 0.8 (0.6–1.1) | 0.8 (0.6–1.1) | 0.8 (0.6–1.0) | 0.8 (0.6–1.0) | 0.8 (0.6–1.1) | 0.8 (0.6–1.0) | 0.8 (0.6–1.0) | 0.8 (0.6–1.0) | −0.9 (−0.9 to −0.9)* |
| DCD status (yes), % | 19 | 20 | 23 | 28 | 29 | 29 | 33 | 36 | 38 | 34 | 37 | 6.4 (3.4–9.5)* |
The AAPC with a significance level of ˂0.05 is denoted by an asterisk (*). Data contain imputed values.
Trends in crude KDRI
For all countries combined, the median crude KDRI was 1.31 (IQR 1.08–1.63), 1.41 (IQR 1.13–1.81) and 1.47 (IQR 1.16–1.90) in 2005, 2010 and 2015, respectively (Figure 1, top left). The median crude KDRIs presented for all countries combined can be found in Figure 1 and Supplementary data, Table S2, and by individual country can be found in Supplementary data, Figure S1 and Table S2.
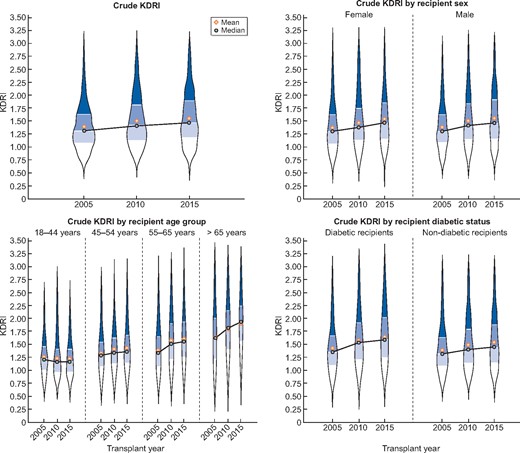
Violin plots of the crude KDRI for the transplant years 2005, 2010 and 2015 for all countries combined presented as overall (left upper panel), by recipient sex (right upper panel), by recipient age group (left lower panel) and by recipient diabetic status (right lower panel). Black circle indicates the median KDRI and the yellow diamond the mean KDRI.
Trends in standardized KDRI
When standardized to the median KDRI from the total group in 2005 one can objectively visualize annual changes in the ‘median donor’ based on 10 deceased donor factors. Between 2005 and 2015 this standardized median donor KDRI increased from 1.00 to 1.13, giving an AAPC of 1.3% [95% confidence interval (CI) 0.6–2.0; Figure 2A, Supplementary data, Table S3]. The standardized median donor KDRI increased for both female and male recipients by an AAPC of 1.5% (95% CI 1.0–2.0) and by 1.2% (95% CI 0.8–1.6), respectively, with no differences between the sexes (P = 0.851; Figure 2B). There appeared to be a trend towards a decline in the standardized median KDRI for recipients ages 18–44 years [AAPC −0.3% (95% CI −0.6–2.3)]. Over time, the gap between the standardized KDRI in the youngest and oldest recipients widened. The standardized median KDRI in 2015 for recipients ages 18–44 years was 0.89, whereas for recipients ≥65 years of age it was 1.48 (Figure 2C, Supplementary data, Table S3). Recipients with DM remained in receipt of lower-quality donor kidneys compared with recipients without DM throughout the 10-year period (P < 0.001), although the KDRI increased for both diabetic and non-diabetic recipient groups (Figure 2D, Supplementary data, Table S3).
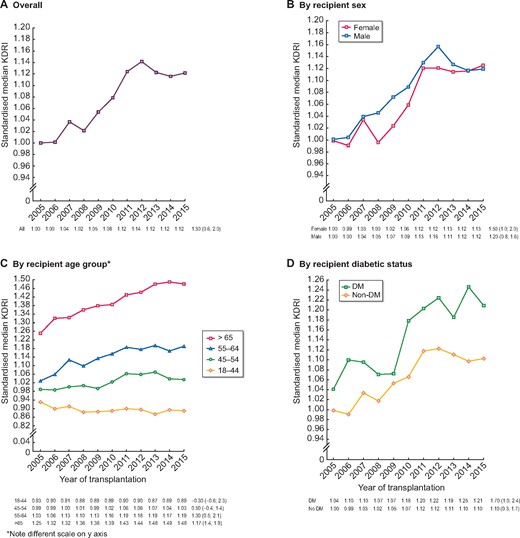
Standardized median KDRI and AAPC (95% CI) during the years 2005–15 for (A) all countries/regions combined and by (B) recipient sex, (C) recipient age group and (D) recipient diabetic status. The KDRI is scaled relative to the median kidney donor in 2005. AAPCs with a significance level <0.05 are denoted by an asterisk (*).
Overall Austria, the Basque Country (Spain) and the Netherlands had higher annual standardized median KDRIs than Norway and Slovenia (Figure 3, Supplementary data, Table S3). Austria, the Basque Country and the Netherlands continued to have higher-than-average standardized KDRIs when recipients were stratified by older age (Supplementary data, Figure S2). The driving factors behind these differences varied by country (Table 2). The high standardized KDRI in Austria, the Basque Country and the Netherlands was mainly driven by a higher proportion of deceased donors >50 years of age and donors with a diagnosis of DM. In addition, within the Netherlands and the UK almost 50% of donors were DCD donors, while they only made up 5% of donors in Norway and 0% of donors in Slovenia and Denmark.
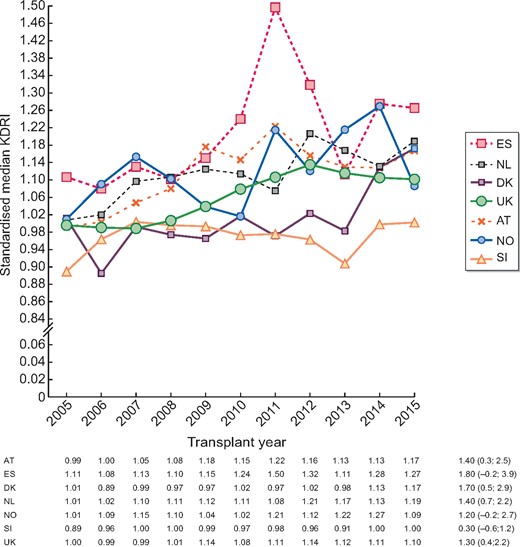
Standardized median KDRI and AAPC (95% CI) during the years 2005–15 by country/region. The KDRI is scaled relative to the median kidney donor in 2005 for all countries combined.
Deceased donor risk factors as presented in the KDRI equation by country/region and for the years 2005, 2010 and 2015
| Factors | Transplantation year | Austria | The Basque Country | Denmark | The Netherlands | Norway | Slovenia | UK |
|---|---|---|---|---|---|---|---|---|
| Recipients, n | 2005 | 237 | 102 | 91 | 335 | 104 | 30 | 956 |
| Donors, n | 2010 | 224 | 101 | 110 | 308 | 136 | 53 | 1259 |
| 2015 | 218 | 104 | 126 | 355 | 145 | 54 | 1573 | |
| Donor age (years), median (IQR) | 2005 | 51 (42–61) | 55 (43–65) | 53 (44–60) | 50 (37–58) | 55 (41–60.7) | 42 (23–49) | 49 (37–57) |
| 2010 | 56 (45–67) | 62 (46–70) | 51 (44–64) | 55 (46–62) | 55 (43.6–63) | 48 (34–54) | 52 (41–62) | |
| 2015 | 57 (49–66) | 62 (48–72) | 58 (44–66) | 57 (49–66) | 55 (37–68) | 53 (46–59) | 54 (43–64) | |
| Donors <18 years of age, % | 2005 | 5 | 2 | 6 | 8 | 6 | 23 | 6 |
| 2010 | 3 | 1 | 4 | 5 | 4 | 15 | 4 | |
| 2015 | 5 | 1 | 6 | 2 | 6 | 4 | 4 | |
| Donors >50 years of age, % | 2005 | 54 | 66 | 64 | 52 | 63 | 23 | 48 |
| 2010 | 68 | 67 | 56 | 65 | 62 | 45 | 56 | |
| 2015 | 70 | 70 | 64 | 73 | 61 | 61 | 61 | |
| Height (cm), median (IQR) | 2005 | 175 (168–180) | 165 (160–175) | 170 (165–180) | 174 (168–180) | 175 (165–180) | 170 (165–175) | 170 (163–178) |
| 2010 | 170 (165–180) | 168 (161–175) | 175 (168–180) | 175 (167–180) | 175 (170–180) | 170 (167–178) | 170 (163–178) | |
| 2015 | 172 (165–180) | 170 (160–175) | 172 (165–180) | 173 (168–180) | 171 (165–180) | 175 (165–180) | 171 (163–178) | |
| Weight (kg), mean (SD) | 2005 | 80 (16) | 73 (13) | 75 (17) | 74 (15) | 80 (21) | 69 (23) | 74 (16) |
| 2010 | 76 (16) | 78 (11) | 76 (16) | 78 (18) | 78 (19) | 75 (13) | 78 (19) | |
| 2015 | 78 (20) | 74 (13) | 76 (18) | 78 (18) | 74 (17) | 79 (14) | 78 (19) | |
| Donor diabetes, % | 2005 | 3 | 3 | 0 | 6 | 8 | 7 | 4 |
| 2010 | 8 | 9 | 4 | 5 | 4 | 0 | 6 | |
| 2015 | 12 | 12 | 2 | 9 | 3 | 9 | 8 | |
| Donor HTN, % | 2005 | 33 | 39 | 27 | 3 | 25 | 20 | 20 |
| 2010 | 36 | 33 | 31 | 30 | 35 | 38 | 29 | |
| 2015 | 41 | 35 | 33 | 29 | 27 | 30 | 28 | |
| Donor CVA, % | 2005 | 60 | 56 | 75 | 57 | 54 | 87 | 68 |
| 2010 | 68 | 70 | 81 | 61 | 61 | 83 | 63 | |
| 2015 | 68 | 65 | 63 | 49 | 67 | 52 | 54 | |
| Donor creatinine (mg/dL), median (IQR) | 2005 | 0.90 (0.70–1.12) | 0.80 (0.60–1.00) | 0.81 (0.63–0.97) | 0.86 (0.67–1.05) | 0.78 (0.66–0.88) | 0.74 (0.64–0.90) | 0.92 (0.74–1.15) |
| 2010 | 0.80 (0.64–1.03) | 0.74 (0.56–0.90) | 0.68 (0.51–0.93) | 0.77 (0.58–0.99) | 0.73 (0.55–0.90) | 0.90 (0.64–1.10) | 0.83 (0.66–1.07) | |
| 2015 | 0.90 (0.68–1.20) | 0.70 (0.58–0.87) | 0.72 (0.59–1.01) | 0.75 (0.59–0.88) | 0.75 (0.58–1.02) | 0.89 (0.70–1.10) | 0.76 (0.59–1.02) | |
| DCD donor, % | 2005 | 2 | 0 | 0 | 50 | 0 | 0 | 18 |
| 2010 | 2 | 2 | 0 | 37 | 0 | 0 | 40 | |
| 2015 | 11 | 21 | 0 | 55 | 5 | 0 | 45 |
Survival analysis was performed on 11 767 first transplant recipients transplanted between 2005 and 2010. Demographic data are given in Table 3, and Figure 4 presents the unadjusted patient and graft survival curves by time cohort and KDRI quintile. There was no change in the 5-year patient and graft survival probabilities between the time cohorts. Within each time cohort, patient and graft survival was higher at lower KDRIs. Over time there appeared to be a narrowing in the difference in the 5-year survival probabilities between the two highest KDRI quintiles due to an improvement in the outcomes from the highest KDRI category.
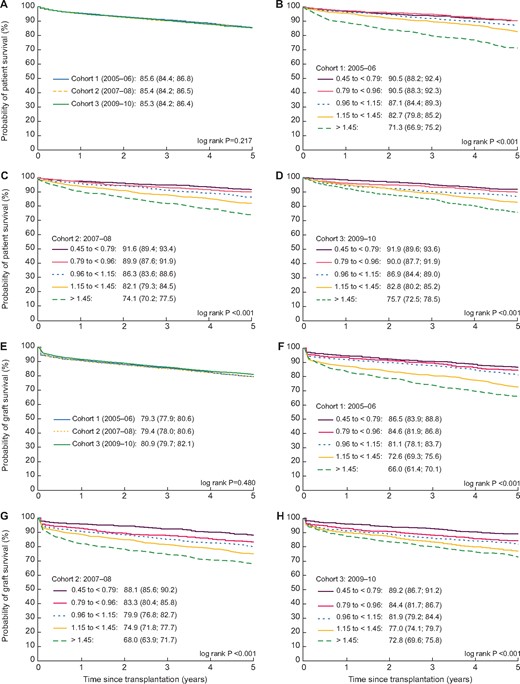
Five-year unadjusted patient survival curves for patients ≥18 years of age receiving their first deceased donor kidney-only transplant by (A) time cohort during 2005 and 2010 and by KDRI quintiles between (B) 2005 and 2006, (C) 2007 and 2008 and (D) 2009 and 2010 in all countries combined and 5-year unadjusted graft survival curves by (E) time cohort during 2005 and 2010 and by KDRI quintiles between (F) 2005 and 2006, (G) 2007 and 2008 and (H) 2009 and 2010 for all countries/regions combined.
Baseline characteristics of first kidney-only transplant recipients by transplant cohort: Cohort 1, transplanted during 2005–06; Cohort 2, transplanted during 2007–08; Cohort 3, transplanted during 2009–10
| Characteristics | 2005–06 | 2007–08 | 2009–10 | % missing |
|---|---|---|---|---|
| Number | 3702 | 3779 | 4286 | |
| Male, % | 62 | 63 | 63 | 0 |
| Age at transplantation (years), median (IQR) | 52 (42–61) | 52 (41–61) | 55 (44–63) | 0 |
| Dialysis time (years), median (IQR) | 3 (2–4) | 3 (2–5) | 3 (2–5) | 0 |
| Primary kidney disease, % | ||||
| DM types I and II | 10 | 10 | 12 | – |
| HTN/renovascular disease | 11 | 12 | 13 | – |
| Glomerulonephritis/sclerosis | 21 | 20 | 19 | – |
| Other | 26 | 26 | 24 | – |
| Missing/unknown | 31 | 32 | 32 | 32 |
| Initial KRT modality, % | ||||
| Dialysis | 79 | 81 | 81 | – |
| Kidney transplant | 12 | 15 | 18 | – |
| Missing/unknown | 9 | 4 | 0.7 | 4 |
| CIT (hours), median (IQR) | 17 (14–21) | 16 (13–20) | 16 (12–19) | 13 |
| Number of mismatches at HLA-A, B, DR | 0.5 | |||
| 0 | 12 | 12 | 11 | – |
| 1 | 8 | 6 | 5 | – |
| 2 | 28 | 22 | 21 | – |
| 3 | 32 | 35 | 37 | – |
| 4 | 16 | 20 | 20 | – |
| 5 | 4 | 4 | 4.8 | – |
| 6 | 1 | 1 | 1.5 | – |
| Panel reactive antibodies, % | 58 | |||
| 0 | 78 | 78 | 77 | – |
| >0–10 | 5 | 4 | 5 | – |
| 10–79 | 8 | 9 | 11 | – |
| >79 | 2 | 3 | 2 | – |
There was no difference in the unadjusted and adjusted risk of death across transplant cohorts [adjusted hazard ratio (aHR) 1.19 (95% CI 0.92–1.54) for 2007–08 and aHR 1.17 (95% CI 0.74–1.83) for 2009–10 compared with 2005–06; Figure 5]. In addition, there was no difference in the unadjusted and adjusted risk of graft failure across transplant cohorts [aHR 1.22 (95% CI 0.98–1.50) for 2007–08, aHR 1.22 (95% CI 0.84–1.79) for 2009–10 compared with 2005–06; Figure 5]. The risk of death or graft loss in patients transplanted with lower KDRI (i.e. better quality) allografts was lower, however, this effect was reduced when adjusting for recipient and transplant factors (Supplementary data, Figure S3).

Five-year risk and 95% CI of (A) unadjusted and (B) adjusted death and 5-year risk of (A) unadjusted and (B) adjusted graft failure by time cohort (2005–06, 2007–08, 2009–10) for all countries/regions combined. Adjustments made for recipient age at transplantation, recipient sex, primary kidney disease, CIT, HLA mismatch score and the country of transplantation.

Sensitivity analysis
Complete case analysis yielded similar results to those obtained with the imputed dataset (Supplementary data, Tables S2–S4). Analysis of only DBD kidneys revealed slightly lower KDRI scores for each time point, but the trend of increasing KDRI scores over time remained (Supplementary data, Tables S2 and S3).
DISCUSSION
We investigated trends in the quality of deceased donor kidneys, expressed as a standardized KDRI, transplanted between 2005 and 2015 in seven European countries and the effects of these trends on survival outcomes. During this 10-year period the overall quality of deceased donor kidneys decreased for every subgroup except for recipients 18–44 years of age. The decline in the overall kidney quality was evident as an increase in the standardized KDRI of ∼1.3%/year, which is in line with changes seen in the USA [10]. The factors driving these temporal changes were predominantly the increased use of older deceased donors, donors with a prior diagnosis of HTN or DM and, for the Netherlands and the UK, the use of DCD donors. As the use of donors with these risk factors varied between countries, we saw that the median standardized KDRI varied between countries. In countries such as the Netherlands and the UK, where in 2015 almost 50% of deceased donors were DCD donors, the standardized KDRI was consistently higher than in Norway, where only 5% of deceased donors were DCD donors. Even with the exclusion of DCD kidneys, both the crude and standardized KDRI rose over time. Five-year patient and graft survival probabilities remained unchanged despite the decrease in the overall quality of deceased donor kidneys over time. This could be driven by overall improvements in recipient health, transplantation procedures and changes in immunosuppressive regimens. Alternatively, it is possible that the quality of deceased donor kidneys does not negatively affect transplantation outcomes in the medium term (of 5 years), but rather in the long term.
There are several factors that may drive the decline in the quality of deceased donor kidneys over time and may vary across countries; for example, the demand for deceased donor organ transplantation in terms of the number of patients commencing kidney replacement therapy (KRT), the number of patients listed on the transplant waiting list and the strength of the living donor transplant programme. It may be that the reduction in the quality of transplanted kidneys, by means of accepting more marginal deceased donors, is an attempt to counterbalance long waiting times faced by potential transplant recipients. Second, the duration and success of the use of marginal donors within a country is likely to affect the future number of these donors. Additionally, the overall organizational structure of a country’s transplantation programme, down to who is responsible for organ procurement, may play a contributory role [15]. Finally, intercountry differences in KDRI could be influenced by background risk factors within the general population. Within all these countries the prevalence of DM, HTN and obesity within the general population varies [16], therefore the percentage of potential donors within each country with these features will vary. The increasing prevalence of these diseases [17–19] may well explain in part the trend towards increasing KDRIs.
This study has shown that the poorest-quality kidneys are being transplanted into the oldest recipients, in keeping with a single-centre German study [9]. As we demonstrated, as the age of the recipient increases, the median standardized KDRI increases, whereas with time, the youngest recipients receive ever better-quality kidneys. It is clear that longevity matching, and therefore utility, is appropriately occurring. The distinction between countries with the better- and worse-quality kidneys continued, even when stratified by recipient age group, thereby disputing the idea that kidney quality within a country is driven predominantly by recipient qualities.
Despite the decline in the quality of donor kidneys over the past 10 years, patient and graft survival remained unchanged. Several factors may have contributed to improving both recipient and graft survival, potentially counterbalancing the effects of the decline in the quality of donor kidneys. The risk of recipient death can be decreased, for example, by reducing cardiovascular risk factors. Ceretta et al. [20] demonstrated that between 2005 and 2014 the proportion of Europeans commencing KRT with cardiovascular disease as a comorbidity declined. Furthermore, Boenink et al. [21] recently showed that the excess mortality risk in Europeans commencing KRT between 2002 and 2015 decreased in relation to the improved survival in the general population, in other words, the factors resulting in improved KRT outcomes are not limited to overall improvements in the health of the general population. It may be that overall improvements in the relative health of the potential kidney transplant recipient may be playing a role in counterbalancing the effects of the higher KDRI transplant, although this remains speculative and to date there is no evidence that individuals are being transplanted in a state of relative improved health. In addition to potential improvement in pre-transplantation health, there is an increased emphasis from transplant groups on the post-transplant control of blood pressure and cardiovascular risk management [22], although again, whether this has translated to a decline in post-transplantation cardiovascular risk is unclear. Studies specifically assessing trends in the pre-transplantation health of European transplant recipients are needed to determine what is driving this apparent counterbalance in survival outcomes.
One of the factors driving both the increase and country difference in the median standardized KDRI over time was the use of DCD allografts, although it should be emphasized that both the crude and standardized KDRI rose over time even with the exclusion of DCD kidneys. The legal utilization of DCD donors and the policies relating to their procurement varies considerably throughout Europe [23]. Within the Netherlands and the UK, DCD donors now make up ∼50% and 42%, respectively, of the deceased donors [24, 25]. Although DCD allografts are typically thought to have worse outcomes than DBD allografts, recent evidence is bringing this into question [26]. A Dutch study reported 5-year death-censored graft failure for recipients <65 years of age of DBD and DCD allografts from donors <65 years of age of 85.9% (95% CI 84.1–87.6) and 82.6% (95% CI 80.2–84.9), respectively [27]. Similarly, a UK study found equivalent graft outcomes between older controlled DCD and DBD allografts in the same age group [28], although controlled DCD allografts performed less well than DBD allografts with increasing donor and recipient ages, longer CITs, repeat transplantation and poor HLA matches [29]. Perhaps given the survival improvement from DCD allografts with time, the higher KDRIs seen as a result of the DCD allografts is no longer a true reflection of donor quality and hence survival is unchanged despite the higher KDRI scores.
Unlike the findings in our study, the median KDRI score in the USA has remained fairly low and static from 2005 to 2015 at ∼1.24 [30]. Whereas in 2015, 55% of European deceased kidney donors died of a cerebrovascular accident (CVA), 64% were ˃50 years of age and 37% were donors after cardiac death, in the USA only 25% of kidney donors died of a CVA, 25% were ˃50 years of age and only 18% were DCD donors [30]. A recent study by Aubert et al. [31] demonstrated an almost double discard rate in the USA compared with France. A lower US discard rate similar to that of France would have resulted in an additional 132 445 allograft life-years. Despite the differences in the distribution of the KDRI score, the 5-year US and European graft survival outcomes remain similar at ∼75–85% [30, 32].
The main strength of this study is its ability to compare the trends in the quality of deceased donor kidneys, by means of the standardized KDRI, across seven European countries within various subgroups over 10 years. The KDRI is an easily applicable scoring system that allows for standardization and comparison of deceased donor allografts between studies and over time. However, in the future, in light of improved outcomes of DCD allografts, the inclusion or weighting of DCD donors in the KDRI score may need to be reconsidered. The main limitation of this study is the lack of information regarding organ discard rates and the corresponding KDRIs of these organs, thus we cannot form a complete picture of the potential donor kidneys available over this time period. Correlation with pre-implantation biopsy findings would have been useful, but this information was not available. To have a clearer picture we have only included first transplant recipients and thus we cannot comment on the quality of the donor kidney or outcomes of subsequent transplantations. The findings of this study are based on transplants occurring in seven European countries and thus we may not be able to generalize these results to the rest of Europe. The relative sizes of the countries/regions in this study are reflected in the findings, i.e. the overrepresentation of the UK and large swings in the country-specific results from smaller countries/regions. Furthermore, throughout most of Europe, data on ethnicity that are included in the KDRI score are not collected. Given that the prevalence of ‘Black or African American’ race in the Eurotransplant zone and the UK is low (1% in the UK [33]), we assumed all donors were Caucasian. This may have slightly underestimated the KDRI score.
CONCLUSION
Over the past 10 years the quality of deceased donor kidneys as expressed by standardized KDRI has decreased across all seven European countries examined by this study, although this did not translate to worse outcomes. A difference in the median kidney quality between countries and between the age groups was seen. As life expectancy in the general population increases and the prevalence of DM, HTN and obesity increases, it is likely that we will continue to see poorer-quality donor kidneys. To avoid this translating into worse transplant outcomes, the transplant community should focus on identifying therapies and/or preventative strategies aimed at improving transplant outcomes despite these lower-quality allografts. This approach could further expand the pool of transplantable organs.
ACKNOWLEDGEMENTS
We would like to thank the patients and the staff of the dialysis and transplant units for contributing the data via their national and regional kidney registries. Furthermore, we gratefully acknowledge the following registries and persons for their contribution of data [Austrian Dialysis and Transplant Registry, Basque Country Registry (J. Aranzabal, M. Rodrigo and I. Moina), Danish Nephrology Registry (J.G. Heaf), Norwegian Renal Registry (A. Åsberg)] and the other ERA-EDTA registry committee members not mentioned above for their advice in the analysis and the drafting of this article: A. Więcek, F. J. Caskey, C. Couchoud, M. Evans, P. Finne, J. W. Groothoff, J. Harambat, J. G. Heaf, F. Jarraya and I. Rychlik; and A. Kramer in the AMC Registry office for data collection and management. We would also like to thank the following transplant registries for supplying data for use in this study: Nederlandse Orgaantransplantatie Registratie, Dutch Transplant Foundation (Cynthia Konijn-Janssen), UK transplant registry held by NHS Blood and Transplant (Lisa Mumford) and Scandiatransplant.
SUPPLEMENTARY DATA
Supplementary data are available at ndt online.
FUNDING
The ERA-EDTA Registry is funded by the ERA-EDTA. This article was written on behalf of the ERA-EDTA Registry, which is an official body of the ERA-EDTA. M.P. is currently funded by the National Institute for Health Research.
CONFLICT OF INTEREST STATEMENT
None declared.
DATA AVAILABILITY STATEMENT
The data underlying this article cannot be shared with any third party because the national and regional registries that provided data to the ERA-EDTA Registry remain the owners of the data.
Box 1. KDRI calculation, donor factors and model coefficients as described by Rao et al. [10]
KDRIexp = exp −0.0194 × I[age < 18 years] × [age − 18 years] + 0.0128 × [age − 40 years] + 0.0107 × I[age > 50 years] × [age − 50 years] + 0.179 × I[race = African American] + 0.126 × I[hypertensive] + 0.130 × I[diabetes] + 0.220 × [SCr − 1 mg/dL] − 0.209 × I[SCr > 1.5 mg/dL] × [SCr − 1.5 mg/dL] + 0.0881 × I[cause of death = CVA] − 0.0464 × [/10] − 0.0199 × I[weight < 80 kg] × [(weight − 80 kg)/5] + 0.133 × I[donation after cardiac death] + 0.240 × I[hepatitis C], where I = 1 if the condition is true and I = 0 if the condition is false.
| Donor characteristic | Applies to: | KDRI coefficient (‘Beta’) | KDRI ‘XBeta’ component |
|---|---|---|---|
| Age (integer years) | All donors | 0.0128 | 0.0128* (age-40) |
| Donors <18 years of age | −0.0194 | −0.0194* (age-18) | |
| Donors >50 years of age | 0.0107 | 0.0107* (age-50) | |
| Height (cm) | All donors | −0.0464 | −0.0464* (hgt-170)/10 |
| Weight (kg) | All donors with weight <80 kg | −0.0199 | −0.0199* (wgt-80)/5 |
| Ethnicity | African American donors | 0.1790 | 0.1790 |
| History of HTN | Hypertensive donors | 0.1260 | 0.1260 |
| History of DM | Diabetic donors | 0.1300 | 0.1300 |
| Cause of death | Donors with cause of death as a CVA | 0.0881 | 0.0881 |
| All donors | 0.2200 | 0.2200* (creat-1.0) | |
| Serum creatinine | Donors with creatinine >1.5 mg/dL | −0.2090 | −0.2090* (creat-1.5) |
| Hepatitis C status | Hepatitis C positive donors | 0.2400 | 0.2400 |
| Donation after circulatory status | DCD donors | 0.1330 | 0.1330 |


Comments