


Abstract
Monitoring of fluid, body composition and nutritional changes is important in clinical nephrology. The Body Composition Monitor (BCM; Fresenius Medical Care, Bad Homburg, Germany) measures whole-body bioimpedance and determines extracellular and intracellular resistance by using the Cole-model to estimate total body water (TBW-BCM) and its partition into extracellular and intracellular water. Both can then be used to define body composition and separate body weight into lean tissue mass, adipose tissue mass, and fluid overload. Urea kinetic modeling (UKM) allows the estimation of dialysis dose (double-pooled Kt/V), urea distribution volume (V-UKM) and dietary protein intake. We studied the bias between estimated V-UKM to anthropometric and measured TBW-BCM (Vant, TBW-BCM).
Pre-hemodialysis (HD), electrodes for the BCM assessments were placed on the non-arteriovenous access arm and ipsilateral leg, respectively, with the patient in a supine position. Vant was calculated using the Watson equation. In addition to these assessments we entered the specified values from the most recent urea kinetic modeling (UKM) treatment into the online solute-solver calculator (http://ureakinetics.org). We chose a baseline ratio of modeled/anthropometric volume of 0.6 to 1.3 L to exclude values with data entry errors and/or UKM sampling errors. We calculated the post HD TBW-BCM by subtracting the intradialytic weight loss and adjusted these estimates by the differences in post HD weight between sessions to make both estimates comparable. We depicted the comparison between the estimated V-UKM versus the TBW-BCM in a scatter- and Bland-Altman (BA) plot (Figure). For the purpose of error investigation we studied the computed bias (V-UKM minus TBW-BCM) as a function of body mass index (BMI) and stray capacitance (td) in a BA plot. We then calculated the difference between Vant and V-UKM and illustrated the comparison in a scatter and BA plot.
In a cross-sectional design, we studied 161 stable prevalent HD patients (61.3±14.7 years, 98 (60.9%) males, height of 167.5±10.7 cm) prior to their treatment. The regression plot showed slight agreement (R2= 0.69) and the Bland-Altman plot no systematic trends or proportional error in the main analysis (Figure 1a and b). Neither BMI or td explained bias and variance in the bias between both estimates. Vant and V-UKM plots showed agreement (R2 of 0.68) with a mean bias of -2.3±5.1 and no proportional error.
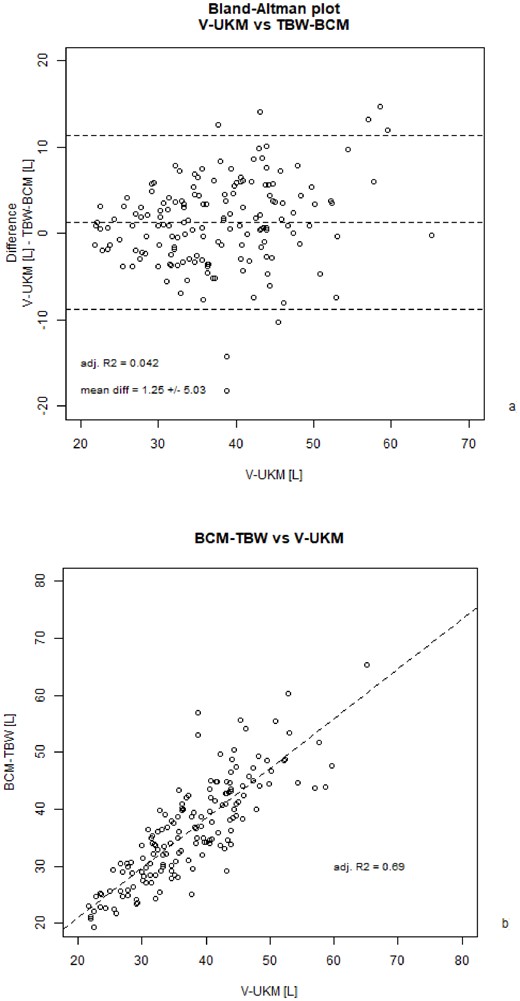
Comparison of urea distribution volume (V-UKM) to total body water (TBW-BCM) from the body composition monitor (BCM) in a) a Bland-Altman plot and b) a scatter plot.
Both TBW-BCM and the V-UKM as the “bronze standard” of TBW estimation seemed to agree reasonably well. Neither body composition measurement or kinetic modeling approach showed any significant influence on the accuracy and precision of the estimate. According to BCM availability, estimated V-UKM or measured TBW-BCM could be used alternatively in practice to support clinical decision when pharmacokinetic considerations are concerned.


Comments