


Abstract
Chronic kidney disease (CKD) increases cardiovascular risk and mortality. Renal fibrosis plays a major role in the progression of CKD but, to date, histology remains the gold standard to assess fibrosis. Non-invasive techniques are needed to assess renal parenchymal impairment and to perform the longitudinal evaluation of renal structure. Thus we evaluated renal isotopic imaging by single-photon emission computed tomography/computed tomography (SPECT/CT) with technetium-99m (99mTc)–dimercaptosuccinic acid (DMSA) to monitor renal impairment during renal insufficiency in rats.
Renal insufficiency was induced by an adenine-rich diet (ARD) at 0.25 and 0.5% for 28 days. Renal dysfunction was evaluated by assaying biochemical markers and renal histology. Renal parenchymal impairment was assessed by SPECT/CT isotopic imaging with 99mTc-DMSA on Days 0, 7, 14, 21, 28, 35 and 49.
Compared with controls, ARD rats developed renal dysfunction characterized by increased serum creatinine and blood urea nitrogen, fibrosis and tubulointerstitial damage in the kidneys, with a dose-dependent effect of the adenine concentration. 99mTc-DMSA SPECT-CT imaging showed a significant decrease in renal uptake over time in 0.25 and 0.5% ARD rats compared with control rats (P = 0.011 and P = 0.0004, respectively). 99mTc-DMSA uptake on Day 28 was significantly inversely correlated with Sirius red staining evaluated on Day 49 (r = 0.89, P < 0.0001, R2 = 0.67).
99mTc-DMSA renal scintigraphy allows a longitudinal follow-up of risk of renal fibrosis in rats. We found that the reduction of renal parenchyma in ARD rats is inversely proportional to newly formed fibrous tissue in the kidney. Our results suggest that 99mTc-DMSA renal scintigraphy may be a useful non-invasive prognostic marker of the development of renal fibrosis in animals and should be tested in humans.

What is already known about this subject?
Renal fibrosis plays a major role in the progression of chronic kidney disease (CKD) but, to date, histology remains the gold standard to assess fibrosis. Non-invasive techniques are needed for the assessment of renal parenchymal impairment and to perform longitudinal evaluation of renal structure in pre-clinical and clinical research. We evaluated renal isotopic imaging by single-photon emission computed tomography/computed tomography (SPECT/CT) with technetium-99m (99mTc)–dimercaptosuccinic acid (DMSA) to monitor renal impairment during CKD induced by an adenine-rich diet (ARD) in rats.
What this study adds?
Our work reports that quantification of 99mTc-DMSA uptake assessed by SPECT/CT is inversely correlated to kidney fibrosis in ARD rats, allowing an early prediction of the development of fibrosis, while serum creatinine was not correlated with kidney fibrosis.
What impact this may have on practice or policy?
SPECT/CT with 99mTc-DMSA allows a longitudinal follow-up of renal fibrosis in rats and could be a useful non-invasive predictive tool of the development of renal fibrosis in animals and patients.
INTRODUCTION
Chronic kidney disease (CKD) increases cardiovascular risk and mortality and fibrosis is a tissue damage constantly observed in CKD. Kidney fibrosis results from maladaptive repair capacities after kidney damage [1] and plays a major role in the progression of CKD. The extent of fibrosis poorly correlates with renal dysfunction measured by glomerular filtration rate (GFR), especially due to hyperfiltration associated with the loss of nephron mass, which may underestimate the kidney injury [2]. However, early measurement of fibrosis has been reported as a predictor of disease progression [3]. It is thus crucial to evaluate early the extent of renal parenchymal damage. However, biopsies remain the only available means to specifically assess the extent of kidney fibrosis in clinical situations and post-mortem histology is the gold standard in pre-clinical research. Thus non-invasive approaches allowing repeated evaluations of the renal structure are still needed to characterize disease progression.
Single-photon emission computed tomography/computed tomography (SPECT) imaging of technetium-99m (99mTc)–dimercaptosuccinic acid (DMSA) renal uptake is a well-known imaging procedure performed to detect cortical abnormalities mainly related to urinary tract infection in children [4]. In pre-clinical studies, 99mTc-DMSA scintigraphy has been used as a valuable tool to evaluate parenchymal injury and is inversely correlated with markers of kidney function such as serum urea and creatinine and histopathological changes such as tubular and glomerular lesions [5]. However, a link between 99mTc-DMSA renal scintigraphy and fibrosis has not been reported so far. Thus we aimed to evaluate 99mTc-DMSA SPECT imaging to longitudinally monitor renal impairment appearance during renal insufficiency in rats induced by an adenine-rich diet (ARD).
MATERIALS AND METHODS
Protection of animals in research
All procedures using animals were approved by the institution’s Animal Care and Use Committee (Project 15636-2018122710383826 VI, CE14 Aix-Marseille Université) and were conducted according to the European Union Directive 2010/63 and to the National Institutes of Health Guide for the Care and Use of Laboratory Animals.
CKD model
Rat experiments were conducted in 5-week-old male Sprague-Dawley rats (Envigo, Indianapolis, IN, USA). The animals were housed two per cage with enrichment and free access to food and water.
CKD was induced by subjecting 26 rats to an ARD at 0.25 and 0.5% [6] (Safe Nutrition, Augy, France) for 28 days (n = 7 per ARD group, compared with 12 control rats). Food and water were provided ad libitum. We performed a longitudinal study by assessing the same animals during the entire study. The study protocol is summarized in Figure 1.
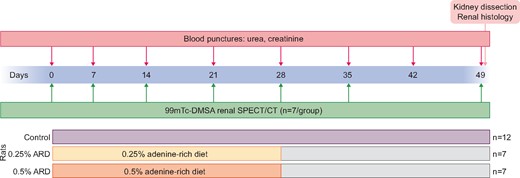
Experimental protocol.
Blood sampling
The severity of CKD was assessed using classical biochemical markers (serum urea, creatinine). Blood samples were collected on Days 0, 7, 14, 21, 28, 42 and 49 by blood puncture after catheterization of the caudal vein under anaesthesia with 3% sevoflurane. The serum was extracted after centrifugation (2500 g, 15 min, 21°C).
99mTc-DMSA SPECT-CT imaging
DMSA was purchased from Currium(Paris, France) and radiolabeled with fresh 99mTcO pertechnetate (Tekcis, Currium) according to the manufacturer’s instructions. The radiochemical purity of 99mTc-DMSA was confirmed to be at least 95% by thin-layer chromatography.
Renal functional parenchyma was assessed by SPECT-CT on Days 0, 7, 14, 21, 28, 35 and 49 after injection of 20 MBq (100 µL) of 99mTc-DMSA through the tail vein under anaesthesia (isoflurane 3%, Iso-vet, Véto Santé, Lempdes, France) in 21 rats (n = 7 per group). Two hours after injection, SPECT/CT acquisition was performed under anaesthesia with isoflurane 3% using a NanoSPECT/CTPLUS camera (Bioscan, Santa Barbara, CA, USA) and Nucline version 1.02 software (Mediso, Budapest, Hungary).
The analysis of SPECT/CT images was segmented, using CT scan on the kidneys only; the urinary pelvis was excluded. The activity of both kidneys was measured in megabecquerel in the anatomical three-dimensional region of interest with CT using VivoQuant version 3.5 software (Invicro, Boston, MA, USA). 99mTc-DMSA activity detected in the kidneys was expressed as a percentage of the total injected activity (%IA). The evolution of 99mTc-DMSA uptake was expressed as the percentage of the Day 0 value for each rat. Kidney size was measured by CT on Day 49 and expressed as the mean of the two sizes of the longest kidney axes.
Renal histology
At the end of the experiments, on Day 49, the rats were sacrificed and the kidneys were dissected, harvested and fixed in 4% formaldehyde for 48 h then kept in 70% ethanol before inclusion in paraffin. Anatomical pathology was performed after haematoxylin–eosin staining (H&E Staining kit ab245880, Abcam, Cambridge, UK) using optical microscopy (Ellipse Ni-E, Nikon, Tokyo, Japan). The tubular lesions were scored with a tubular injury score, as previously described by Wan et al. [7], by two experienced physicians blinded to the intervention. The renal fibrosis was quantified on full histological section after Sirius red staining (Direct Red 80 powder 365548-5 G, Sigma-Aldrich, St. Louis, MO, USA) using optical microscopy and semi-quantitative quantification (ImageJ version 1.51) [8]. A semi-quantitative score of interstitial fibrosis (IF)/tubular atrophy (TA) inspired from the Banff 2017 classification [9] was also provided by two experienced physicians blinded to the experiment: 0, IF/tubular injury <5% of total histological section; 1, 5–25%; 2, 25–50% and 3, >50%.
Statistical analyses
Mean comparisons were done at each time point by Mann–Whitney test and Kruskal–Wallis test (for repeated values over time) and calculation of correlation by Spearman test and linear regression. We evaluated correlations between renal fibrosis (by Sirius red staining quantification and IF/TA score) on Day 49 and %IA at each time point and between renal fibrosis on Day 49 and biomarkers (urea and creatinine) at each time point. All tests were non-parametric and two-tailed. Statistical analysis was done using Excel (Microsoft, Redmond, WA, USA) and GraphPad Prism version 7.0 (GraphPad Software, San Diego, Ca, USA) software. P-values ˂0.05 were considered significant.
RESULTS
The initial average weight of the rats was 190.2 ± 13.9 g. On Day 49, the average weight of the rats was 342.9 ± 14.1 g in the control group versus 322.4 ± 22.8 g in the 0.25% ARD group (P = 0.25) and 292.6 ± 27.1 g in the 0.5% ARD group (P = 0.0002). The weight evolution of the rats is presented in Figure 2A. The average weekly food consumption by rat was 168.1 ± 12.1 g in the control group versus 149.3 ± 10.1 g in the 0.25% ARD group (P = 0.20) and 92.0 ± 16.7 g in the 0.5% ARD group (P < 0.0001) (n = 7 per group). The mortality rate was not different between the groups: 1/13 in the control group, 1/8 in the 0.25% ARD group and 1/8 in the 0.5% ARD group (P > 0.99).
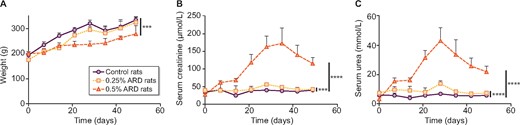
Weight and biological evaluation of rats fed a 0.25 and 0.5% ARD or controls. (A) Weight over time. (B) Serum creatinine over time. (C) Serum urea over time. •: control rats; ▪: 0.25% ARD rats; ▴: 0.5% ARD rats. ***P < 0.001, ****P < 0.0001.
ARD-induced dose-dependent renal insufficiency
There was a significant increase in plasma creatinine over time in the 0.25% ARD group (n = 7; P = 0.003) and the 0.5% ARD group (n = 7; P < 0.0001) compared with the control group. On Day 28, the average creatinine level was 40.0 ± 2.3 µmol/L in the control group versus 56.0 ± 5.6 µmol/L in the 0.25% ARD group and 163.1 ± 30.3 µmol/L in the 0.5% ARD group (P = 0.0006 and P = 0.0006, respectively; n = 7); serum creatinine levels were significantly higher in the 0.5% ARD than in the ARD 0.25% group (P = 0.0006) (Figure 2B). There was a significant increase in plasma urea over time in the 0.25% ARD group (P < 0.0001) and the 0.5% ARD group (P < 0.0001; n = 7) compared with the control group. On Day 28, the average urea level was 6.8 ± 1.0 mmol/L in the control group versus 13.8 ± 2.0 mmol/L in the 0.25% ARD group (P = 0.0006) and 43.1 ± 9.0 mmol/L in the 0.5% ARD group (P = 0.0006) (n = 7); serum urea levels were significantly higher in the 0.5% ARD group than in the ARD 0.25% group (P = 0.0006) (Figure 2C). Both serum urea and creatinine decreased after Day 35 in the ARD rats.
ARD-induced dose-dependent tubular damage and fibrosis
On Day 49, the average tubular injury score was 0.5 ± 0.4 in the control group (n = 12) versus 2.0 ± 0.4 in the 0.25% ARD group (n = 7; P < 0.0001) and 3.0 ± 0.4 in the 0.5% ARD group (n = 7; P < 0.0001). In addition, intratubular precipitation of adenine crystals was observed in the 0.5% ARD group (Figure 3A and B). On Day 49, the average Sirius red staining per slide was 1.7 ± 0.6% in the control group (n = 12) versus 8.0 ± 1.8% in the 0.25% ARD group (n = 6; P = 0.0001) and 30.2 ± 4.3% in the 0.5% ARD group (n = 6; P = 0.0001) (Figure 3C and D). The average IF/TA score was 0.0 ± 0.0 in the control group (n = 12) versus 1.9 ± 0.6 in the 0.25% ARD group (n = 7; P < 0.0001) and 2.6 ± 0.2 in the 0.5% ARD group (n = 7; P < 0.0001) (Figure 3E).
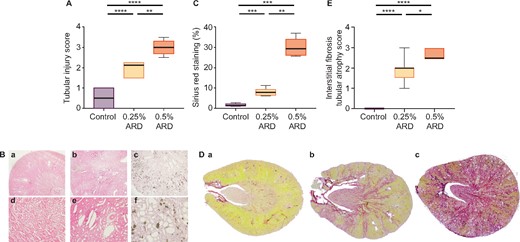
Renal histological evaluation of rats fed a 0.25 and 0.5% ARD and controls (Ctrl). (A) Tubular injury score after haematoxylin–eosin staining. (B) Renal histology in optical microscopy after haematoxylin–eosin staining in (a and d) control rats, (b and e) 0.25% ARD rats and (c and f) 0.5% ARD rats: (a–c) magnification ×20, (d–f) magnification ×100. (C) Sirius red staining. (D) Renal histology in optical microscopy after Sirius red staining on full histological section in (a) control rats, (b) 0.25% ARD rats and (c) 0.5% ARD rats. (E) IF/tubular injury score. *P < 0.05, **P < 0.01, ***P < 0.001, ****P < 0.0001.
On Day 49, the average kidney size was 22.5 ± 1.0 mm in the control group versus 21.1 ± 0.9 mm in the 0.25% ARD group (P = 0.11) and 21.3 ± 1.0 mm in the 0.5% ARD group (P = 0.05); kidney size was not different between the 0.25% and 0.5% ARD groups (P = 0.76).
ARD induces a dose-dependent decrease in 99mTc-DMSA uptake over time
99mTc-DMSA SPECT/CT imaging showed a significant decrease in renal uptake over time in rats fed with 0.25 and 0.5% ARD compared with control rats (P = 0.011 and P < 0.0001, respectively). On Day 0, the mean renal activity was 36.60 ± 5.49 %IA. On Day 28, the relative 99mTc-DMSA renal uptake was higher in the control group compared with the 0.25% ARD group [156.9 ± 41.9% versus 117.0 ± 17.7% (P = 0.02)] and the 0.5% ARD group [73.6 ± 14.7% (P = 0.0006)]; the relative renal uptake of 99mTC-DMSA was lower in the 0.5% ARD group compared with the 0.25% ARD group (P = 0.0006). On Day 49, the relative ratio of renal activity to injected activity of DMSA was higher in the control group compared with the 0.25% ARD group [137.7 ± 25.1% versus 101.0 ± 20.2% (P = 0.02)] and the 0.5% ARD group [63.2 ± 23.7% (P = 0.009)]; the relative renal uptake of 99mTC-DMSA was higher in the 0.25% group than in the 0.5% ARD group (P = 0.04) (Figure 4A and B).
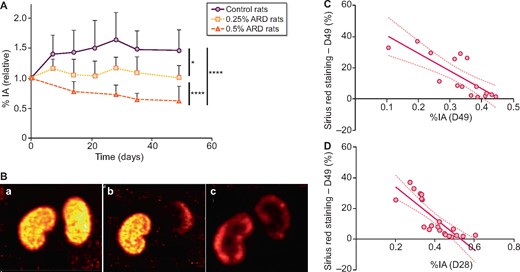
Renal SPECT/CT with 99mTc-DMSA of rats fed a 0.25 and 0.5% ARD or controls. (A) Evolution of 99mTc-DMSA uptake over time. Results are expressed as a percentage of the Day 0 value for each rat. (B) Renal imaging with 99mTc-DMSA SPECT/CT. (C) Correlation between Sirius red staining at Day 49 and 99mTc-DMSA uptake at Day 49 (r = −0.86, P = 0.0002, R2 = 0.63). (D) Correlation between Sirius red staining at Day 49 and 99mTc-DMSA uptake at Day 28 (r = −0.89, P < 0.0001, R2 = 0.67), %IA. •: control rats; ▪: 0.25% ARD rats; ▴: 0.5% ARD rats. *P < 0.05, ****P < 0.0001.
Early 99mTc-DMSA uptake is inversely correlated to kidney fibrosis
99mTC-DMSA uptake on Day 49 was significantly inversely correlated with Sirius red staining on Day 49 (r = −0.86, P = 0.0002, R2 = 0.63) (Figure 4C). This association remained significant in the ARD groups (r = −0.72, P = 0.02, R2 = 0.38). 99mTC-DMSA uptake on Day 49 was significantly inversely correlated with IF/TA score on Day 49 (r = −0.78, P = 0.001, R2 = 0.45) (Supplementary data, Figure S1A). Creatinine on Day 49 was not correlated with Sirius red staining in the ARD groups (r = 0.28, P = 0.43, R2 = 0.13). Serum urea and creatinine on Day 49 were not correlated with the IF/TA score in the ARD groups (P = 0.13 and P = 0.25, respectively).
99mTC-DMSA uptake was significantly inversely correlated with Sirius red staining at each time point since Day 7, except on Day 21 (Supplementary data, Table S1). 99mTc-DMSA uptake on Day 28 had the strongest correlation with Sirius red staining on Day 28 (r = −0.89, P < 0.0001, R2 = 0.67) (Figure 4D). This association remained significant in the ARD groups (r = −0.80, P = 0.001, R2 = 0.57).99mTc-DMSA uptake on Day 28 was also significantly inversely correlated with the IF/TA score on Day 28 (r = −0.61, P = 0.003, R2 = 0.19) (Supplementary data, Figure S1B). Serum creatinine on Day 28 was not correlated with Sirius red staining in the ARD groups (r = 0.38, P = 0.18, R2 = 0.19) or with DMSA on Day 28 (r = −0.01, P = 0.97, R2 = 0.06). Serum urea and creatinine on Day 28 were not correlated with the IF/TA score in the ARD groups (P = 0.10 and P = 0.20, respectively).
DISCUSSION
Induction of renal fibrosis and CKD by ARD is an established method [10]. We confirmed that the ARD model allows obtaining a persistent impairment of renal function, a tubulointerstitial histological impairment and collagen deposits indicating significant renal fibrosis. Interestingly, these impairments appeared in an adenine dose-dependent manner, with higher serum urea and creatinine and more important histologic damage in 0.5% ARD rats.
For the first time, we described an early decrease in renal 99mTc-DMSA uptake in the kidneys of ARD rats, highlighting progressive and chronic cortical scarring. 99mTc-DMSA accumulates in the kidneys by megalin/cubilin-mediated endocytosis in the proximal tubule [11], so its uptake will be reduced in various cases of tubular or interstitial damage. Here we confirmed that kidney fibrosis reduced functional renal parenchyma marked by 99mTc-DMSA. As illustrated by the correlation between 99mTc-DMSA quantification in kidney at Day 49 and Sirius red staining ex vivo in kidney collected on the same Day 49, along with the correlation between 99mTc-DMSA quantification in kidney IF/TA score at the same time point, we found that the reduction of renal parenchyma is inversely proportional to newly formed fibrous tissue in the kidney. Interestingly, we reported a strong inverse correlation with significant linear regression between renal 99mTc-DMSA uptake at Day 28 and Sirius red staining of fibrosis at Day 49 and between 99mTc-DMSA uptake at Day 28 and IF/TA score at Day 49, although urea and creatinine values decreased after stopping the diet on Day 28. These observations suggest that 99mTc-DMSA SPECT/CT at Day 28 may be predictive of fibrosis at Day 49 in rats. In addition, we described no correlation between kidney fibrosis (evaluated by Sirius red staining and IF/TA score) and markers of kidney function, such as serum urea and creatinine, at Day 28 or Day49, illustrating that serum urea and creatinine were not related or predictive of kidney fibrosis in this model. Moreover, no correlation was found between DMSA uptake and serum creatinine at the same time point, confirming that DMSA could not be used for renal function assessment [12]. The lack of blood urea nitrogen and creatinine degradation in ARD rats may be related to the loss of muscle mass rather than renal recovery [13]. Indeed, the animals with the highest renal insufficiency were also those that had gained the least weight. Finally, in our ARD rats, kidney size measured by CT was poorly altered, thus CT alone does not appear to be an effective test for assessing renal impairment.
To date in human clinical practice, 99mTc-DMSA renal scintigraphy is almost exclusively reserved for the evaluation of renal parenchymal scars after pyelonephritis in children [14]. Clinical studies are needed to confirm that 99mTc-DMSA SPECT/CT can be used as a non-invasive prognostic examination to predict permanent fibrosis lesions independent of current renal function. Thus 99mTc-DMSA SPECT/CT may be applied in CKD and other fields of nephrology. For example, in acute tubular necrosis, there is classically a dissociation between normalization of biological kidney function (evaluated by serum creatinine and estimated GFR) after kidney damage but an increased risk of CKD in the long term [15, 16], which is mainly due to maladaptive repair [17], leading to kidney fibrosis [1, 18]. In this case, 99mTc-DMSA SPECT/CT may be used as a non-invasive examination to identify patients with maladaptive repair who are at risk of developing CKD, as it was suggested in mice [19].
Recently interest in renal MRI in quantifying renal fibrosis during CKD has been suggested [20]. However, this method remains poorly accessible in clinical practice and expensive. Recently positron emission tomography/CT imaging with gallium-68 fibroblast activation protein, targeting fibroblastic activation leading to fibrosis, raised potential interest in cancer and idiopathic pulmonary fibrosis. Unfortunately this tracer is not available in clinical practice and has not been evaluated in kidney diseases. Thus there is no non-invasive method validated to predict the development of renal fibrosis. Repurposing 99mTc-DMSA SPECT/CT to predict kidney fibrosis may be a simple and inexpensive method.
In conclusion, this work reports that renal uptake of 99mTc-DMSA assessed by SPECT/CT is a non-invasive, early and predictive tool to assess the development of kidney fibrosis as observed in ARD rats. 99mTc-DMSA SPECT imaging allows a longitudinal follow-up of renal fibrosis and could be a non-invasive prognostic marker in pre-clinical experimentation. As it is already widely available for molecular imaging in patients, we suggest that 99mTc-DMSA may help to identify patients at risk of developing kidney fibrosis.
SUPPLEMENTARY DATA
Supplementary data are available at ndt online.
ACKNOWLEDGEMENTS
We thank the Plateforme de Biochimie, UMR 1149 Inserm, Université Paris Diderot, ERL CNRS 8252, Faculté de Médecine Site Bichat, Paris for performing biochemical tests.
FUNDING
This research was funded by the grant ‘End-stage renal disease and dialysis’ of the Société Française de Néphrologie, Dialyse et Transplantation in 2018.
AUTHORS’ CONTRIBUTIONS
M.B., B.G., G.H., S.B., P.B. and F.D.G. designed the study. A.M., P.G., B.G., M.B., G.H., S.F. and L.B. performed the imaging. M.B., L.D., P.B., S.C. and G.H. performed the histological experiments and scoring. M.B., G.H., S.F., L.B., A.M., P.B., S.C. and P.G. were in charge of the animals and the ARD model. M.B. performed the statistical analysis, wrote the manuscript and made the figures. G.H., B.G. and S.B. critically revised the manuscript. All authors read and approved the final manuscript.
CONFLICT OF INTEREST STATEMENT
None declared.
DATA AVAILABILITY STATEMENT
The data underlying this article will be shared upon reasonable request to the corresponding author.


Comments