


Coronavirus disease 2019 (COVID-19) is associated with high morbidity and mortality in patients on maintenance haemodialysis (HD) [1]. Thus dialysis patients were prioritized for anti-COVID vaccination [2]. However, the ideal vaccination schedule remains unknown in this population [3], as patients suffering from chronic kidney disease have an altered immune response [4], with a diminished vaccine response to the hepatitis B virus [5] and flu vaccines [6]. In this work we sought to evaluate the humoral response to the BNT162b2 anti-severe acute respiratory syndrome coronavirus 2 (SARS-CoV-2) vaccine and its associated factors in a French cohort of HD patients.
In this monocentric observational study, 58 HD patients who received two doses of the BNT162b2 (Pfizer-BioNTech) vaccine were included. Vaccines were injected at the start of HD sessions, with 21 days between the first and second dose. Among the patients, 56 had a negative serology on the first day of vaccination, 2 of whom had a past medical history of COVID-19 and 2 other patients did not have a serology test on Day 0. Of the 96 HD patients in our centre, 38 were not included due to an incomplete vaccination schedule (n = 15), vaccine refusal (n = 20) or a SARS-CoV-2 infection within the last 6 months (n = 3). None of the included patients had received an immunosuppressive regimen within 3 months before vaccination. A SARS-CoV-2 immunoglobulin G (IgG) antibody test was performed on the day of the first injection and 1 month after the second injection. This serological test consisted of a chemiluminescent microparticle method that quantifies antibodies against the receptor binding protein of the spike protein of SARS-CoV-2 [7]. A response >50 AU/mL was considered positive.
Clinical and biological data [age, sex, time on dialysis, diabetes mellitus, history of transplantation or glomerulopathy treated by immunosuppressive drugs, conventional HD or haemodiafiltration, mean Kt/V, past medical history of COVID-19, anti-hepatitis B surface (HbS) antibody rate, gamma globulin count, lymphocyte count, C-reactive protein, calculated normalized protein catabolic rate (nPCR) and registration on the transplantation list] were extracted from the patients’ medical records (data obtained within the last 2 months).
The collection of data associated with this study was approved by the ethics committee of Bourgogne (2021) and was in accordance with the Declaration of Helsinki 1975, as revised in 2013. Each patient included had previously given oral and written consent.
Data are expressed as median [interquartile range (IQR)] for continuous variables and number (percentage) for frequencies. Factors associated with SARS-CoV-2 IgG variation were evaluated using Spearman’s correlation and multiple linear regressions models. All statistical tests were carried out using SPSS version 23 (IBM, Armonk, NY, USA) and GraphPad Prism (GraphPad Software, San Diego, CA, USA).
Patients’ clinical and biological characteristics are summarized in Table 1. The median age was 67 years (IQR 55–79), 36% (n = 21) were women, 33% (n = 19) had diabetes mellitus and 62% (n = 36) were treated with haemodiafiltration. Ninety-six percent (n = 56) had a positive antibody response with a median IgG level of 1690 UA/mL (IQR 531–3921). Anti-SARS-CoV-2 IgG titre was significantly associated with age, nPCR and lymphocyte count in Spearman’s correlation tests (Figure 1). In the multiple linear regression model, we observed that women had a lower antibody response than men {standardized β coefficient −0.39 [95% confidence interval (CI) −0.66 to −0.11]; P < 0.01}. Additionally, a high nPCR (per 0.1 g/kg/day) [standardized β coefficient 0.29 (95% CI 0.05–0.53); P < 0.05] and high lymphocyte count (per 0.1 × 10³/µL) [standardized β coefficient 0.61 (95% CI 0.35–0.87); P < 0.0001] were associated with a greater antibody response. Age (per year) had no significant impact.
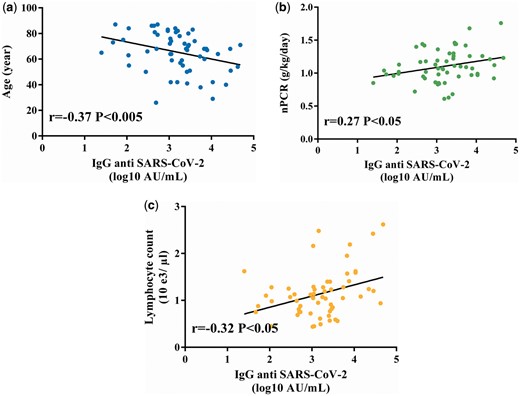
IgG SARS-CoV-2 correlation curves. Factors associated with anti-SARS-CoV-2 IgG immunization were (A) age, (B) nPCR and (C) lymphocyte count. Spearman’s correlations with an alpha risk of 5%.
Patients’ clinical and biological characteristics (N = 58)
| Characteristics | Values |
|---|---|
| Age (years), median (IQR) | 67 (55–79) |
| Female, n (%) | 21 (36) |
| History of COVID-19, n (%) | 2 (3) |
| Diabetes mellitus, n (%) | >19 (33) |
| History of immunosuppressive regimen, n (%) | 16 (28) |
| Time on dialysis (years), median (IQR) | 5.0 (2.8–8.3) |
| Haemodiafiltration, n (%) | 36 (62) |
| Kt/V, median (IQR) | 1.8 (1.6–2.1) |
| SARS-CoV-2-positive serology at inclusion, n (%) | 0/56 (0) |
| SARS-CoV-2-positive serology 1 month after vaccination, n (%) | 56 (96) |
| Anti-SARS-CoV-2 IgG titre 1 month after the second injection (UA/mL), median (IQR) | 1690 (531–3921) |
| Immunization against hepatitis Ba, n (%) | 44 (76) |
| Lymphocyte count (×103/µL), median (IQR) | 1.1 (0.8–1.3) |
| Gamma globulin count (g/L), median (IQR) | 8.9 (4.2–24.1) |
| C-reactive protein (mg/L), median (IQR) | 3.2 (0.0–6.5) |
| nPCR (g/kg/day), median (IQR) | 1.1 (0.9–1.3) |
Immunity to hepatitis B with anti-HBs >10 mUI/mL.
Overall, a large majority of patients had IgG antibody against SARS-CoV-2 after BNT162b2 (Pfizer-BioNTech) vaccine. These results were consistent with the data of other studies [8, 9] focusing on vaccine response in HD patients. In Grupper et al.’s [8] study, the median IgG level was slightly higher as compared with that of our patients but remained significantly lower than those of healthy patients (median 2900 UA/mL). The effect of a low lymphocyte count and older age was described in Grupper et al.’s [8] study. In our study, age had no significant impact in the multiple linear regression model, likely because of an elderly population (mean age 65 years) with low age variability (SD 15 years).
Our novel finding was that the humoral response was directly correlated with patients’ nutritional status (nPCR) and lymphocyte count. Indeed, adequate nutrition has a beneficial effect on immunity response and protection against infective diseases, namely COVID-19 [10]. Although the effect of nutritional status in the anti-COVID vaccination in the general population remains largely unknown, its importance is recognized in many other vaccinations, including measles, tetanus and others [11]. In HD patients, malnutrition has been associated with a decreased immune response to the hepatitis B vaccine [12]. Malnutrition has many causes and is related to mortality [13], therefore international guidelines have been issued [14]. These results can help target patients that could benefit from close monitoring of their humoral response to SARS-Cov-2 vaccination.
Recent studies regarding the humoral immunogenicity of SARS-Cov-2 vaccines reported a significant humoral response in most HD patients [9] after two doses. However, as reported by Grupper et al. [8] and Bertrand et al. [15], humoral response is significantly lower and less effective than in the general population. As the protective level remains undetermined, some countries have recommended a third dose of vaccine for dialysis patients. Further studies should follow IgG antibody ranges after a third dose and evaluate real-world vaccine efficacy in this immunocompromised population. It could help to identify low responders and tailor the vaccine protocol (booster injection) to prevent the high morbidity and mortality associated with SARS-Cov-2 infection.
AUTHORS’ CONTRIBUTIONS
A.J, M.L, J.M.R. prepared the manuscript. J.M.R. and M.L. planned and coordinated the study. A.J., E.K., C.B. and E.M. collected the clinical data. J.B.B. and A.D.R. performed most of the biological tests. J.M.R. and M.L. participated in the design of the study. M.L. and A.J. performed the statistical analysis. All authors revised the manuscript.
DATA AVAILABILITY STATEMENT
The data underlying this article will be shared on reasonable request to the corresponding author.
CONFLICT OF INTEREST STATEMENT
None declared. The results presented in this article have not been published previously.


Comments