


Abstract
Phosphate is absorbed in the small intestine via passive flow and active transport.NaPi-IIb, a type II sodium-dependent phosphate transporter, is considered to mediate active phosphate transport in rodents. To study the regulation of intestinal phosphate transport in chronic kidney disease (CKD), we analyzed the expression levels of NaPi-IIb, pituitary-specific transcription factor 1 (PiT-1) and PiT-2 and the kinetics of intestinal phosphate transport using two CKD models.
CKD was induced in rats via adenine orThy1 antibody injection. Phosphate uptake by intestinal brush border membrane vesicles (BBMV) and the messenger RNA (mRNA) expression of NaPi-IIb, PiT-1 and PiT-2 were analyzed. The protein expression level of NaPi-IIb was measured by mass spectrometry (e.g. liquid chromatography tandem mass spectrometry).
In normal rats, phosphate uptake into BBMV consisted of a single saturable component and its Michaelis constant (Km) was comparable to that of NaPi-IIb. The maximum velocity (Vmax) correlated with mRNA and protein levels of NaPi-IIb. In the CKD models, intestinal phosphate uptake consisted of two saturable components. The Vmax of the higher-affinity transport, which is thought to be responsible for NaPi-IIb, significantly decreased and the decrease correlated with reduced NaPi-IIb expression. The Km of the lower-affinity transport was comparable to that of PiT-1 and -2. PiT-1 mRNA expression was much higher than that of PiT-2, suggesting that PiT-1 was mostly responsible for phosphate transport.
This study suggests that the contribution of NaPi-IIb to intestinal phosphate absorption dramatically decreases in rats with CKD and that a low-affinity alternative to NaPi-IIb, in particular PiT-1, is upregulated in a compensatory manner in CKD.
What is already known about this subject?
• NaPi-IIb is a dominant phosphate transporter in rats for phosphate absorption in the small intestine, but little is known about the regulation of NaPi-IIb expression in the kidney diseases;
• besides NaPi-IIb, there are other phosphate transporters in the intestine—PiT-1 and PiT-2—but their precise role in intestinal phosphate absorption in health and CKD remains unknown.
What this study adds?
• Our study identifies major differences between normal and CKD rats in the active intestinal transcellular transport of phosphate;
• NaPi-IIb appears to be the dominant intestinal phosphate transporter in healthy rats, but its contribution is markedly affected by kidney disease; and
• as alternative to NaPi-IIb, low-affinity transporters such as PiT-1 gain importance for intestinal phosphate absorption.
What impact this may have on practice or policy?
• inhibition of transporters than other NaPi-IIb, such as PiT-1 and PiT-2, might be needed to ameliorate hyperphosphatemia in kidney diseases.
INTRODUCTION
Phosphate is absorbed in the small intestine by active transport via intestinal epithelial cells and passive flow via the tight junctions between cells [1]. The sodium-dependent phosphate transporter NaPi-IIb, solute carrier family 34 member 2 (Slc34a2), was identified in the small intestine 2 decades ago [2]. It is expressed mainly in the intestine, lungs, ovaries or testes and is thought to be involved in active intestinal phosphate absorption [2–5]. NaPi-IIb-deficient mice exhibit decreased intestinal phosphate absorption, low urinary phosphate excretion, low serum fibroblast growth factor 23 (FGF23) levels and increased serum calcitriol, all of which are consistent with systemic reductions of phosphate [6–8]. In addition, the expression level of NaPi-IIb correlated tightly with the active phosphate transport in rat intestinal brush-border membrane vesicles (BBMVs) [9]. Taken together, NaPi-IIb is thought to be the dominant intestinal phosphate transporter in rodents.
Hyperphosphatemia commonly develops in chronic kidney disease (CKD) due to impaired urinary phosphate excretion [10] and has been consistently associated with increased morbidity and mortality [11–14]. Phosphate binders are therefore recommended in such patients to reduce gastrointestinal phosphate absorption, since the intestinal absorption of phosphate is a major contributor to phosphate metabolism [15–19]. However, there is very little information about the intestinal expression level and activity of NaPi-IIb during kidney injury. Moreover, recent clinical trials in end-stage renal disease patients revealed that the selective NaPi-IIb inhibitorASP3325 neither inhibited intestinal phosphate absorption nor ameliorated hyperphosphatemia [20]. Besides NaPi-IIb, there are other phosphate transporters in the intestine, specifically SLC20a family members PiT-1 (Slc20a1) and PiT-2 (Slc20a2) [21, 22], but their precise role in intestinal phosphate absorption in health and CKD remains unknown.
To resolve the above questions, we analyzed the correlation between the kinetics of active phosphate transport and messenger RNA (mRNA) expression of NaPi-IIb, PiT-1 or PiT-2 in two rat models of CKD, namely adenine-induced nephropathy and anti-Thy1 nephritis. In addition, we adapted a highly sensitive liquid chromatography tandem mass spectrometry (LC-MS/MS) method for simultaneous quantification of membrane proteins to determine the expression of NaPi-IIb [23].
MATERIALS AND METHODS
Animal experiments
Male Wistar rats and Fischer 344 rats were purchased from Charles River Laboratories Japan (Tokyo, Japan). Animal procedures and protocols were in accordance with the Guidelines for the Care and Use of Laboratory Animals at Chugai Pharmaceutical and were approved by the Institutional Animal Care and Use Committee. For the analysis of healthy rats, 4-, 9- and 15-week-old Wistar rats were used. The adenine-induced CKD model was established by orally administrating adenine at 300 mg/kg to 6-week-old Wistar rats for 4 weeks (five times/week), after which they were subjected to analysis. Anti-Thy1-induced CKD was induced in 6-week-old Fischer 344 rats as described [24]. At 18 weeks after disease induction, animals were subjected to analysis. Rats had free access to food and water. In the case of healthy rats and rats with anti-Thy1 CKD, they were fed CE-2 (CLEA Japan, Tokyo, Japan), and CRF-1 (Oriental Yeast, Tokyo, Japan) in the case of adenine CKD rats. The contents were as follows: CE-2: phosphate 1.1 g, calcium 1.1 g, vitamin D3 275 U/100 g chow; CRF-1: phosphate 0.8 g, calcium 1.2 g, vitamin D3 643 U/100 g chow. Alfacalcidol 0.2 μg/kg (Chugai Pharmaceutical, Tokyo, Japan) or its vehicle (medium chain triglyceride) was administered by a single subcutaneous injection for 7 days. As phosphate is predominantly absorbed in the duodenum and upper jejunum in rats [25], small intestine samples were prepared by dissecting 10 cm of upper intestine starting at the pylorus. Preparation of BBMVs for analyzing protein and phosphate uptake was carried out by partially modifying a previous method [2]. The animals were euthanized by exsanguination under isoflurane or ketamine anesthesia.
Phosphate uptake in BBMVs
The uptake of H333PO4 (PerkinElmer, Waltham, MA, USA) by BBMVs was measured by a rapid filtration technique as described previously [26]. Briefly, 80 μL of buffer containing specified concentrations of 33P was added to 20 μL of membrane vesicle suspension. At the specified times, the mixture was poured immediately onto Millipore filters (HAWP 0.45 μm) and the radioactivity of the 33P trapped in membrane vesicles was determined using a liquid scintillation counter (PerkinElmer). The buffer consisted of 60 mmol/L mannitol, 110 mmol/L sodium chloride (NaCl), 10 mmol/L HEPES-Tris (pH 7.5). Sodium-dependent phosphate uptake was calculated by deducting the uptake in buffer substituting NaCl with potassium chloride. The Michaelis–Menten curve was generated based on substrate concentration and calculated velocity and the apparent Michaelis constant (Km) and maximum velocity (Vmax) of phosphate uptake were calculated by a nonlinear regression method using JMP 11.2.1 (SAS Institute Japan, Tokyo, Japan).
Measurement of NaPi-IIb, PiT-1, PiT-2 and villin-1 mRNA by quantitative polymerase chain reaction (qPCR)
Expression of mRNA was measured byqPCR using the Applied Biosystems 7900HT Fast Real-Time PCR System (Thermo Fisher Scientific, Tokyo, Japan). The target sequences of NaPi-IIb, PiT-1, PiT-2 and villin-1 for real-time PCR are listed in Supplementary data, Table S1. The complementary DNA fragments of the target sequences were generated by reverse-transcription PCR with specific primers from rat intestinal total RNA. Each PCR product was ligated into the pcDNA3.1 vector (Life Technologies Japan, Tokyo, Japan) and transformed into competent DH5α cells. The concentrations of purified plasmid DNA were measured by spectrophotometry and corresponding copy numbers were calculated. Serial dilutions of the respective plasmid DNA were used as standards to make calibration curves. The absolute amount of mRNA of each gene was calculated from the calibration curve and normalized by villin-1.
Kinetic parameters of phosphate uptake in rat BBMV with increasing age
| Parameters | 4 weeks old | 9 weeks old | 15 weeks old |
|---|---|---|---|
| Km (μmol/L) | 12.6 (9.4–15.8) | 9.0 (7.1–11.0) | 6.8 (4.6–8.9) |
| Vmax (pmol/ min/μg protein) | 3.24 (3.00–3.47) | 1.12 (1.05–1.18) | 0.47 (0.42–0.50) |
| Parameters | 4 weeks old | 9 weeks old | 15 weeks old |
|---|---|---|---|
| Km (μmol/L) | 12.6 (9.4–15.8) | 9.0 (7.1–11.0) | 6.8 (4.6–8.9) |
| Vmax (pmol/ min/μg protein) | 3.24 (3.00–3.47) | 1.12 (1.05–1.18) | 0.47 (0.42–0.50) |
Values are expressed as an estimate from nonlinear regression analysis (n = 4) and 95% confidence intervals.
Measurement of NaPi-IIb and villin-1 protein by LC-MS/MS
BBMVs of rat intestine were used to measure the protein of NaPi-IIb and villin-1. The method was based on previous reports [23, 27], the details of which are in the Supplemental Methods. Briefly, intestinal samples were reduced and alkylated. Then the S-carbamoylmethylated proteins were digested. After adding stable isotope-labeled internal standard peptides, the digests were extracted usingOASIS MAX μElution plates (Waters, Milford, MA, USA) and were analyzed by anACQUITY UPLC M-class system coupled to a XevoTQ-S triple quad mass spectrometer equipped with an ionKey system (Waters). The sequences used for the analyses are shown in Supplementary data, Table S2.
Changes in NaPi-IIb, PiT-1 and PiT-2 mRNA expression levels in the upper intestine with age in normal rats
| Transporters | 4 weeks old | 9 weeks old | 15 weeks old |
|---|---|---|---|
| NaPi-IIb (mmol/mol villin-1) | 63.8 ± 3.9 | 18.9 ± 3.5* | 7.6 ± 1.5* |
| PiT-1 (mmol/mol villin-1) | 12.4 ± 2.0 | 9.2 ± 1.7 | 14.9 ± 1.8 |
| PiT-2 (mmol/mol villin-1) | 0.26 ± 0.05 | 0.17 ± 0.05 | 0.31 ± 0.12 |
| Transporters | 4 weeks old | 9 weeks old | 15 weeks old |
|---|---|---|---|
| NaPi-IIb (mmol/mol villin-1) | 63.8 ± 3.9 | 18.9 ± 3.5* | 7.6 ± 1.5* |
| PiT-1 (mmol/mol villin-1) | 12.4 ± 2.0 | 9.2 ± 1.7 | 14.9 ± 1.8 |
| PiT-2 (mmol/mol villin-1) | 0.26 ± 0.05 | 0.17 ± 0.05 | 0.31 ± 0.12 |
Values are expressed as mean ± SE (n = 12).
P < 0.05, significant difference versus 4 weeks old.
Biochemical analyses of rat serum
Serum phosphate, calcium, creatinine and blood urea nitrogen (BUN) were measured by an automatic analyzer (Toshiba, Tokyo, Japan). Calcitriol [1,25(OH)2D3 RIA Kit FR, Fujirebio, Tokyo, Japan] andFGF23 (FGF23 ELISA Kit, Kainos Laboratories, Tokyo, Japan) were measured according to the manufacturer’s instructions.
Statistical analysis
Statistical analysis was performed using JMP 11.2.1. The Tukey–Kramer test was used for the aging rats study and the Student’s t-test for the CKD rats study.
RESULTS
Intestinal phosphate uptake and transporters in healthy rats
We first examined the intestinal expression of phosphate transporters and intestinal phosphate metabolism in normal rats. Figure 1 shows sodium-dependent phosphate uptake in BBMVs obtained from 4-, 9- and 15-week-old rats. Eadie–Hofstee plot analyses indicated that sodium-dependent uptake consisted of a single saturable component. Kinetic parameters calculated by the nonlinear regression method are shown in Table 1. Km remained similar in rats ages 4, 9 and 15 weeks and the values corresponded to the Km of NaPi-IIb as reported previously [28]. The Vmax of rat intestinal phosphate transport markedly decreased with age (3.24, 1.12 and 0.47 pmol/μg protein/min for 4, 9 and 15 weeks, respectively).
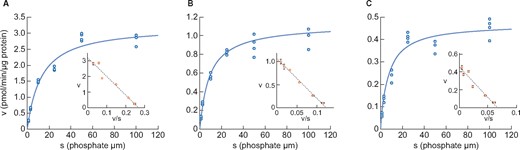
Changes in phosphate uptake by rat intestinal BBMVs with age (A) 4 weeks old, (B) 9 weeks old and (C) 15 weeks old. Dots represent the actual values and the Michaelis–Menten curve was generated using JMP 11.2.1. Inset shows an Eadie–Hofstee plot of the uptake. Each point in the inset represents the mean of three measurement points.
The mRNA expression levels of the three intestinal phosphate transporters are shown in Table 2. PiT-2 mRNA levels were much lower than NaPi-IIb or PiT-1 in the upper intestine. NaPi-IIb mRNA markedly decreased with age and paralleled the reduction in serum phosphate and calcitriol concentrations (Table 3) and phosphate uptake Vmax in BBMVs (Table 1). In contrast, PiT-1 mRNA did not change with age. Expression of NaPi-IIb protein was readily detected by the LC-MS/MS method and corresponded to mRNA expression (Figure 2).
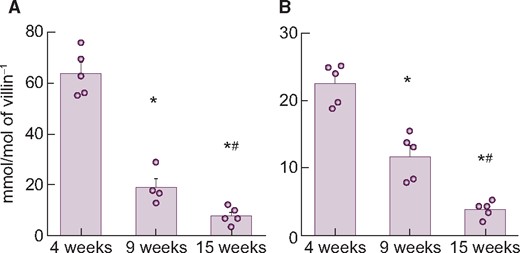
Changes in NaPi-IIb (A) mRNA or (B) protein expression level in rat upper intestine with age. Values are normalized by villin-1 protein or mRNA, respectively. The actual values are represented as dots and the columns represent mean ± SE. *P < 0.05, significant difference versus 4 weeks old; #P < 0.05, significant difference versus 9 weeks old (Tukey–Kramer test).
Serum biochemistry and phosphate-related hormones with age in normal rats
| Parameters | 4 weeks old | 9 weeks old | 15 weeks old |
|---|---|---|---|
| Phosphate (mg/dL) | 9.6 ± 0.2 | 6.6 ± 0.2* | 5.6 ± 0.1*,** |
| Calcium (mg/dL) | 10.5 ± 0.1 | 10.4 ± 0.1* | 10.1 ± 0.1*,** |
| BUN (mg/dL) | 15.5 ± 0.5 | 18.1 ± 0.3* | 17.9 ± 0.4*,** |
| Creatinine (mg/dL) | 0.04 ± 0.01 | 0.07 ± 0.01* | 0.15 ± 0.01*,** |
| FGF23 (pg/mL) | 309 ± 34 | 457 ± 35* | 689 ± 60*,** |
| Intact PTH (pg/mL) | 370 ± 22 | 279 ± 73* | 167 ± 8*,** |
| Calcitriol (pg/mL) | 311 ± 29 | 219 ± 16* | 74 ± 12*,** |
Values are expressed as mean ± SE (n = 12).
P < 0.05, significant difference versus 4 weeks old.
P < 0.05; significant difference versus from 9 weeks old (Tukey–Kramer test).
Intestinal phosphate uptake and transporters in rats with adenine-induced CKD
Within 4 weeks, adenine-induced CKD in rats manifested as severe renal tubular injury accompanied by hyperphosphatemia, increased serum parathyroid hormone (PTH) and FGF23 and reduced calcitriol levels compared with normal rats (Table 4). Serum calcium did not change despite the calcitriol reduction at this point, but decreased as disease progressed (data not shown).
Serum biochemistry and phosphate-related hormones in rats with adenine-induced CKD
| Parameters | Normal | CKD |
|---|---|---|
| Phosphate (mg/dL) | 7.1 ± 0.1 | 9.0 ± 0.4* |
| Calcium (mg/dL) | 10.6 ± 0.1 | 10.7 ± 0.1 |
| BUN (mg/dL) | 21.2 ± 0.5 | 109.8 ± 5.5* |
| Creatinine (mg/dL) | 0.26 ± 0.01 | 1.51 ± 0.09* |
| FGF23 (pg/mL) | 1291 ± 170 | 14765 ± 2826* |
| Intact PTH (pg/mL) | 143 ± 8 | 888 ± 117* |
| Calcitriol (pg/mL) | 128 ± 16 | 14 ± 6* |
Values are expressed as mean ± SE (n = 10).
P < 0.05, significant difference versus normal control rats (Student’s t-test).
Normal, normal rats; CKD, adenine-induced CKD rats.
Figure 3 shows sodium-dependent phosphate uptake in intestinal BBMVs prepared from normal and CKD animals. In contrast to healthy rats, where Eadie–Hofstee plot analysis indicated that intestinal phosphate uptake consisted of a single saturable component, it consisted of two saturable components in rats with adenine-induced CKD. Kinetic parameters calculated by the nonlinear regression method are shown in Table 5. The Km values of normal rats and of the higher-affinity component in CKD rats were 6.3 and 4.0 μmol/L, respectively, which is similar to the known Km of NaPi-IIb [28]. The Km value of the lower-affinity component in CKD rats was 166.1 μmol/L, similar to that of PiT-1 and PiT-2 as reported previously [29]. The phosphate uptake Vmax of the higher-affinity component in CKD rats was decreased compared with normal rats (0.23 versus 0.61 pmol/μg protein/min, respectively).
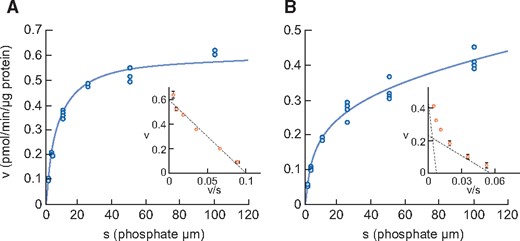
Phosphate uptake by intestinal BBMVs in (A) normal rats and (B) adenine-induced CKD rats. Dots represent the actual values and the Michaelis–Menten curve was generated using JMP 11.2.1. Inset shows an Eadie–Hofstee plot of the uptake. Each point represents the mean of three measurement points. Normal, normal rats; CKD, adenine-induced CKD rats.
Kinetic parameters of phosphate uptake in BBMVs of rats with adenine-induced CKD
| Parameters | Normal | CKD |
|---|---|---|
| Km1 (μmol/L) | 6.3 ± 0.5 | 4.0 ± 1.7 |
| Vmax1 (pmol/min/μg protein) | 0.61 ± 0.01 | 0.23 ± 0.06 |
| Km2 (μmol/L) | – | 166.1 ± 232.0 |
| Vmax2 (pmol/min/μg protein) | – | 0.52 ± 0.32 |
| Parameters | Normal | CKD |
|---|---|---|
| Km1 (μmol/L) | 6.3 ± 0.5 | 4.0 ± 1.7 |
| Vmax1 (pmol/min/μg protein) | 0.61 ± 0.01 | 0.23 ± 0.06 |
| Km2 (μmol/L) | – | 166.1 ± 232.0 |
| Vmax2 (pmol/min/μg protein) | – | 0.52 ± 0.32 |
Values are expressed as an estimate ± SE from nonlinear regression analysis (n = 4).
Normal, normal rats; CKD, adenine-induced CKD rats.
The mRNA expression levels of the three transporters are shown in Table 6. Similar to findings in healthy rats (see above), PiT-2 mRNA levels were much lower than NaPi-IIb or PiT-1 in the upper intestine. Whereas PiT-1 and PiT-2 mRNA did not change in CKD rats compared with normal rats, the mRNA and protein expression level of NaPi-IIb, considered to be the main intestinal phosphate transporter in rats, significantly decreased in CKD rats compared with normal rats, mirroring the decrease of phosphate uptake velocity in adenine-induced CKD (Figure 4). The injection of alfacalcidol into CKD rats increased NaPi-IIb mRNA and protein expression back to normal levels (Supplementary data, Table S3, Figure 1).
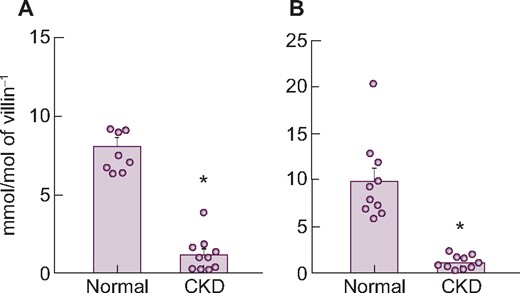
Changes in NaPi-IIb (A) mRNA and (B) protein expression levels in the upper intestine of rats with adenine-induced CKD. Values are normalized by villin-1 protein and mRNA, respectively. The actual values are represented as dots and the columns represent mean + SE. *P < 0.05, significant difference versus normal (Student’s t-test). Normal, normal rats; CKD, adenine-induced CKD rats.
Changes in NaPi-IIb, PiT-1 and PiT-2 mRNA expression levels in the upper intestine of rats with adenine-induced CKD
| Transporters | Normal | CKD |
|---|---|---|
| NaPi-IIb (mmol/mol villin-1) | 8.1 ± 0.5 | 1.2 ± 0.3* |
| PiT-1 (mmol/mol villin-1) | 22.0 ± 2.0 | 22.7 ± 1.9 |
| PiT-2 (mmol/mol villin-1) | 0.21 ± 0.02 | 0.26 ± 0.05 |
| Transporters | Normal | CKD |
|---|---|---|
| NaPi-IIb (mmol/mol villin-1) | 8.1 ± 0.5 | 1.2 ± 0.3* |
| PiT-1 (mmol/mol villin-1) | 22.0 ± 2.0 | 22.7 ± 1.9 |
| PiT-2 (mmol/mol villin-1) | 0.21 ± 0.02 | 0.26 ± 0.05 |
Values are expressed as mean ± SE (n = 10).
P < 0.05, significant difference versus normal (Student’s t-test).
Normal, normal rats; CKD, adenine-induced CKD rats.
Intestinal phosphate uptake and transporters in rats with anti-Thy1-induced CKD
Chronic anti-Thy1 nephritis, induced by anti-Thy1 antibody and uninephrectomy, was examined as another CKD model. Eighteen weeks after disease induction, serum creatinine, BUN, phosphate, intact PTH and FGF23 significantly increased in diseased rats compared with sham-operated rats, whereas serum calcitriol decreased (Table 7). Similar to adenine-induced CKD, serum calcium did not change despite the calcitriol reduction at this point, but decreased as the disease progressed (data not shown).
Serum biochemistry and phosphate-related hormones in rats with anti-Thy1 CKD
| Parameters | Sham | CKD |
|---|---|---|
| Phosphate (mg/dL) | 4.4 ± 0.1 | 9.6 ± 0.5* |
| Calcium (mg/dL) | 10.3 ± 0.1 | 10.3 ± 0.1 |
| BUN (mg/dL) | 22.5 ± 0.3 | 128.3 ± 4.8* |
| Creatinine (mg/dL) | 0.28 ± 0.00 | 1.83 ± 0.10* |
| FGF23 (pg/mL) | 315 ± 13 | 19628 ± 6599* |
| Intact PTH (pg/mL) | 4 ± 3 | 2782 ± 307* |
| Calcitriol (pg/mL) | 120 ± 11 | 11 ± 1* |
Values are expressed as mean ± SE (sham: n = 10, CKD: n = 12).
P < 0.05, significant difference versus normal control rats (Student’s t-test).
Sham, sham-operated rats; CKD, anti-Thy1 CKD rats.
Figure 5 shows the sodium-dependent phosphate uptake in intestinal BBMVs prepared from sham-operated and chronic anti-Thy1 CKD rats. As in adenine-induced CKD, Eadie–Hofstee plot analysis of anti-Thy1-induced rat CKD again revealed two saturable components (Table 8). The Km of the higher-affinity component in anti-Thy1 CKD rats was 4.7 μmol/L, i.e. similar to the known Km of NaPi-IIb [28]. The Km value of the lower-affinity component in diseased rats was 103.2 μmol/L, which is equivalent to that of PiT-1 and PiT-2 [29]. The Vmax of phosphate uptake of the higher-affinity component in diseased rats was apparently reduced compared with that of sham-operated rats (0.10 versus 0.33 pmol/μg protein/min, respectively).
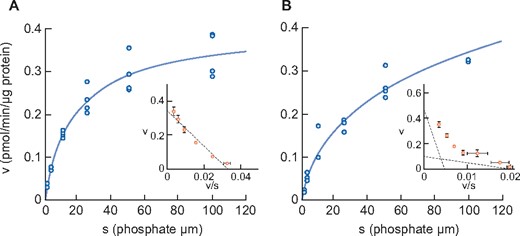
Phosphate uptake by intestinal BBMV in sham rats (A) and anti-Thy1-induced CKD rats (B). Dots represent the actual values and the Michaelis–Menten curve was generated using JMP11.2.1. Inset shows an Eadie–Hofstee plot of the uptake. Each point represents the mean of three measurement points. Sham, sham-operated rats; CKD, anti-Thy1 CKD rats.
Kinetic parameters of phosphate uptake in BBMV of rats with anti-Thy1 CKD
| Parameters | Sham | CKD |
|---|---|---|
| Km1 (μmol/L) | 14.7 ± 3.0 | 4.7 ± 9.3 |
| Vmax1 (pmol/min/μg protein) | 0.33 ± 0.02 | 0.10 ± 0.15 |
| Km2 (μmol/L) | – | 103.2 ± 169.8 |
| Vmax2 (pmol/min/μg protein) | – | 0.51 ± 0.20 |
| Parameters | Sham | CKD |
|---|---|---|
| Km1 (μmol/L) | 14.7 ± 3.0 | 4.7 ± 9.3 |
| Vmax1 (pmol/min/μg protein) | 0.33 ± 0.02 | 0.10 ± 0.15 |
| Km2 (μmol/L) | – | 103.2 ± 169.8 |
| Vmax2 (pmol/min/μg protein) | – | 0.51 ± 0.20 |
Values are expressed as an estimate ± SE from nonlinear regression analysis (n = 4).
Sham, sham-operated rats; CKD, anti-Thy1 CKD rats.
The mRNA expression levels of three transporters in the upper intestine are shown in Table 9. Similar to the findings in adenine-induced CKD rats, PiT-1 or PiT-2 mRNA did not change in anti-Thy1 CKD rats. But again, NaPi-IIb mRNA and protein were significantly decreased in diseased rats compared with normal rats, mirroring the decrease in phosphate uptake velocity (Figure 6). Injection of alfacalcidol also increased NaPi-IIb mRNA and protein back to normal levels in these animals (Supplementary data, Table S4, Figure 2).
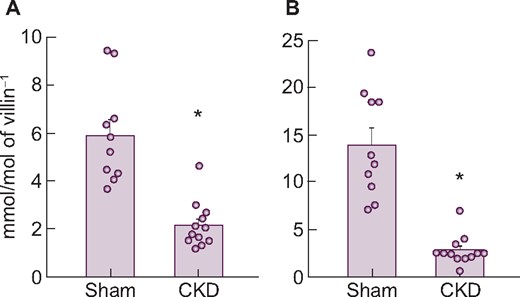
Changes in NaPi-IIb (A) mRNA and (B) protein expression levels in the upper intestine of rats with anti-Thy1 CKD. Values are normalized by villin-1 protein and mRNA, respectively. The actual values are represented as dots and the columns represent mean + SE. *P < 0.05, significant difference versus sham (Student’s t-test). Sham, sham-operated rats; CKD, anti-Thy1 CKD rats.
Changes in NaPi-IIb, PiT-1 and PiT-2 mRNA expression levels in the upper intestine of rats with anti-Thy1 CKD
| Transporters | Sham | CKD |
|---|---|---|
| NaPi-IIb (mmol/mol villin-1) | 5.9 ± 0.7 | 2.2 ± 0.3* |
| PiT-1 (mmol/mol villin-1) | 19.8 ± 1.1 | 24.7 ± 2.8* |
| PiT-2 (mmol/mol villin-1) | 0.27 ± 0.03 | 0.21 ± 0.02 |
| Transporters | Sham | CKD |
|---|---|---|
| NaPi-IIb (mmol/mol villin-1) | 5.9 ± 0.7 | 2.2 ± 0.3* |
| PiT-1 (mmol/mol villin-1) | 19.8 ± 1.1 | 24.7 ± 2.8* |
| PiT-2 (mmol/mol villin-1) | 0.27 ± 0.03 | 0.21 ± 0.02 |
Values are expressed as mean ± SE (sham: n = 10, CKD: n = 12).
P < 0.05, significant difference versus sham (Student’s t-test).
Sham, sham-operated rats; CKD, anti-Thy1 CKD rats.
DISCUSSION
NaPi-IIb is believed to represent the dominant transporter involved in active intestinal phosphate transport [1–8]. In this study we confirmed this in normal rats. However, in rats with CKD, intestinal NaPi-IIb protein levels and intestinal phosphate absorption via NaPi-IIb decreased. Thus our study establishes fundamental differences between normal and CKD rats, as well as differences in the regulation of intestinal phosphate transporters in CKD.
We analyzed the relationship between transporter expression and phosphate metabolism, including intestinal phosphate absorption, using healthy rats. In this study, sodium-dependent phosphate uptake in normal rat intestine consisted of a single saturable component, and its Km value was similar to that of NaPi-IIb [28]. In agreement with previous findings [9], phosphate uptake (Vmax) in BBMVs decreased with age and correlated with lower mRNA and protein expression levels of NaPi-IIb, identifying NaPi-IIb rather than PiT-1 or PiT-2 as the dominant transporter responsible for active phosphate uptake in rat intestine. NaPi-IIb is regulated by calcitriol in rodents and is increased by cholecalciferol administration or decreased by vitamin D receptor deletion [9, 30–32]. In our older rats, NaPi-IIb protein and intestinal phosphate uptake capacity markedly decreased, consistent with the decrease in serum calcitriol and in serum phosphate with age. A likely explanation is that in growing rats, more phosphate is needed for bone growth and this demand decreases as growth slows down. Our results thus indicate that intestinal phosphate uptake via NaPi-IIb changes with the physiological demand for phosphate in rats.
As the characteristics of intestinal phosphate absorption in CKD remain controversial, we analyzed the relationship between transporter expression and phosphate metabolism, including intestinal phosphate absorption using two different CKD rat models. Both in adenine- and anti-Thy1-induced CKD in rats, serum phosphate significantly increased and calcitriol significantly decreased, paralleled by a significant decrease in the intestinal mRNA and protein expression of NaPi-IIb. A strength of this study is the consistency of the data in two fundamentally different CKD models, whereas adenine crystals directly injure renal proximal tubules [33], injection of anti-Thy1 antibody primarily damages glomeruli and tubular injury instead develops in a secondary fashion [24]. As calcitriol is synthesized in renal proximal tubules, both models, despite being induced in different ways, resulted in reduced serum calcitriol levels. We confirmed the important role of calcitriol by showing that the injection of alfacalcidol restored intestinal NaPi-IIb mRNA and protein expression to normal even though kidney injury and hyperphosphatemia were not affected. Taken together, these data indicate that CKD-associated calcitriol deficiency suppresses intestinal NaPi-IIb expression in rats with CKD. In contrast to calcitriol, cholecalciferol increased sodium-dependent phosphate uptake but only had a weak effect on NaPi-IIb expression [31].
Unexpectedly, phosphate uptake into intestinal BBMVs of rats in two CKD models consisted of two saturable components, which may reflect a compensatory response to the decreased NaPi-IIb mRNA and protein expression. The Km of the higher-affinity component was 4.0 and 4.7 μmol/L in adenine CKD and anti-Thy1 CKD, respectively, which are equivalent to NaPi-IIb values. The phosphate uptake (Vmax) of the higher-affinity component was apparently decreased in both CKD models compared with normal rats, which corresponds to the observed reduction in NaPi-IIb expression. These results indicate that the contribution of intestinal phosphate uptake via NaPi-IIb decreased in CKD rats. Whereas the Km of the lower-affinity component was 166 or 103 μmol/L, respectively, which was equivalent to that of PiT-1 or PiT-2 [28, 29], Km and Vmax were similar in the anti-Thy1 and adenine CKD models, suggesting that CKD affects intestinal phosphate transporters independent of its origin. As the expression level of PiT-1 mRNA was much higher than PiT-2 mRNA in rats, PiT-1 might be responsible for the low-affinity transport. However, in the intestine in two CKD rat models, PiT-1 mRNA was not increased compared with that of normal rats, which suggests PiT-1 protein is not regulated at the transcriptional level. However, we cannot fully exclude that an as yet unknown transporter also contributes to intestinal phosphate absorption in rat CKD. Further studies are needed to better characterize the features of the lower affinity transporter(s) in rat CKD.
Our results should be interpreted in the context of some limitations. Phosphate is absorbed in the small intestine by active transcellular transport and passive flow. Although the relative contribution of the active versus passive pathway remains unknown, a pan-phosphate transporter inhibitor markedly ameliorated hyperphosphatemia in adenine- and Thy1-induced CKD rats [34]. Therefore, in this study, we focused on active transport. However, to understand the intestinal phosphate absorption rigorously, additional analyses, e.g. using intestinal gut sacs, would be needed. In addition, as our research is based on rats, the question remains regarding extrapolation from rodents to humans. The expression levels of phosphate transporters in humans remain unknown and it will be necessary to study using human intestine to elucidate whether there are species differences in intestinal phosphate absorption.
In conclusion, our study identifies major differences in the intestinal phosphate absorption system between normal and CKD rats. NaPi-IIb appears to be the dominant intestinal phosphate transporter in young and healthy rats, and its expression is markedly affected by renal disease in that the contribution of NaPi-IIb to intestinal phosphate absorption is decreased in CKD and low-affinity transporters such as PiT-1 gain in importance.
SUPPLEMENTARY DATA
Supplementary data are available at ndt online.
ACKNOWLEDGEMENTS
We thank Hitoshi Hagita, Masahiro Umehara (employee of Chugai Research Institute for Medical Science) and Miho Fukasawa (employee of Chugai Pharmaceutical) for their assistance in evaluating the studies using rats, Jacob Davis (employee of Chugai Pharmaceutical) for his assistance with English usage and Takei Kake (employee of Chugai Pharmaceutical) for helpful discussions.
FUNDING
Chugai supported all of the research. This study was supported in part by the German Research Foundation (SFB TRR 219, C1).
AUTHORS’ CONTRIBUTIONS
Y.I., S.O., T.Y., N.M., Y.T. and N.H. conceived and designed the research and analyzed the data. Y.I., S.O., T.Y., N.M., Y.T., Y.K., H.S., N.H., K.M. and J.F. edited and revised the manuscript and approved the final version of the manuscript. Y.I., S.O., T.Y., N.M., Y.T. and N.H. performed the experiments. Y.I., S.O., T.Y., N.M., Y.T. and N.H. interpreted the results of the experiments. Y.I., N.H. and J.F. prepared the figures and drafted the manuscript.
CONFLICT OF INTEREST STATEMENT
J.F. has received consultant honoraria from Chugai, Amgen, Fresenius, Medice and Vifor. Y.I., S.O., T.Y., N.M., Y.T., Y.K. and N.H. are employees of Chugai Pharmaceutical. H.S. and K.M. declare no conflicts of interest.


Comments