


Abstract
Acute kidney injury (AKI) is a key risk factor for chronic kidney disease in the general population, but has not been investigated in detail among renal transplant recipients (RTRs). We investigated the incidence, severity and risk factors for AKI following cardiac surgery among RTRs compared with non-RTRs with otherwise similar clinical characteristics.
We conducted a retrospective cohort study of RTRs (n = 83) and non-RTRs (n = 83) who underwent cardiac surgery at two major academic medical centers. Non-RTRs were matched 1:1 to RTRs by age, preoperative (preop) estimated glomerular filtration rate and type of cardiac surgery. We defined AKI according to Kidney Disease: Improving Global Outcomes criteria.
RTRs had a higher rate of AKI following cardiac surgery compared with non-RTRs [46% versus 28%; adjusted odds ratio 2.77 (95% confidence interval 1.36–5.64)]. Among RTRs, deceased donor (DD) versus living donor (LD) status, as well as higher versus lower preop calcineurin inhibitor (CNI) trough levels, were associated with higher rates of AKI (57% versus 33% among DD-RTRs versus LD-RTRs; P = 0.047; 73% versus 36% among RTRs with higher versus lower CNI trough levels, P = 0.02). The combination of both risk factors (DD status and higher CNI trough level) had an additive effect (88% AKI incidence among patients with both risk factors versus 25% incidence among RTRs with neither risk factor, P = 0.004).
RTRs have a higher risk of AKI following cardiac surgery compared with non-RTRs with otherwise similar characteristics. Among RTRs, DD-RTRs and those with higher preop CNI trough levels are at the highest risk.

ADDITIONAL CONTENT
An author video to accompany this article is available at:
https://dbpia.nl.go.kr/ndt/pages/author_videos.
INTRODUCTION
Major advances in kidney transplantation (Tx) over the last decade have resulted in improvements in 1-year graft survival [1]. However, long-term graft failure after the first post-transplant year remains a major public health issue and is the fourth leading cause of end-stage renal disease in the USA [2]. Mechanisms of graft failure include transplant-related causes, such as calcineurin inhibitor (CNI) nephrotoxicity [3, 4], cellular- and antibody-mediated rejection [5–7], BK virus nephropathy [8], ischemia–reperfusion injury [9] and reduced nephron mass [10, 11], but could also include increased susceptibility to acute kidney injury (AKI) occurring in more traditional clinical settings. Specifically, whether renal transplant recipients (RTRs) are at increased risk of AKI in settings such as cardiac surgery, critical illness or following exposure to iodinated contrast or other nephrotoxins has not been rigorously tested; indeed, RTRs are typically excluded from such studies [12, 13]. Since AKI is a strong risk factor for incident and progressive chronic kidney disease (CKD) among non-RTRs [14–17], establishing whether RTRs are at heightened risk of AKI could shed light on a key pathway contributing to long-term graft failure. Furthermore, establishing the risk factors for AKI among RTRs could lead to therapeutic strategies aimed at reducing the burden of AKI in this population.
Prior studies assessing AKI in solid-organ transplant recipients have mostly focused on AKI in the immediate peri-transplant period [18–25]. Among RTRs specifically, the few studies assessing AKI more broadly were limited by inclusion of patients with heterogeneous (or unknown) causes of AKI [26–28]; reliance on diagnostic and billing codes to define AKI [26], which has limited sensitivity for identifying mild-to-moderate AKI [29]; and absence of a comparison group of non-RTRs [26–28]. Furthermore, some studies [27, 28] defined AKI based on changes in serum creatinine (SCr) detected primarily in outpatient settings, and thus may have misclassified CKD progression as AKI.
Due to the limitations of existing studies, whether RTRs are at higher risk of AKI compared with non-RTRs with otherwise similar clinical characteristics remains unknown. In this study, we examined the incidence, severity and risk factors for AKI following cardiac surgery in RTRs compared with matched non-RTRs. We studied patients undergoing cardiac surgery because of the known timing of renal insult and the high rates of AKI postoperatively [15, 30].
MATERIALS AND METHODS
Study design
We conducted a retrospective cohort study of RTRs and non-RTRs, who underwent cardiac surgery at Brigham and Women’s Hospital or Massachusetts General Hospital, both in Boston, MA, USA. All protocols were approved by our hospital’s institutional review board (Protocol# 2007P000003).
Data source and study cohort
We derived our study cohort from the Research Patient Data Registry (RPDR), a central clinical data warehouse maintained by Partners Healthcare System, of which Brigham and Women’s Hospital and Massachusetts General Hospital are members. We included patients if they met the following criteria: (i) underwent cardiac surgery for coronary artery bypass grafting (CABG), valve surgery or combined CABG/valve between January 2005 and January 2018; (ii) history of renal Tx prior to cardiac surgery; and (iii) preoperative (preop) SCr <4 mg/dL and not receiving dialysis at the time of cardiac surgery. We manually reviewed medical records to confirm eligibility. Using the above criteria, we identified 83 RTRs who underwent cardiac surgery (Figure 1).
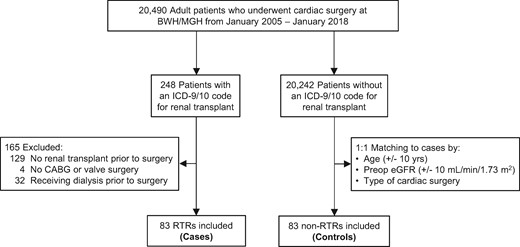
Flow chart for cohort assembly. BWH, Brigham and Women’s Hospital; ICD-9/10, International Classification of Diseases-9th or 10th Revisions; MGH, Massachusetts General Hospital.
Similarly, we used RPDR to identify non-RTRs who underwent cardiac surgery during the same time period. Non-RTRs were matched 1:1 with RTRs according to age (±10 years), preop estimated glomerular filtration rate [eGFR; via Chronic Kidney Disease Epidemiology Collaboration (CKD-EPI), ±10 mL/min/1.73 m2] and type of cardiac surgery (CABG, valve surgery or combined CABG/valve). Thus, our final cohort included 83 RTRs and 83 non-RTRs (Figure 1).
For the medical record review, four individuals (G.L.H., S.A., S.S. and E.B.) used a standardized spreadsheet with prespecified variables to collect patient data. Baseline comorbidities were determined via the admission history and physical exam. For transplant-specific data on RTRs (e.g. prior Tx, prior rejection, etc.), we reviewed all prior transplant nephrology notes.
Primary and secondary outcomes
The primary outcome was postoperative AKI, defined according to the SCr-based criteria established by the Kidney Disease: Improving Global Outcomes (KDIGO) Work Group [31]. Urine output data were not available. AKI was defined as an absolute increase in SCr ≥0.3 mg/dL within 48 h of surgery; a relative increase in SCr ≥50% within 7 days; or dialysis initiation during hospitalization. The immediate preop SCr value was used as the baseline. At the study institutions, SCr is routinely measured at least once daily following cardiac surgery. Secondary outcomes were AKI stage, severe AKI and persistent AKI. AKI stage was defined according to the KDIGO criteria as follows: Stage 1, SCr rise of ≥0.3 mg/dL or from 1.5 to 1.9 times the baseline value; Stage 2, SCr rise from 2.0 to 2.9 times the baseline value; Stage 3, SCr rise to ≥3.0 times the baseline value, an absolute increase in SCr ≥0.3 mg/dL to a value ≥4.0 mg/dL or dialysis initiation. Severe AKI was defined as a doubling of SCr or need for dialysis [13]. Persistent AKI was defined as an SCr at the time of hospital discharge that was ≥0.3 mg/dL above the baseline value [32].
Statistical analysis
We performed statistical analyses using SAS version 9.4 (Cary, NC, USA). We compared baseline characteristics between patients who did or did not develop AKI following cardiac surgery using Student’s t-test and the Wilcoxon rank-sum (Mann–Whitney U) test for normally and non-normally distributed continuous variables, respectively. We used Fisher’s exact test for categorical variables.
Our primary analyses investigated whether RTRs are at higher AKI risk following cardiac surgery compared with non-RTRs. We used univariable and multivariable logistic regression models to estimate odds ratios (ORs) and 95% confidence intervals (CIs) for AKI in RTRs versus non-RTRs. We adjusted for age, preop eGFR and cardiopulmonary bypass (CPB) time [9/166 (5.4%) of surgeries were performed off-pump]. We chose these covariates for inclusion in our models since they are well-known to associate with AKI following cardiac surgery [15, 30]. We performed sensitivity analyses in which we used the lowest SCr value measured 7–365 days prior to cardiac surgery, rather than the immediate preop SCr value, as the baseline value [33]. We also performed sensitivity analyses adjusted for an alternative set of covariates [diabetes mellitus (DM), obesity, smoking status and prior cardiac surgery] determined according to differences in baseline characteristics between RTRs and non-RTRs. Additionally, we performed subgroup analyses assessing whether AKI risk in RTRs versus non-RTRs is modified by baseline or surgical factors. We assessed for effect modification by testing the significance of interaction terms (subgroup * Tx status) introduced into the model.
Our secondary analyses investigated transplant-specific AKI risk factors following cardiac surgery among RTRs. The transplant-specific risk factors to be studied were selected a priori and included donor status [living donor (LD) versus deceased donor (DD)], prior renal allograft rejection, prior renal Tx, time from Tx to cardiac surgery, preop CNI trough levels and original renal disease etiology. We used a similar statistical approach as described above. Additionally, we assessed whether there was an additive increase in AKI risk among RTRs when combining the risk factors of donor status (LD versus DD) and preop CNI trough levels; Fisher’s exact test was used in this analysis. Finally, we assessed rates of Major Adverse Kidney Events (MAKE365) at 1-year post-surgery between those with and without AKI. MAKE365 was defined as an increase in SCr ≥50% at 1 year (measurement closest to 1 year, ±6 months) compared with the preop value, persistent need for dialysis at 1 year or death by 1 year. Missing data (<1% for the variables collected) was not imputed. All P-values are two-sided, with values <0.05 considered significant.
RESULTS
Baseline characteristics in RTRs and non-RTRs
By design, RTRs and non-RTRs had similar age, preop eGFR and cardiac surgical procedures performed (Table 1). Other demographic data, including sex and race, were also similar between the two groups. RTRs had higher rates of hypertension (HTN), DM and statin use. The distribution of other comorbidities and surgical characteristics, including CPB and cross-clamp time, was similar between groups. Of note, intravenous contrast administration was rare [13/166 (7.8% of cohort)] within 2 days before or after cardiac surgery.
Patient characteristics
| Characteristic | RTRs | Non-RTRs | P-valuea | ||||||
|---|---|---|---|---|---|---|---|---|---|
| RTRs versus Non-RTRs | |||||||||
| All RTRs | RTRs with AKI | RTRs without AKI | P-value | All non-RTRs | Non-RTRs with AKI | Non-RTRs without AKI | P-value | ||
| (n = 83) | (n = 38) | (n = 45) | – | (n = 83) | (n = 23) | (n = 60) | – | – | |
| Demographics | |||||||||
| Age [median (IQR)], year | 60 (51–67) | 60 (51–67) | 60 (53–66) | 0.98 | 60 (52–66) | 60 (55–68) | 59 (51–65) | 0.23 | 0.81 |
| Female sex, n (%) | 24 (29) | 12 (32) | 12 (27) | 0.64 | 23 (28) | 4 (17) | 19 (32) | 0.28 | 1.00 |
| White race, n (%) | 70 (84) | 33 (87) | 37 (82) | 0.76 | 72 (87) | 17 (74) | 55 (92) | 0.06 | 0.83 |
| Hospital | 0.82 | 0.14 | 0.12 | ||||||
| Brigham and Women’s Hospital | 37 (45) | 16 (42) | 21 (47) | – | 48 (58) | 10 (43) | 38 (63) | – | – |
| Massachusetts General Hospital | 46 (55) | 22 (58) | 24 (53) | – | 35 (42) | 13 (57) | 22 (37) | – | – |
| Preop renal functionb | – | – | – | – | – | – | – | – | – |
| Creatinine, median (IQR), mg/dL | 1.5 (1.2–1.9) | 1.6 (1.2–2.2) | 1.4 (1.2–1.8) | 0.07 | 1.5 (1.2–1.7) | 1.5 (1.2–2.0) | 1.5 (1.1–1.7) | 0.35 | 0.38 |
| eGFR, median (IQR)c | 46 (35–60) | 45 (33–57) | 47 (38–64) | 0.14 | 48 (39–63) | 47 (35–62) | 49 (40–63) | 0.39 | 0.45 |
| Comorbidities, n (%)d | |||||||||
| Coronary artery disease | 64 (77) | 26 (68) | 38 (84) | 0.12 | 56 (67) | 17 (74) | 39 (65) | 0.60 | 0.22 |
| HTN | 79 (95) | 35 (92) | 44 (98) | 0.33 | 67 (81) | 18 (78) | 49 (82) | 0.76 | 0.007 |
| Congestive heart failure | 35 (42) | 18 (47) | 17 (38) | 0.50 | 43 (52) | 11 (48) | 32 (53) | 0.81 | 0.28 |
| DM | 46 (55) | 22 (58) | 24 (53) | 0.82 | 29 (35) | 7 (30) | 22 (37) | 0.80 | 0.01 |
| COPD | 11 (13) | 5 (13) | 6 (13) | 1.00 | 10 (12) | 2 (9) | 8 (13) | 0.72 | 1.00 |
| Peripheral arterial disease | 18 (22) | 6 (16) | 12 (27) | 0.29 | 9 (11) | 4 (17) | 5 (8) | 0.25 | 0.67 |
| Cerebrovascular disease | 15 (18) | 9 (24) | 6 (13) | 0.26 | 12 (14) | 3 (13) | 9 (15) | 1.00 | 0.53 |
| Active malignancy | 2 (2) | 1 (3) | 1 (2) | 1.00 | 0 (0) | 0 (0) | 0 (0) | − | 0.50 |
| Obesitye | 23/74 (31) | 11/32 (34) | 12/42 (29) | 0.62 | 33/76 (43) | 10/21 (48) | 23/55 (42) | 0.80 | 0.13 |
| Anemiaf | 12 (14) | 8 (21) | 4 (9) | 0.13 | 12 (14) | 5 (22) | 7 (12) | 0.30 | 1.00 |
| Current or former smoker | 39 (47) | 18 (47) | 21 (47) | 0.98 | 30 (36) | 9 (39) | 21 (35) | 0.94 | 0.07 |
| Preop medications, n (%)g | – | – | – | – | – | – | – | – | – |
| ACEi or ARB | 32 (39) | 11 (29) | 21 (47) | 0.12 | 36 (43) | 10 (43) | 26 (43) | 1.00 | 0.64 |
| Diuretic | 39 (47) | 21 (55) | 18 (40) | 0.19 | 33 (40) | 13 (57) | 20 (33) | 0.08 | 0.43 |
| Statin | 58 (70) | 25 (66) | 33 (73) | 0.48 | 41 (49) | 13 (57) | 28 (47) | 0.47 | 0.01 |
| Operation data | – | – | – | – | – | – | – | – | – |
| Type of surgery, n (%) | – | – | – | 0.06 | – | – | – | 0.06 | 1.00 |
| CABG alone | 40 (48) | 13 (34) | 27 (60) | – | 40 (48) | 8 (35) | 32 (53) | – | – |
| Valve alone | 30 (36) | 18 (47) | 12 (27) | – | 30 (36) | 8 (35) | 22 (37) | – | – |
| CABG + valve | 13 (16) | 7 (18) | 6 (13) | – | 13 (16) | 7 (30) | 6 (10) | – | – |
| Urgent/emergent procedure, n (%) | 32 (39) | 14 (37) | 18 (40) | 0.92 | 34 (41) | 9 (39) | 25 (42) | 0.94 | 0.86 |
| Prior cardiac surgery, n (%) | 6 (7) | 4 (11) | 2 (4) | 0.41 | 15 (18) | 6 (26) | 9 (15) | 0.34 | 0.06 |
| CPB time, median (IQR), min | 120 (91–157) | 130 (100–186) | 115 (86–150) | 0.07 | 126 (99–174) | 172 (122–261) | 118 (90–150) | <0.001 | 0.19 |
| Cross-clamp time, median (IQR), min | 93 (61–120) | 104 (73–133) | 91 (53–110) | 0.15 | 95 (71–133) | 133 (97–181) | 89 (64–119) | <0.001 | 0.21 |
| Hospital length of stay, median (IQR), days | 12 (7–19) | 16 (8–21) | 10 (7–14) | 0.02 | 11 (7–19) | 18 (11–22) | 9 (6–16) | 0.008 | 0.34 |
ACEi, angiotensin-converting enzyme inhibitor; ARB, angiotensin II receptor blocker; COPD, chronic obstructive pulmonary disease.
P-value comparing all RTRs vs all non-RTRs.
bPreop creatinine and eGFR were defined as the most recent values measured prior to surgery.
ceGFR was calculated using the CKD-EPI equation.
dComorbidities were assessed at the time of cardiac surgery.
eObesity was defined as a body mass index ≥30 kg/m2.
fAnemia was defined as a hemoglobin level <10 g/dL for the most recent value measured prior to surgery.
gIncluded if received within 24 h prior to surgery.
Transplant-specific characteristics in RTRs
The median [interquartile range (IQR)] time from Tx to cardiac surgery was 6.3 (2.4–9.6 years); 15 (18%) had a prior history of transplant rejection; and 44 (53%) received a DD-transplant. Additional transplant-specific characteristics are shown in Table 2.
Transplant-specific characteristics
| Characteristic | All RTRs (n = 83) | RTRs with AKI (n = 38) | RTRs without AKI (n = 45) | P-value |
|---|---|---|---|---|
| Renal transplant data | ||||
| DD, n (%) | 44 (53) | 25 (66) | 19 (42) | 0.047 |
| Previous rejection, n (%) | 15 (18) | 10 (26) | 5 (11) | 0.07 |
| Prior renal transplant, n (%) | 11 (13) | 6 (16) | 5 (11) | 0.53 |
| Time from Tx to cardiac surgery, median (IQR), year | 6.3 (2.4–9.6) | 6.8 (2.9–9.4) | 6.2 (2.0–9.6) | 0.66 |
| Disease etiologies, n (%) | 0.33 | |||
| Diabetes/HTN | 38 (46) | 14 (37) | 24 (53) | – |
| Glomerular | 25 (30) | 15 (39) | 10 (22) | – |
| Polycystic kidney disease | 10 (12) | 5 (13) | 5 (11) | – |
| Other | 10 (12) | 4 (11) | 6 (13) | – |
| Immunosuppressive medications, n (%) | ||||
| CNI | 74 (89) | 35 (92) | 39 (87) | 0.50 |
| Tacro | 54 (65) | 25 (66) | 29 (64) | – |
| Cs | 20 (24) | 10 (26) | 10 (22) | – |
| Antiproliferative agent | 66 (80) | 29 (76) | 37 (82) | 0.59 |
| Mycophenolate | 51 (61) | 23 (61) | 28 (62) | – |
| Azathioprine | 15 (18) | 6 (16) | 9 (20) | – |
| Sirolimus | 7 (8) | 3 (8) | 4 (9) | 1.00 |
| Corticosteroid | 61 (73) | 31 (82) | 30 (67) | 0.14 |
Prior renal transplant was defined as one or more failed renal allograft(s) prior to the current renal allograft.
Risk of AKI in RTRs versus non-RTRs
RTRs had a higher rate of AKI following cardiac surgery compared with non-RTRs [38/83 (46%) versus 23/83 (28%), P = 0.02] (Figure 2A). When broken down by severity of AKI, there was no significant difference in the rates of Stage 1 AKI (P = 0.20), Stage 2 or 3 AKI (P = 0.18), need for dialysis (P = 0.13) or persistent AKI at hospital discharge (P = 0.66) in RTRs compared to non-RTRs (Figure 2A). In univariable models, RTRs had a 2.20-fold higher odds of AKI compared to non-RTRs (95% CI 1.15–4.20). This association persisted and was strengthened in multivariable models adjusted for age, preop eGFR and CPB time (adjusted OR = 2.77, 95% CI 1.36–5.64; Figure 2B]. There was no significant difference in rates of severe AKI between RTRs and non-RTRs (adjusted OR = 2.03, 95% CI 0.73–5.64; Figure 2C).
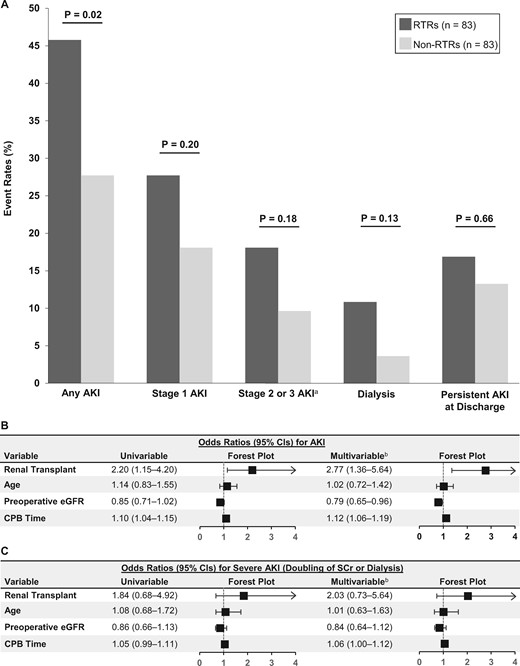
Incidence and severity of AKI in RTRs versus non-RTRs. (A) AKI event rates in RTRs versus non-RTRs. (B and C) Unadjusted and adjusted ORs for any AKI (B) and severe AKI (C). ORs depict the risk of AKI according to renal Tx status (RTR versus non-RTR), age (per 10 years), preop eGFR (per 10 mL/min/1.73 m2) and CPB time (per 10 min). aStage 2 or 3 AKI includes patients who required dialysis. bMultivariable models included the following variables: renal transplant (RTR versus non-RTR), age, preop eGFR and CPB time.
Sensitivity analyses
When we performed the same multivariable analyses as above but with the replacement of the immediate preop SCr with the lowest SCr value in 7–365 days prior to surgery as the baseline value, our results did not materially change (adjusted OR = 3.47 for AKI in RTRs versus non-RTRs, 95% CI 1.75–6.87; Supplementary data, Figure S1). With multivariable analyses adjusted for an alternative set of baseline covariates (DM, obesity, smoking status and prior cardiac surgery), our results again did not materially change (adjusted OR = 2.16 for AKI in RTRs versus non-RTRs, 95% CI 1.05–4.46; Supplementary data, Figure S2).
Risk of AKI in RTRs versus non-RTRs according to subgroups
In assessing the risk of AKI in RTRs versus non-RTRs, we found no evidence of effect modification according to any of the following baseline or surgical risk factors—age, gender, hospital, preop eGFR, congestive heart failure, DM, type of surgery and CPB time (Supplementary data, Figure S3). In addition, there was no significant difference in the incidence of AKI in RTRs versus non-RTRs according to the year the surgery was performed (Supplementary data, Figure S4).
Transplant-specific risk factors for AKI in RTRs
Among RTRs, DD-RTRs had a higher rate of AKI compared with LD-RTRs [25/44 (57%) versus 13/39 (33%), P = 0.047; Figure 3A]. RTRs who had preop tacrolimus (tacro) trough level >8 compared to ≤8 ng/mL had a nonsignificant trend toward higher rates of AKI [6/9 (67%) versus 13/35 (37%), P = 0.11; Figure 3C]. Similarly, RTRs who had preop cyclosporine (Cs) trough level >150 compared to ≤150 ng/mL had higher rates of AKI [5/6 (83%) versus 2/7 (29%), P = 0.05; Figure 3C]. When tacro- and Cs-treated RTRs were analyzed together, those with higher versus lower preop CNI trough levels had higher rates of AKI [11/15 (73%) versus 15/42 (36%), P = 0.02; Figure 3C]. The combination of DD status and higher CNI trough level had an additive effect on the risk of AKI as follows: among those with both risk factors, 7 out of 8 (88%) developed AKI compared with 5 out of 20 (25%) with neither risk factor (P = 0.004), while those with one risk factor only had intermediate AKI rates that were between those with zero and two risk factors (Figure 3D). We found no difference in rates of AKI according to the following risk factors: prior episode of allograft rejection, prior renal Tx, time from Tx to cardiac surgery, CNI regimen (tacro versus Cs) and native kidney disease etiology (Figure 3A, B and E).
![Subgroup analysis of transplant-specific risk factors in RTRs. AKI event rates are shown according to donor status (LD versus DD), prior rejection, prior renal Tx [defined as one or more failed renal allograft(s) prior to the current renal allograft] and time from Tx to cardiac surgery (A); CNI regimen (B); CNI trough level (C); CNI trough level combined with donor status (LD versus DD) (D); and native kidney disease etiology (E). The numbers above the bars represent the no. of events (%); the numbers below the bars represent the total no. of RTRs in each subgroup. aLow CNI trough level was defined as a preop tacro trough level ≤8 ng/mL or a CsA level ≤150 ng/mL; high CNI trough level was defined as a preop tacro trough level >8 ng/mL or a CsA level >150 ng/mL. The CNI trough level used was the most recent measurement within 72 h prior to cardiac surgery. Glom, glomerular disease; PKD, polycystic kidney disease.](https://oup.silverchair-cdn.com/oup/backfile/Content_public/Journal/ndt/36/1/10.1093_ndt_gfaa063/1/m_gfaa063f3.jpeg?Expires=1749898939&Signature=gk0Vg7-AYiFu~qU14RGJk7OYmpAOpXQ~El~VI9cDs9sKen3wcSmYFRaHVVmHutzVV8GdphuSL-eVOrdbX4WKF6IH~8tSmPEeVUrVRS7kkit6x5D4b-vt5~tkgOCyfKNacyvIMaP2sBrGM7n9qGmTWJZxuGlzyadVvOsZ2ujw39DbORcmChiRaKPnb1xC9p0toF35qxgRFG8tkxpeyZwFElSWFwK307rq~sefO9vAkfRuRTdn2Ha1woZMqvOnOEr8~FNHaIMIlyCtN~7iGg1H14NvXg5-67aWaMWNXXz7BFTxxLYWe1ziOOuOJt0CF7jNhm8sg-jD-hjnTT37osUx3A__&Key-Pair-Id=APKAIE5G5CRDK6RD3PGA)
Subgroup analysis of transplant-specific risk factors in RTRs. AKI event rates are shown according to donor status (LD versus DD), prior rejection, prior renal Tx [defined as one or more failed renal allograft(s) prior to the current renal allograft] and time from Tx to cardiac surgery (A); CNI regimen (B); CNI trough level (C); CNI trough level combined with donor status (LD versus DD) (D); and native kidney disease etiology (E). The numbers above the bars represent the no. of events (%); the numbers below the bars represent the total no. of RTRs in each subgroup. aLow CNI trough level was defined as a preop tacro trough level ≤8 ng/mL or a CsA level ≤150 ng/mL; high CNI trough level was defined as a preop tacro trough level >8 ng/mL or a CsA level >150 ng/mL. The CNI trough level used was the most recent measurement within 72 h prior to cardiac surgery. Glom, glomerular disease; PKD, polycystic kidney disease.
Risk of AKI in DD- versus LD-RTRs
Based on our identification of donor status as a significant risk factor for AKI in RTRs, we next examined the incidence and severity of AKI in DD- versus LD-RTRs in greater detail. DD-RTRs compared with LD-RTRs not only had higher rates of AKI overall, but also had higher rates of Stage 2 or 3 AKI and higher rates of persistent AKI at hospital discharge (Figure 4A). In multivariable models adjusted for age, preop eGFR and CPB time, DD-RTRs had a 2.93-fold higher odds of AKI compared with LD-RTRs (95% CI 1.12–7.63; Figure 4B). DD-RTRs also had higher rates of severe AKI compared with LD-RTRs (adjusted OR = 5.15, 95% CI 1.03–25.64; Figure 4C).
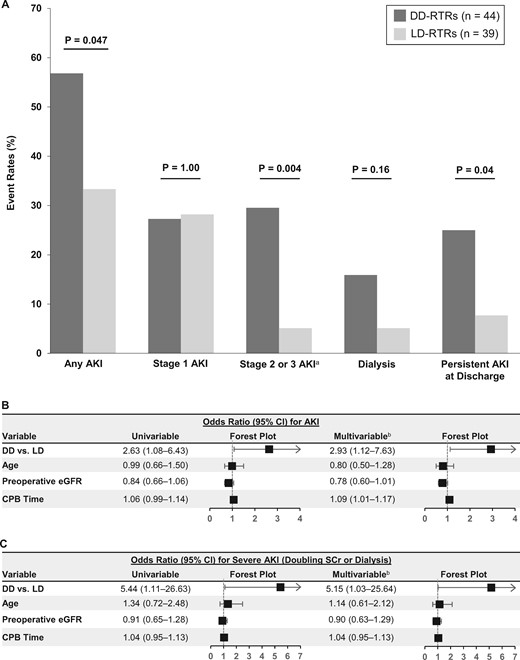
Incidence and severity of AKI in DD- versus LD-RTRs. (A) AKI event rates in DD- versus LD-RTRs. (B and C) Unadjusted and adjusted ORs for any AKI (B) and severe AKI (C). ORs depict risk of AKI according to DD- versus LD-RTR, age (per 10 years), preoperative eGFR (per 10 mL/min/1.73 m2) and CPB time (per 10 min). aStage 2 or 3 AKI includes patients who required dialysis. bMultivariable models included the following variables: donor status (DD- versus LD-RTR), age, preoperative eGFR and CPB time.
Major adverse kidney events at 1-year post-surgery
Follow-up data on kidney function and survival at 1 year were available in 45/83 (54%) and 66/83 (80%) of non-RTRs and RTRs, respectively. Among non-RTRs, 8/45 (18%) met one of the MAKE365 criteria: 5 for the persistent need for dialysis and 3 for death. The incidence of MAKE365 among non-RTRs with and without AKI was 36.4 and 11.8%, respectively (OR = 4.29, 95% CI 0.86–21.48). Among RTRs, 11/66 (17%) met one of the MAKE365 criteria: 1 for an increase in SCr to ≥50% of the preop value, 4 for persistent need for dialysis and 6 for death. The incidence of MAKE365 among RTRs with and without AKI was 33.3% and 2.78%, respectively (OR = 17.5, 95% CI 2.08–146.93).
DISCUSSION
In this retrospective cohort study, we found that RTRs are at higher risk of developing AKI following cardiac surgery compared with non-RTRs independent of age, preop eGFR, type of surgery and duration of CPB. Additionally, we found that among RTRs the risk of AKI is substantially higher in DD-RTRs compared with LD-RTRs. This increased risk was particularly pronounced for severe AKI, as DD-RTRs had >5-fold higher odds of severe AKI compared with LD-RTRs. Additionally, RTRs with higher preop CNI trough levels were at higher risk for AKI compared with RTRs with lower CNI trough levels. RTRs with both risk factors—namely, DD status as well as higher preop CNI trough levels—were at the highest risk of AKI, with 7 out of 8 RTRs (88%) in this category developing AKI compared with only 5 out of 20 RTRs (25%) with neither risk factor.
Our study expands on prior studies that reported the incidence and long-term outcomes of all-cause AKI in RTRs. Nakamura et al. [27] reported that 20% of RTRs develop AKI from a variety of etiologies at 3 months or later following Tx, and that development of AKI is associated with higher rates of graft failure. Mehrotra et al. [26] reported that 11% of RTRs are hospitalized for AKI, and that the development of AKI is associated with higher rates of both graft failure and death. A recent study by Alkandari et al. [28] reported that 37% of pediatric RTRs develop AKI within 12 years of follow-up, and that AKI is associated with higher rates of CKD progression and graft loss. Importantly, these studies demonstrate that AKI is common in RTRs, and that development of AKI in this patient population represents a substantial risk for graft failure and death [26–28]. However, these studies generally did not assess AKI caused by a common trigger (e.g. cardiac surgery), did not include a comparator group and, in some cases [26], defined AKI based on diagnostic or billing codes, which are insensitive for detecting mild-to-moderate AKI [29]. Accordingly, these studies were not well suited to address the question of whether RTRs are at heightened risk of AKI compared with non-RTRs with otherwise similar clinical characteristics.
In this regard, our study has several strengths. By focusing on AKI following cardiac surgery, a setting in which the timing of renal injury is known, we were able to compare the incidence and severity of AKI in RTRs versus non-RTRs. Non-RTRs were rigorously matched to RTRs according to age, preop eGFR and type of cardiac surgery. Importantly, though not directly matched on, CPB time was also similar between RTRs and non-RTRs. In two separate multivariable models using alternative sets of covariates, we established that the increased risk of AKI in RTRs compared with non-RTRs is independent of a number of potential confounders including not only age, preop eGFR and CPB time (initial model, Figure 2B), but also DM, smoking status, obesity and prior history of cardiac surgery (alternative model, Supplementary data, Figure S2). Finally, by manually reviewing medical records, we were able to capture highly granular data, including detailed data on transplant-specific factors. This allowed us to identify a strong association between donor status (DD-RTR versus LD-RTR) as well as CNI trough levels and risk of AKI.
The pathophysiology of cardiac surgery-associated AKI is multifactorial and includes renal ischemia–reperfusion injury, inflammation, oxidative stress, hemolysis and perioperative exposure to nephrotoxic medications [34]. The results from this study beg the question: why are RTRs, and in particular DD-RTRs, at higher risk for AKI following cardiac surgery? Our study was not designed specifically to address this question; however, several potential mechanisms could be postulated. First, RTRs may have decreased renal reserve due to decreased overall nephron mass, which may not be fully reflected by the preop eGFR [10, 11]. Compared with LD kidneys, DD kidneys experience more severe ischemia–reperfusion injury at the time of Tx related to longer periods of ischemia and inferior donor quality [9]. Indeed, DD kidneys have been shown to have greater degrees of vascular disease, endothelial dysfunction and glomerulosclerosis, which may limit their repair capacity and increase their susceptibility to AKI [35]. Our finding of higher AKI rates among DD-RTRs is consistent with prior studies showing that DD-RTRs experience higher rates of graft failure and rejection compared with LD-RTRs [36, 37]. Second, the vast majority of the RTRs in our study were maintained on CNIs as part of their immunosuppression regimen. The nephrotoxic effects of CNIs are well-described and include: afferent arteriolar vasoconstriction; chronic glomerular, vascular and tubular damage; HTN; and thrombotic microangiopathy [38, 39]. Supporting this notion, we found that RTRs with higher preop CNI trough levels had higher rates of AKI compared with RTRs with lower preop CNI trough levels. We defined high preop CNI trough levels as tacro >8 ng/mL or Cs >150 ng/mL. These thresholds were selected as they exceed the target CNI trough levels after 1-year post-kidney transplant at the study institutions (tacro 5–8 ng/mL; Cs 100–150 ng/mL) and align with prior studies [40–43]. Whether minimization of CNI levels prior to cardiac surgery will minimize this risk is a potential area for future study. Third, immune-related mechanisms of allograft injury in RTRs may be exacerbated during periods of allograft ischemia [44]. Any of these mechanisms, alone or in combination, could potentially exacerbate the hemodynamic/ischemic insults inherent to cardiac surgery.
We acknowledge several limitations, including observational design. First, although we matched non-RTRs to RTRs 1:1 on the basis of age, preop eGFR and type of cardiac surgery, and also performed multivariable-adjusted analyses and sensitivity analyses that included CPB time and other covariates, we cannot exclude potential residual confounding. Based on the limited cohort size and number of events, the inclusion of additional potential confounding variables in our analyses could have resulted in over-fitting of our models. Second, since urine output data were not available, we relied on SCr values alone to define AKI, which may have underestimated the incidence of AKI. However, data suggest that the current KDIGO criteria used to define AKI solely based on urine output (<0.5 mL/kg/h for ≥6 h) may be too liberal and may detect mild cases of AKI that do not necessarily associate with hard clinical endpoints such as in-hospital dialysis or death [45]. Third, data on proteinuria would have been informative as a risk factor for AKI; however, the vast majority of patients in our study did not have preop proteinuria quantification performed. Fourth, we did not have access to data on intake and output in the perioperative period, which could have led to an underestimate of AKI incidence or severity due to hemodilution of SCr [46]. However, this effect would be unlikely to bias our results, particularly as RTRs were matched to non-RTRs according to type of surgery, and duration of CPB was similar between the two groups. We also did not have information regarding the requirement for blood transfusion perioperatively, which may associate with AKI incidence. Fifth, we did not have access to data on donor characteristics such as age, kidney function, human leukocyte antigen mismatch, cold ischemia time or type of DD (standard versus expanded criteria), as well as certain recipient characteristics such as time from Tx to cardiac surgery. Sixth, several of the sub-analyses on the effects of transplant-specific risk factors on AKI (e.g. CNI trough levels, history of rejection, etc.) should be considered exploratory in nature given both the small sample size and small number of AKI events. Seventh, follow-up data on kidney function at 1-year (MAKE365 outcome) was not available for the entire cohort; these missing data were more prevalent with non-RTRs than RTRs. Finally, despite our cohort involving two large academic medical centers that performed >20 000 cardiac surgeries during the timeframe examined, the number of RTRs undergoing cardiac surgery was modest. Nonetheless, our sample size was larger than several prior studies on AKI among RTRs, and is the largest to date to report granular patient-level data [47, 48].
In conclusion, we found that RTRs are at a higher risk for AKI following cardiac surgery compared with non-RTRs. Among RTRs, DD status and higher preop CNI trough levels are strong and independent risk factors for AKI. Both physicians and RTRs should be informed of this increased susceptibility to AKI prior to undergoing cardiac surgery. RTRs should be counseled on their heightened susceptibility to AKI during cardiac surgery (and potentially other settings as well) and that this may have negative consequences on their long-term allograft function. If the procedure is elective, then understanding this heightened AKI risk may allow for a more informed decision of the pros and cons of the procedure. Future studies are necessary to determine what preventive measures (e.g. minimization of CNI levels in the immediate preop period), if any, may be taken for RTRs so as to potentially attenuate the risk of AKI in the renal transplant population. Given the high rate of AKI in RTRs, efforts should be made to investigate the use of novel biomarkers [49, 50] to aid in early diagnosis and management of AKI in this population. Additional research is also needed to study whether RTRs are at heightened risk of AKI in other clinical settings, such as sepsis, volume depletion, contrast exposure and non-cardiac surgery, and whether AKI occurring in these settings could represent an important cause of long-term renal allograft failure (Supplementary data, Figure S5).
SUPPLEMENTARY DATA
Supplementary data are available at ndt online.
ACKNOWLEDGEMENTS
We thank Sayeed K. Malek for his assistance with identifying patients for our study.
FUNDING
G.L.H. is supported by a Kidney Research Scientist Core Education and National Training Program New Investigator Award from the Kidney Foundation of Canada. D.E.L. is supported by K23DK106448 from the National Institutes of Health/National Institute of Diabetes and Digestive and Kidney Diseases and by an American Society of Nephrology Foundation for Kidney Research Carl W. Gottschalk Research Scholar Grant.
AUTHORS’ CONTRIBUTIONS
G.L.H., A.S., L.V.R. and D.E.L. designed the study. G.L.H., A.S., K.A.J., N.K., S.A., E.B., S.S., S.A.H., W.K. and D.E.L. collected the data. G.L.H. and D.E.L. performed the analyses. G.L.H., A.S., K.A.J., N.K., S.A., E.B., S.S., S.A.H., M.P.P., K.S., W.K., J.A.K., L.V.R. and D.E.L. analyzed and interpreted the data. G.L.H. and D.E.L. wrote the article and had primary responsibility for the final content. All authors contributed to the revision and final approval of the manuscript.
CONFLICT OF INTEREST STATEMENT
The authors declare no conflicts of interest. The results presented in this article have not been published previously in whole or part.


Comments