


Abstract
Ischemic stroke (IS) is a leading cause of morbidity and mortality world-wide.
Patients with chronic kidney disease (CKD) have an increased ischemic stroke risk. Stroke risk scores, including the CHA2DS2-VASc, CHADS2, ATRIA, GARFIELD, AFI and the modified-CHADS2, have been developed to identify patients with an increased stroke risk in patients with atrial fibrillation (AF) allowing for personalization of anticoagulant prescription. In the original articles, these risk scores had reasonable predictive abilities. However, the predictive performances of these stroke risk in patients with CKD is unclear. Therefore, the aim of this study was to validate existing stroke risk scores in patients with AF and different stages of CKD.
The study included subjects with newly-diagnosed AF from the SCREAM (Stockholm CREAtinine Measurements) database, a healthcare utilization cohort of residents from Stockholm, Sweden, during 2007-2011. The performance of prediction models were compared across eGFR strata: normal (KDIGO classification G1-2; eGFR >60) mild (G3; eGFR 30-60) and advanced (G4-5; eGFR <30, not on dialysis) CKD. Model discrimination was evaluated through c-statistics, and calibration by plotting predicted probabilities and observed frequencies for IS.
A total of 36.004 subjects with AF and known eGFR were identified. During a median follow up of 1.91 years, 2572 (7.1%) suffered an ischemic stroke. The incidence rate of stroke increased across lower eGFR strata: from 6.3% in patients with eGFR>60 to 10.4% and 7.3% in patients with eGFR 30-60 and <30. Predictive performance of the stroke risk models was moderate-to-good in patients normal eGFR, but worsened with lower eGFR strata: C-statistics ranged from 0.68 to 0.77 for patients with normal (G1-2) eGFR, 0.58 to 0.72 for mild (G3) CKD, and 0.53 to 0.70 for patients with advanced (G4-5) CKD (Table). The modified-CHADS2 showed the best predictive performance in all CKD groups. Calibration plots (Figure 1) showed that the predicted risk was higher than the observed risk for almost all stroke risk models, independent of CKD status. The modified-CHADS2 showed slightly higher predicted risks than the observed risks (Figure) and has the most accurate ability (almost equal observed and predicted risks) in CKD patients.
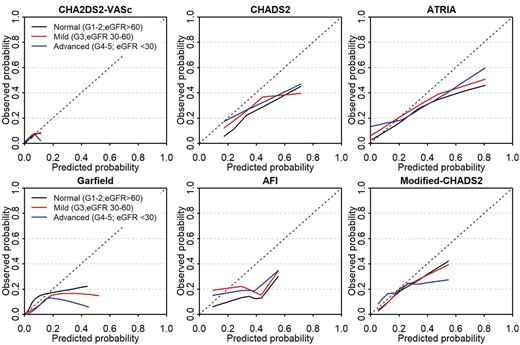
calibration plots of included prediction models for ischemic stroke.
The predictive performance of models for IS in a large cohort of AF patients decreased with decreasing kidney function. Predictions became less accurate in the clinically more relevant final stages of CKD. Therefore, most commonly used stroke risk models may not be useful for guiding individual decision-making in patients with CKD. The modified-CHADS2 score showed good and consistent discrimination and calibration, in AF patients normal eGFR, as well as in mild and advanced CKD, and would therefore be the preferred option for use in clinical practice in AF patients with CKD.
Table: Discrimination of included models C-statistic with 95% CI, stratified per KDIGO-CKD stage.
| CKD stage | Normal (G1-2) | Mild CKD (G3) | Advanced CKD (G4-5) |
|---|---|---|---|
| Total / strokes (%) | 26 249/1 625 (6.3) | 8.625/866 (10.4) | 1.130/82 (7.3) |
| CHA2DS2-VASc | 0.68 (0.67-0.70) | 0.58 (0.55-0.60) | 0.55 (0.48-0.62) |
| CHADS2 | 0.69 (0.68-0.70) | 0.61 (0.59-0.63) | 0.58 (0.52-0.64) |
| ATRIA | 0.73 (0.72-0.74) | 0.65 (0.63-0.67) | 0.61 (0.55-0.68) |
| Garfield | 0.75 (0.73-0.76) | 0.68 (0.66-0.70) | 0.68 (0.62-0.75) |
| AFI | 0.67 (0.65-0.68) | 0.58 (0.56-0.59) | 0.53 (0.48-0.58) |
| Modified-CHADS2 | 0.77 (0.75-0.78) | 0.72 (0.70-0.73) | 0.70 (0.64-0.76) |


Comments