


Abstract
Chronic kidney disease (CKD) leads to insulin resistance (IR) and sarcopenia, which are associated with a high mortality risk in CKD patients; however, their pathophysiologies remain unclear. Recently, alterations in gut microbiota have been reported to be associated with CKD. We aimed to determine whether uremic dysbiosis contributes to CKD-associated IR and sarcopenia.
CKD was induced in specific pathogen-free mice via an adenine-containing diet; control animals were fed a normal diet. Fecal microbiota transplantation (FMT) was performed by oral gavage in healthy germ-free mice using cecal bacterial samples obtained from either control mice (control-FMT) or CKD mice (CKD-FMT). Vehicle mice were gavaged with sterile phosphate-buffered saline. Two weeks after inoculation, mice phenotypes, including IR and sarcopenia, were evaluated.
IR and sarcopenia were evident in CKD mice compared with control mice. These features were reproduced in CKD-FMT mice compared with control-FMT and vehicle mice with attenuated insulin-induced signal transduction and mitochondrial dysfunction in skeletal muscles. Intestinal tight junction protein expression and adipocyte sizes were lower in CKD-FMT mice than in control-FMT mice. Furthermore, CKD-FMT mice showed systemic microinflammation, increased concentrations of serum uremic solutes, fecal bacterial fermentation products and elevated lipid content in skeletal muscle. The differences in gut microbiota between CKD and control mice were mostly consistent between CKD-FMT and control-FMT mice.
Uremic dysbiosis induces IR and sarcopenia, leaky gut and lipodystrophy.
What is already known about this subject?
Chronic kidney disease (CKD) leads to insulin resistance (IR) and sarcopenia, which are associated with a high mortality risk in CKD patients; however, their pathophysiologies remain unclear.
Alterations in gut microbiota have been reported to be associated with CKD.
Whether CKD-induced dysbiosis contributes to CKD-induced IR and sarcopenia has not been fully elucidated.
What this study adds?
Fecal microbiota transplantation (FMT) was performed by oral gavage in healthy germ-free mice using cecal bacterial samples obtained from either control mice (control-FMT) or CKD mice (CKD-FMT) and we determined whether uremic dysbiosis contributes to CKD-associated IR and sarcopenia.
IR and sarcopenia were evident in CKD mice compared with control mice, the features of which were reproduced in CKD-FMT mice compared with control-FMT and vehicle mice with attenuated insulin-induced signal transduction, mitochondrial dysfunction in skeletal muscles, reduced expression of gut tight junction protein and reduced adipocyte size.
Uremic dysbiosis induces IR and sarcopenia, leaky gut and lipodystrophy.
What impact this may have on practice or policy?
Uremic dysbiosis causes microinflammation by enhancing intestinal permeability and leads to changes in serum concentrations of uremic solutes, presumably through an increase in bacterial fermentation product levels and intestinal permeability.
An increase in Allobaculum number and decrease in Lactonifactor number may contribute to IR and sarcopenia states.
Uremic dysbiosis may be a novel therapeutic target against metabolic and sarcopenic phenotypes in CKD patients.
INTRODUCTION
Insulin resistance (IR) is a clinical condition characterized by reduced biological effect for a given blood concentration of insulin. IR has been reported in chronic kidney disease (CKD) patients; however, its etiology remains unclear [1, 2]. IR has several effects on uremic phenotypes, including sarcopenia, defined as reduced exercise capacity and skeletal muscle mass [3]. Under CKD conditions, the link between impaired insulin/insulin-like growth factor 1 (IGF-1) signaling in the muscle and muscle wasting through decreased protein kinase B (Akt) phosphorylation has been demonstrated [4]. IR in CKD also results in renal lipodystrophy, characterized by impaired adipocyte maturation. We demonstrated that impaired insulin signaling in nephrectomized rats leads to decreased adipose tissue weight, adipocyte size and expression levels of adipocyte differentiation markers, including peroxisome proliferator-activated receptor (PPAR)-γ in the adipose tissue, as IR consequences [5].
Uremia alters the microbiome composition and epithelial barrier function of the gut. This relationship is referred to as the kidney–gut axis [6]. Previous studies have shown that there are significant differences in the populations of bacterial subfamilies between control (healthy) subjects and CKD patients/animal models [6, 7]. Another study showed that CKD led to decreased levels of the tight junction proteins occludin, claudin-1 and zonula occludens-1 ( ZO-1) in the colonic mucosa [8]. Intestinal barrier damage increased permeability to uremic solutes and inflammatory cytokines. This phenomenon explains why systemic inflammation was observed in CKD mice induced by subtotal nephrectomy or an adenine-containing diet [9]. However, whether CKD-induced dysbiosis contributes to CKD-induced IR and sarcopenia has not been fully elucidated.
In this study we performed fecal microbiota transplantation (FMT) in which germ-free (GF) mice were recipients and uremic mice were donors. Using a gnotobiotic animal model, we demonstrated that uremic dysbiosis directly contributes to IR and sarcopenia in a CKD model.
MATERIALS AND METHODS
Animal experiments
All animal experiments were approved by the Institutional Animal Care and Use Committee [approval #17011-(1)] and performed according to the animal experimentation guidelines of the Keio University School of Medicine. These guidelines are based on the National Institutes of Health (NIH) Guide for the Care and Use of Laboratory Animals. ICR-specific pathogen-free (SPF) male mice (CLEA Japan, Tokyo, Japan) were fed a sterilized standard diet (CE-2; CLEA Japan) and provided access to tap water ad libitum. Animals 7 weeks of age were randomly sorted into control and adenine-induced CKD groups. Control mice were fed a normal diet, whereas the CKD group was given CE-2 supplemented with 0.2% adenine (Wako, Osaka, Japan) for 6 weeks. GF ICR male mice (Sankyo Labo Service Corporation, Tokyo, Japan) were bred in vinyl isolators and given sterilized CE-2 and water ad libitum. Bacterial contamination was periodically assessed by bacteriological examination throughout the experimental period. Additionally, we prepared 5/6 nephrectomy mice via heminephrectomy and polectomy when the mice were 7 (1/2 nephrectomy) and 8 (polectomy of remaining 1/3 nephrectomy) weeks of age, as previously described [10]. The 5/6 nephrectomy mice were sacrificed at the age of 13 weeks; this age was comparable to that of the control and adenine-induced CKD mice. GF mice 8 weeks of age were randomly assigned into three groups: the mice receiving FMT from control mice (control-FMT), the mice receiving FMT from adenine-induced CKD mice (CKD-FMT) and the vehicle mice that received an oral gavage of phosphate-buffered saline (PBS; 0.1 mol/L, pH 7.2). All mice were fed a normal diet for 2 weeks (Supplementary data, Figure S1). After 2 weeks, the mice were weighed and euthanized and epididymal white adipose tissues (EWATs) and gastrocnemius and soleus muscles were harvested and weighed. The liver, ascending colon and cecum content were also harvested. All tissues were snap frozen in liquid nitrogen and stored at −80°C. Blood samples were collected from the orbital venous plexus, tail vein or inferior vena cava. For histological examination, EWAT was fixed and used to determine adipocyte size, as previously described [10]. The gastrocnemius muscle was sliced and frozen using liquid nitrogen–chilled isopentane. Frozen sections were stained with hematoxylin–eosin (HE) and succinate dehydrogenase (SDH), according to a previously described protocol [11, 12].
Metabolic measurements
A metabolic cage (KN-645, Natsume Seisakusho, Tokyo, Japan) was used to measure chow consumption and urine volume individually for 24 h. A biogas analytical mass spectrometer (ARCO-2000, Arco System, Chiba, Japan) was used to determine oxygen consumption in individually caged mice, as previously described [13]. Oxygen consumption data are presented as milliliters per minute or per day per kilogram of total body weight (BW).
Biochemical measurements
Serum creatinine, urea nitrogen (UN), triglyceride (TG), free fatty acid (FFA) and total cholesterol (TC) levels were measured as previously described [5]. Serum interleukin-6 (IL-6) concentrations were measured using commercial enzyme-linked immunosorbent assay kits (insulin: Morinaga Institute of Biological Science, Yokohama, Japan; IL-6: R&D Systems, Minneapolis, MN, USA). Liquid chromatography–tandem mass spectrometry was used to measure serum and urinary indoxyl sulfate (IS), p-cresyl sulfate (PCS), phenyl sulfate (PhS), indole-3-acetic acid (IAA) and hippuric acid (HA) [14]. Urinary excretion (mg/day) and renal clearance (mL/day) of these uremic solutes were calculated using 24-h urine volume. Selective ion monitoring gas chromatography–mass spectrometry was used to measure fecal concentrations of indole, p-cresol and phenol [15]. Lipids from the gastrocnemius muscle and liver were extracted using chloroform methanol [16] and TG contents were estimated using a commercially available kit (Sekisui Medical, Tokyo, Japan).
Collection of fecal samples from SPF mice and FMT into GF mice
Ceca from euthanized donor mice were aseptically removed. Pooled cecal materials from the control and CKD groups (n = 4–5 per group) were homogenized and diluted 1:10 in sterile PBS [16]. In the independent experiment of gut microbiota analysis, half the donor mice cecal samples were used for FMT and the remaining half were used for gut bacteria analysis. The suspension was settled by gravity for 5 min and the clarified supernatant was stored at −80°C. On the day of inoculation, a 200-μL aliquot of the suspension or PBS was administered via a single oral gavage using a 1-mL syringe and flexible plastic tube in each ICR GF recipient’s stomach. GF mice were divided into three experimental groups: GF mice that were treated with PBS (vehicle mice), normal GF mice that were subjected to FMT with feces from normal mice (control-FMT) and normal GF mice that were subjected to FMT with feces from adenine-treated CKD mice (CKD-FMT). The recipient mice were maintained in separate isolators with a GF diet and were never subjected to any kidney intervention. FMT was performed once, as the results of previous FMT studies indicated that the characteristics of gut microbiota persisted from donor mice to recipient GF mice at 2 and 4 weeks after only one colonization, with the reproduction of donor mice phenotype in the recipient mice [17, 18].
Glucose and insulin tolerance test
An intraperitoneal glucose tolerance test (IPGTT) was performed as previously described [19]. Mice underwent the insulin tolerance test (ITT) via intraperitoneal injection of regular insulin (Humalin R-Insulin; Eli Lilly, Indianapolis, IN, USA), as previously described [10].
Western blot analysis
Immunoblotting analysis was performed as previously described [10]. Blots were incubated with primary antibodies against Akt (#8805), phospho-Akt (Ser473, #81283) and S6 kinase beta-1 (S6K1, #32359; Abcam Japan, Tokyo, Japan); phospho-S6K1 (Thr389, #108D2) and β-actin (#4967; Cell Signaling Technology, Danvers, MA, USA); occludin (#167161) and claudin-1 (#180158; Abcam Japan) and ZO-1 (#61-7300; Invitrogen, Auckland, NZ), followed by incubation with a secondary antibody (HRP-linked anti-rabbit IgG, #6721; Abcam, Japan). Band intensities were quantified and normalized using appropriate proteins with ImageJ software (National Institutes of Health, Bethesda, MD, USA). For the analysis of EWAT, gastrocnemius muscle and liver, we intraperitoneally injected 1 U/kg of regular insulin 5–10 min before they were harvested.
RNA extraction and real-time polymerase chain reaction (PCR)
RNA extraction and quantitative real-time PCR were performed as previously described [20]. Messenger RNA (mRNA) levels were measured for the following genes: mitochondrial transcription factor A (Tfam), PPAR-γ coactivator 1α (PGC-1α), cytochrome c oxidase subunit IV (COX IV), adenosine triphosphate (ATP) synthase (ATPsyn), PTEN-induced putative kinase 1 (PINK1) BCL2/adenovirus E1B 19 kDa protein-interacting protein 3-like (BNIP3L), PPAR-δ and troponin I. Primers are shown in Supplementary data, Table S1. mRNA levels were normalized to those of housekeeping genes.
Exercise capacity measurements
Grip power and running distance were measured using a mouse dynamometer (MK-380M, Muromachi Kikai, Tokyo, Japan) and a mouse treadmill (LE8710M, PanLab, Barcelona, Spain), as previously described [11].
Gut bacteria analysis
Bacterial DNA was extracted from fecal samples and PCR was used to amplify the V3–V4 region of 16S ribosomal RNA (rRNA), as previously described [21, 22]. PCR amplicons were sequenced using Miseq (Illumina, San Diego, CA), according to the manufacturer’s instructions; 16S rRNA gene reads with an average quality value <20 and those containing chimeric sequences detected by usearch.1.544_i86 were filtered out [21, 23]. The filter-passed 16S rRNA reads were analyzed using Ribosomal Database Project MultiClassifier version 2.11 and QIIME 1.8.0; the 16S sequences were used for operational taxonomic unit (OTU) assignment for the Greengenes Database and principal coordinates analysis (PCoA) of weighed Unifrac distance [24, 25].
Cell culture
Mouse C2C12 myoblast cells were acquired, grown and differentiated into myotubes, as previously described [11].
Media supplemented with 4% fetal bovine serum albumin and uremic solutes (IS, PhS and HA) were used to culture C2C12 myotubes for 24 h, with their concentrations comparable to those of CKD-FMT mice of our in vivo study. The concentrations of IS, PhS and HA were 0.17 mg/dL (8.2 μM), 0.17 mg/dL (10 μM) and 0.083 mg/dL (4.6 μM), respectively. The effect of each uremic solute with their mixed effects was analyzed (IS, PhS and HA). Because IS and PhS were synthesized in potassium salt, we added potassium chloride in each control to achieve the same concentration in the potassium salt of IS (8.2 μM), PhS (10 µM) or mixed solution of uremic solutes (18.2 µM). C2C12 myotubes were stimulated for 20 min with 100 nM insulin and analyzed after 24 h of incubation.
Statistical analysis
Data expressed as mean ± standard error were analyzed using unpaired Student’s t-test or one-way analysis of variance (ANOVA), followed by a Bonferroni post hoc test. A P-value <0.05 was considered statistically significant.
RESULTS
IR is evident in adenine-induced CKD mice
Compared with control mice, adenine-induced CKD mice showed significantly elevated levels of serum urea and creatinine. Fasting insulin concentrations were elevated in CKD mice; fasting blood glucose (FBG) concentrations were not different, suggesting IR development. The TG level remained unaltered, the TC level increased and the FFA level decreased in CKD mice (Table 1). IPGTT revealed impaired glucose tolerance in CKD mice (Figure 1A). ITT demonstrated a blunted decline in glucose concentration among CKD mice (Figure 1B). We examined insulin signaling activation in the adipose tissue, skeletal muscle and liver. Compared with control mice, phosphorylated Akt levels decreased in the adipose and muscle tissues of CKD mice after stimulation with insulin. However, phosphorylated Akt levels were not significantly different between groups in the liver tissue (Figure 1C). Compared with control mice, CKD mice showed significantly decreased BW as well as a significant decrease in the percent change in BW, gastrocnemius and soleus muscle masses and EWAT (Table 1 and Figure 1D). Oxygen consumption was significantly higher in CKD mice than in the control mice, particularly during the light phase, whereas chow consumption was not significantly different between the groups (Supplementary data, Figure S2A–C). Therefore we suspected that increased energy expenditure overwhelming energy intake from the diet in CKD mice leads to decreased BW that is accompanied by decreased adipose tissue. Ectopic lipid accumulation assessment revealed that compared with control mice, CKD mice showed significantly elevated TG content in the gastrocnemius muscle. However, TG levels in the liver were not significantly different between the groups (Figure 1D). Adipose tissue atrophy and ectopic lipid accumulation correspond to the state of the lipodystrophy-like phenotype in CKD.
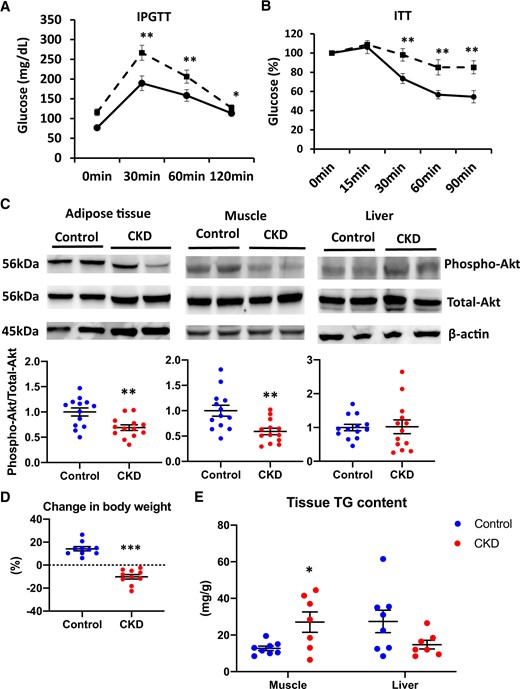
Impaired glucose tolerance and IR in adenine-induced CKD mice compared with control mice. The results of the (A) IPGTT and (B) ITT in control mice (solid line) and adenine-induced CKD mice (dashed line) (n = 10 per group). (C) The levels of phospho-Akt after insulin stimulation in the adipose tissue (left panel), muscle tissue (middle panel) and liver tissue (right panel) of two experimental groups (control, blue dots; CKD, red dots). The blots for total-Akt are shown as loading controls. The representative results in three independent experiments are shown (n = 13 per group). (D) The percent change in BW from 7 to 13 weeks of age among the two experimental groups (n = 10 per group). (E) The lipid accumulation of muscle and liver tissues of two experimental groups was examined by the measurement of tissue TG content (n = 8 per group). *P < 0.05, **P < 0.01, ***P < 0.001 versus the control group. Bar represents mean ± standard error of the mean.
Basic characteristics of control and adenine-induced CKD mice or vehicle, control-FMT and CKD-FMT mice
| Parameters | CKD mice experiment | FMT experiment | |||
|---|---|---|---|---|---|
| Control | CKD | Vehicle | Control-FMT | CKD-FMT | |
| BW (g) | 41.2 ± 0.6 | 32.6 ± 0.9*** | 38.8 ± 0.6 | 41.0 ± 1.1 | 40.8 ± 0.5 |
| Gastrocnemius muscle (mg) | 306.2 ± 10.0 | 214.8 ± 7.6*** | 243.2 ± 6.7 | 300.6 ± 10.4## | 265.6 ± 8.0** |
| Soleus muscle (mg) | 19.6 ± 0.8 | 13.3 ± 0.8*** | 13.3 ± 1.2 | 19.7 ± 1.1## | 16.5 ± 0.7* |
| Epididymal fat (mg) | 626.0 ± 60.1 | 109.0 ± 35.6*** | 478.9.0 ± 33.0 | 815.4 ± 33.5### | 651.6 ± 24.4### *** |
| UN (mg/dL) | 24.5 ± 2.0 | 80.3 ± 6.5*** | 22.5 ± 1.8 | 18.5 ± 1.2 | 17.9 ± 1.1 |
| Creatinine (mg/dL) | 0.17 ± 0.02 | 0.56 ± 0.05*** | 0.11 ± 0.005 | 0.09 ± 0.004 | 0.10 ± 0.004 |
| FBS (mg/dL) | 141.4 ± 13.7 | 153.0 ± 13.6 | 169.0 ± 4.3 | 186.0 ± 8.7 | 186.8 ± 6.3 |
| Insulin (ng/mL) | 0.10 ± 0.03 | 0.34 ± 0.07** | 0.20 ± 0.04 | 0.20 ± 0.08 | 0.20 ± 0.04 |
| Aldosterone (pg/mL) | 578.6 ± 136.6 | 2445.0 ± 481.4** | 478.1 ± 94.3 | 487.5 ± 68.3 | 354.4 ± 45.1 |
| Total protein (g/dL) | 4.7 ± 0.09 | 4.5 ± 0.11 | 4.7 ± 0.12 | 4.5 ± 0.10 | 4.4 ± 0.12 |
| TG (mg/dL) | 71.4 ± 5.9 | 77.4 ± 8.6 | 48.9 ± 6.7 | 90.5 ± 9.3## | 90.5 ± 11.5# |
| FFA (μEq/L) | 1693.3 ± 68.1 | 1240.1 ± 84.3*** | 1202.4 ± 107.3 | 1461.9 ± 62.9 | 1351.1 ± 53.6 |
| TC (mg/dL) | 105.1 ± 4.6 | 142.4 ± 4.1*** | 117.9 ± 8.8 | 116.7 ± 5.2 | 117.3 ± 7.4 |
Values presented as mean ± standard deviation.
P < 0.05,
P < 0.01,
P < 0.001 versus vehicle mice.
P < 0.05,
P < 0.01,
P < 0.001 versus control mice or control-FMT group.
FMT from CKD mice induces IR in recipient mice
In the FMT experiment, we compared phenotypes among the groups: healthy GF mice receiving fecal samples from CKD mice (CKD-FMT mice), mice receiving feces from control mice (control-FMT mice) and mice receiving PBS (vehicle mice). The concentrations of serum creatinine and blood UN were not different among the vehicle-treated mice, control-FMT mice and CKD-FMT mice, since all the recipient GF mice had normal renal function and were never subjected to renal interventions (Table 1). Although FBG and blood insulin concentrations were not different among the three groups (Table 1), IPGTT revealed impaired glucose tolerance in control-FMT mice compared with that in vehicle mice. Impaired glucose tolerance was aggravated in CKD-FMT mice compared with control-FMT mice (Figure 2A). ITT revealed that there was a blunted decline in the glucose concentration in control-FMT mice compared with that in vehicle mice. Additionally, compared with control-FMT mice, CKD-FMT mice exhibited a blunted decline in glucose concentration (Figure 2B). Impaired glucose tolerance in IPGTT and IR in ITT were also evident in mice receiving FMT from CKD mice compared with mice receiving FMT from control mice 4 weeks after the inoculation (Supplementary data, Figure S3A and B). This indicates that only one colonization was satisfactory to reproduce the phenotype caused by gut microbiota of the donor mice after 2 weeks and even after 4 weeks, despite possible gradual transformation in gut microbiota back to normal after FMT. Fasting TG levels were significantly higher in control-FMT mice than in vehicle mice; however, TG levels were not different between control-FMT and CKD-FMT mice.
FFA and TC levels were not significantly different among the three groups. Control-FMT mice had lower phosphorylated Akt levels in the adipose tissue after insulin stimulation than vehicle mice; however, the level was not different between control-FMT and CKD-FMT mice (Figure 2C). Phosphorylated Akt levels in muscle tissues after insulin stimulation were unaltered in control-FMT mice compared with that in vehicle mice; however, the levels were lower in CKD-FMT than in the control-FMT mice. Compared with vehicle mice, control-FMT mice exhibited a significant increase in the percent change in BW, gastrocnemius and soleus muscle masses and EWAT (Table 1 and Figure 2D).
Oxygen consumption was significantly higher in both FMT groups than in vehicle mice, particularly in the light phase, whereas chow consumption was significantly higher in vehicle mice than in both FMT mice. Conversely, both oxygen and chow consumption were not different between the control-FMT and CKD-FMT groups (Supplementary data, Figure S2D–F). These results were compatible with those of a previous study [18], and combined with the result that BW gain was blunted in vehicle mice compared with that in both FMT groups (Table 1), energy harvest from the diet was believed to be lower in vehicle mice than in FMT mice. Compared with control-FMT mice, CKD-FMT mice showed significant decreases in gastrocnemius muscle mass and EWAT (Table 1). Histological assessment revealed that the adipocytes were larger in control-FMT mice than in vehicle mice, whereas adipocytes were smaller in CKD-FMT mice than in control-FMT mice (Figure 2E). The number of the larger adipocytes was higher in control-FMT mice than in vehicle mice, whereas the number of smaller adipocytes was higher in CKD-FMT mice than in control-FMT mice (Figure 2F). The TG content in the gastrocnemius muscle was not different between vehicle and control-FMT mice, whereas it was significantly elevated in CKD-FMT mice compared with control-FMT mice; however, there was no difference in the TG content of the liver among the three groups (Figure 2G). These data indicate that uremic dysbiosis can cause IR and resultant lipodystrophy-like changes.
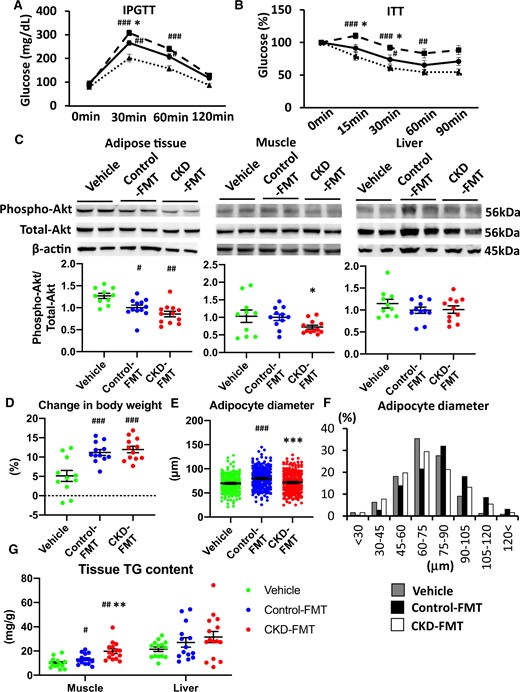
Impaired glucose tolerance and IR in CKD-FMT mice in the fecal transplantation experiment. The results of (A) IPGTT and (B) ITT in vehicle mice (dotted lines), control-FMT mice (solid lines) and CKD-FMT mice (dashed lines). (C) The phosphorylation levels of Akt after insulin stimulation in the adipose tissue (left panel), muscle tissue (middle panel) and liver tissue (right panel) of three experimental groups (vehicle, green dots; control-FMT, blue dots; CKD-FMT, red dots). The blots for total-Akt are shown as loading controls. The representative results in three independent experiments are shown (n = 10–12 per group). (D) The percent change in BW from 8 to 10 weeks of age among the three experimental groups (n = 10–12 per group). (E) The average of diameter of adipocytesand (F) the distribution of adipocyte diameters in the adipose tissuesof three experimental groups. (G) Lipid accumulation in the muscle and liver tissues of three experimental groups was examined by the measurement of tissue TG content (n = 14–15 per group). #P < 0.05, ##P < 0.01, ###P < 0.001 versus vehicle mice (n = 14–15 per group). *P < 0.05, **P < 0.01, ***P < 0.001 versus control-FMT mice. Bar represents mean ± standard error of the mean.
Sarcopenic phenotypes in adenine-induced CKD mice
Handgrip strength (Figure 3A), running distance (Figure 3B), skeletal muscle (Table 1) and muscle fiber size (Figure 3C) significantly decreased in CKD mice compared with control mice. SDH staining intensity decreased in CKD mice compared with control mice (Figure 3D). The number of mitochondria-rich muscle fibers (slow oxidative type I and fast oxidative glycolytic IIa fibers) was significantly reduced, but fast glycolytic type IIb fibers increased in CKD mice compared with control mice (Figure 3E). We examined mRNA expression levels for several genes involved in mitochondrial biogenesis (Tfam, PGC-1α), electron transport (COX IV, ATPsyn), mitochondrial degradation (PINK1, BNIP3L) and regulating muscle fiber formation (PPAR-δ, troponin I); mRNA levels of Tfam, PGC-1α, COX IV and ATPsyn significantly decreased in CKD mice compared with control mice (Figure 3F and G). The mRNA levels of PPAR-δ decreased in CKD mice compared with control mice (Figure 3I). Insulin-stimulated phosphorylation of S6K1, which is a marker of insulin-induced muscle protein synthesis [26], was lower in the gastrocnemius muscle of CKD mice than in control mice (Figure 3J). A sarcopenic phenotype was confirmed in adenine diet–induced CKD mice.
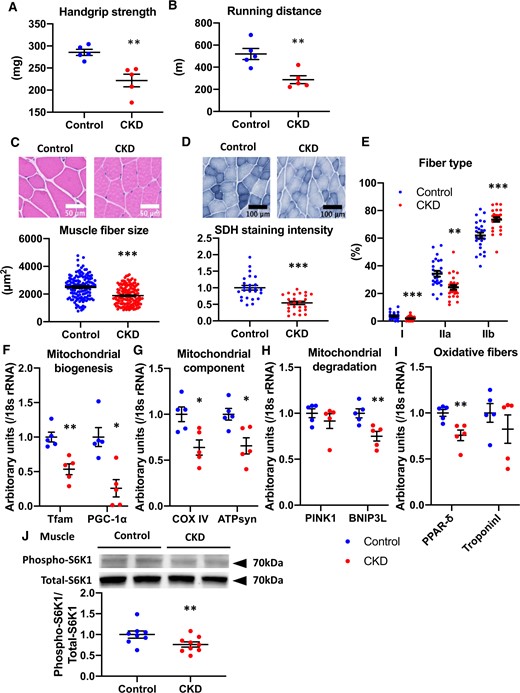
Muscle phenotypes in adenine-induced CKD mice. (A) Handgrip strength and (B) running distance in control mice (blue dots) and CKD mice (red dots) (n = 5 per group). (C) HE staining (original magnification, ×400) of gastrocnemius muscle (upper panel) and fiber size of the HE-stained gastrocnemius muscle (lower panel). (D) SDH staining (original magnification, ×200) of the gastrocnemius muscle (upper panel) and SDH intensity (lower panel). (E) The population of muscle fiber types was determined in SDH-stained gastrocnemius muscle. Real-time PCR analysis of molecules related to muscle mitochondria: (F) PGC-1α and Tfam, (G) COX IV and ATP syn, (H) PINK1 and BNIP3Land (I) PPAR-δ and troponin Iof the gastrocnemius muscle in two experimental groups (n = 5 in each group). (J) Levels of phospho-S6K1 after insulin stimulation in the muscle tissue of two experimental groups (n = 8–9 per group). The blots for total-S6K1 are shown as loading controls. The representative results from two independent experiments are shown. *P < 0.05, **P < 0.01, ***P < 0.001 versus the control group. Bar represents mean ± standard error of the mean.
Sarcopenic phenotypes are reproduced by FMT from CKD mice
We examined whether the sarcopenic phenotype in CKD can be reproduced by FMT from CKD mice to normal GF mice. Compared with vehicle mice, control-FMT mice showed a significant increase in handgrip strength without a significant difference in running distance (Figure 4A and B). Compared with vehicle mice, control-FMT mice showed increased muscle weight and significantly increased muscle fiber size and SDH staining in the gastrocnemius muscle (Table 1 and Figure 4C, D). Compared with control-FMT mice, CKD-FMT mice showed significantly decreased running distance and grip strength (Figure 4A and B) and gastrocnemius muscle mass and fiber size (Table 1 and Figure 4C). Compared with control-FMT mice, CKD-FMT mice showed decreased SDH staining in muscle tissue, a lower number of type IIa fibers and a higher number of type IIb fibers (Figure 4D and E). Real-time PCR analysis showed that compared with control-FMT mice, CKD-FMT mice had a significantly decreased mRNA level of Tfam (Figure 4F). The COX IV mRNA level was significantly elevated in control-FMT mice compared with vehicle mice, whereas COX IV and ATPsyn mRNA levels were significantly lower in CKD-FMT mice compared with control-FMT mice (Figure 4G). Compared with control-FMT mice, CKD-FMT mice showed a significantly decreased mRNA expression level of PPAR-δ (Figure 4I). Although S6K1 phosphorylation after insulin stimulation in muscle was not different between vehicle mice and control-FMT mice, it was attenuated in CKD-FMT mice compared with control-FMT mice (Figure 4J). These findings indicate that dysbiosis in CKD reduces muscle power and endurance during exercise associated with muscle atrophy and a decrease in muscle mitochondria.
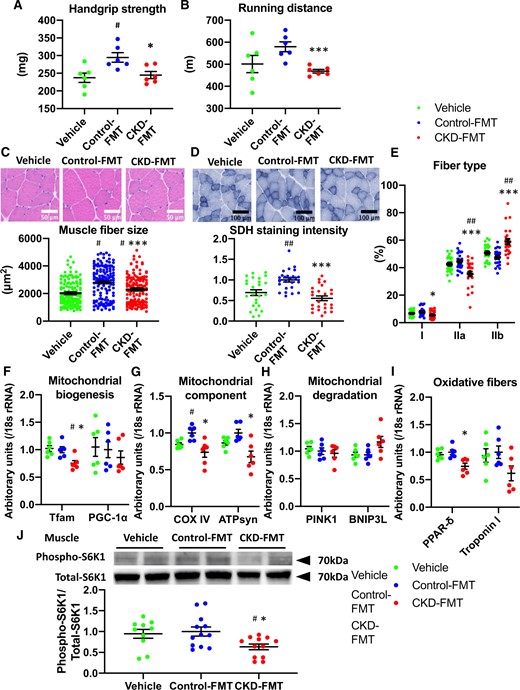
Muscle phenotype in CKD-FMT mice in the fecal transplantation experiment. (A) Handgrip strength and (B) running distance in vehicle mice (green dots), control-FMT mice (blue dots) and CKD-FMT mice (red dots) (n = 6 per group). (C) HE staining (original magnification, ×400) of gastrocnemius muscle (upper panel) and fiber size of the HE-stained gastrocnemius muscle (lower panel). (D) SDH staining (original magnification, ×200) of the gastrocnemius muscle (upper panel) and SDH stain intensity (lower panel). (E) The population of muscle fiber types determined in SDH-stained gastrocnemius muscle. Real-time PCR analysis of molecules related to mitochondrial function: (F) PGC-1α and Tfam, (G) COX IV and ATP syn, (H) PINK1 and BNIP3Land (I) PPAR-δ and troponin I of the gastrocnemius muscle in three experimental groups (n = 6 in each group). (J) Levels of phospho-S6K1 after insulin stimulation in the muscle tissue of three experimental groups (n = 10–12 per group). The blots for total-S6K1 are shown as loading controls. The representative results from two independent experiments are shown. #P < 0.05, ##P < 0.01, ###P < 0.001 versus vehicle mice (n = 14–15 per group). *P < 0.05, **P < 0.01, ***P < 0.001 versus control-FMT mice. Bar represents mean ± standard error of the mean.
Serum microbiota-derived uremic solutes and fecal products of bacterial fermentation
As expected, there was significant uremic solute accumulation in the CKD mice compared with the control mice (Figure 5A). Among those solutes, the serum concentrations of IS, PhS and HA were significantly higher in CKD-FMT mice than in control-FMT mice (Figure 5B). We examined fecal concentrations of bacterial fermentation products, which are precursors to uremic solutes. Fecal concentrations of indole and phenol were higher in CKD mice than in control mice (Figure 5C). In the FMT experiment, fecal concentrations of indole and phenol were significantly higher in CKD-FMT mice than in control-FMT mice (Figure 5D). In vitro experiments using C2C12 myotubes revealed that mixed solutions of IS, PhS and HA, with concentrations comparable to those of CKD-FMT mice in an in vivo study, impaired insulin-stimulated phosphorylation of Akt and S6K1 (Figure 5E). In addition, PhS and HA impaired insulin-stimulated phosphorylation of Akt. Furthermore, IS and HA blocked insulin-stimulated phosphorylation of S6K1 in C2C12 myotubes (Figure 5E). These data suggest the accumulation of uremic solutes that occurs during uremic dysbiosis is involved in IR and sarcopenia in CKD-FMT mice.
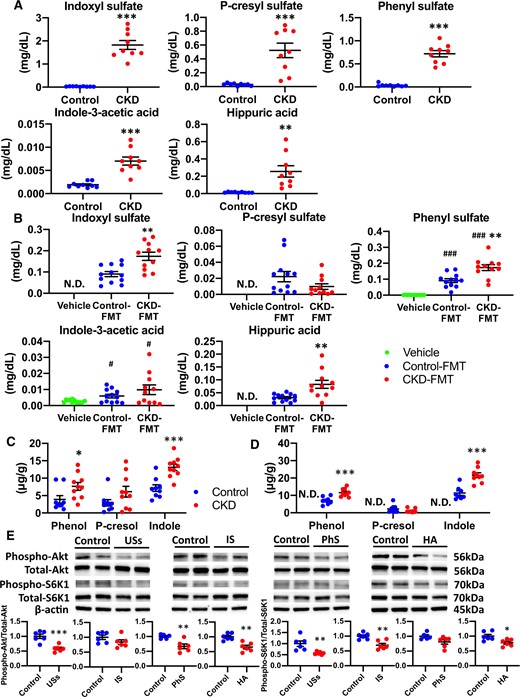
Serum uremic solutes and fecal products of bacterial fermentation in CKD mice and CKD-FMT mice. (A) Serum concentrations of the following uremic solutes: IS, PCS, PhS, IAA and HA in control mice (blue dots) and CKD mice (red dots) (n = 8 per group). (B) Serum concentrations of uremic solutes in vehicle mice (green dots), control-FMT mice (blue dots) and CKD-FMT mice (red dots) (n = 11–12 per group). Fecal concentrations of bacterial fermentation products: phenol, p-cresol and indole in (C) control mice and CKD mice, as well as in (D) vehicle mice, control-FMT mice and CKD-FMT mice(n = 8–10 per group). The effects of uremic solutes on insulin-stimulated phosphorylation of (E) Akt and (F) S6K1 in C2C12 myotubes (n = 5–6 per group). #P < 0.05, ##P < 0.01, ###P < 0.001 versus vehicle mice. *P < 0.05, **P < 0.01, ***P < 0.001 versus control mice, control-FMT group or control group of in vivo study. ND, not detected. Lower limits of quantification of IS, PCS, PhS, IAA and HA are 0.004, 0.0005, 0.002, 0.0002 and 0.0096 mg/dL, respectively. Lower limit of quantification of all bacterial fermentation products is 0.3 μg/g. Bar represents mean ± standard error of the mean.
To assess the factors that cause differences in their serum concentrations, we subsequently analyzed the renal clearance and total urinary excretion per day, which is equal to 24-h intestinal absorption or the generation rate under steady-state conditions of uremic solutes. As expected, the renal clearance of uremic solutes significantly decreased in CKD mice compared with control mice, whereas the 24-h urinary excretion of IS, PhS and HA was higher in CKD mice than in control mice (Figure 6A and B). Urinary excretion of PCS and IAA was not significantly different between the groups. In the FMT experiment, renal clearance of the uremic solutes analyzed was not significantly different between control-FMT and CKD-FMT mice, whereas 24-h urinary excretion of IS, PhS and HA, and not PCS and IAA, was elevated in the CKD-FMT mice compared with the control-FMT mice (Figure 6D and E). Combined with the results of the examination of fecal concentrations of bacterial fermentation products, these results indicate that the increase in serum PCS concentration of CKD mice was attributed mainly to reduced renal clearance of PCS associated with decreased renal function, whereas both increased intestinal adsorption and decreased renal clearance caused an increase in serum IS, PhS and HA concentrations in CKD mice. Likewise, increased intestinal absorption of those uremic solutes led to a significant increase in the serum concentrations of CKD-FMT mice compared with control-FMT mice, despite the equivalent renal clearance of the two groups.
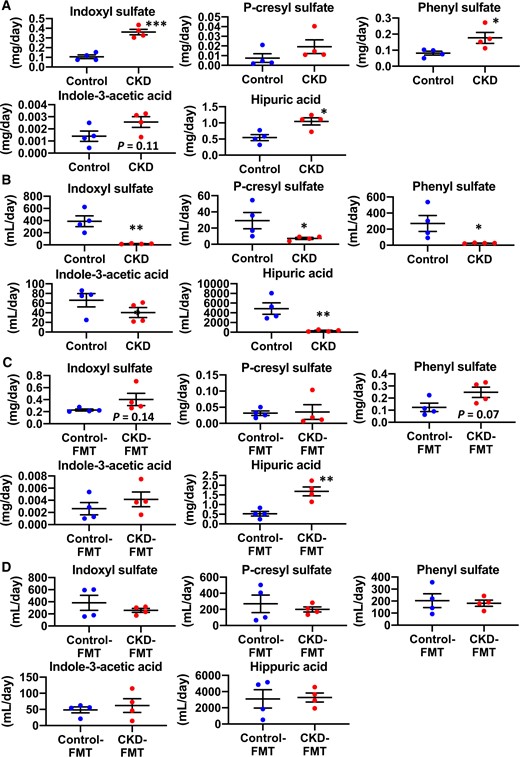
Urinary excretion and renal clearance of uremic solutes in CKD mice and CKD-FMT mice. The 24-h (A) urinary excretion and (B) renal clearance of the following uremic solutes: IS, PCS, PhS, IAA and HA in control mice (blue dots) and CKD mice (red dots) (n = 4 per group). The 24-h (C) urinary excretion and (D) renal clearance of uremic solutes in control-FMT mice (blue dots) and CKD-FMT mice (red dots) (n = 4 per group). *P < 0.05, **P < 0.01, ***P < 0.001 versus control mice or control-FMT group. Bar represents mean ± standard error of the mean.
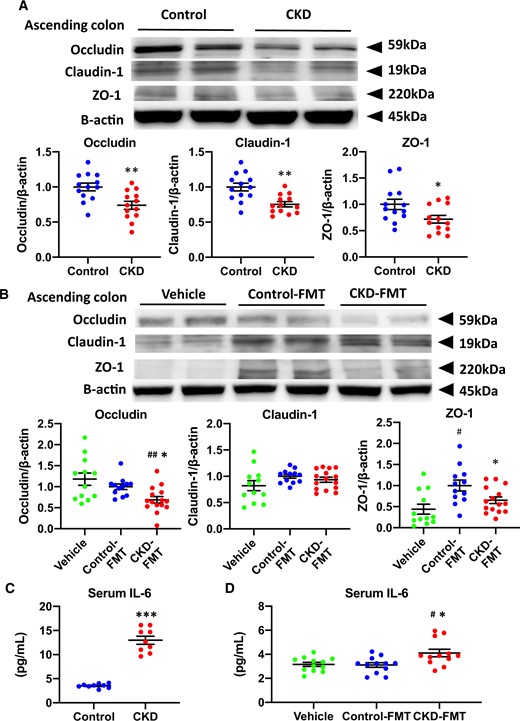
Disruption of intestinal barrier and systemic microinflammation in CKD mice and CKD-FMT mice. Expression levels of the tight junction proteins occludin, claudin-1 and ZO-1 in (A) the ascending colon of control mice (blue dots) and CKD mice (red dots), as well as (B) those of vehicle mice (green dots), control-FMT mice (blue dots) and CKD-FMT mice (red dots) (n = 12–13 per group). The blots for β-actin are shown as loading controls. The representative results for three independent experiments are shown. Serum IL-6 concentration in (C) control mice and CKD mice (n = 10 per group) as well as (D) vehicle mice, control-FMT mice and CKD-FMT mice (n = 12 per group). #P < 0.05, ##P < 0.01, ###P < 0.001 versus vehicle mice. *P < 0.05, **P < 0.01, ***P < 0.001 versus control mice or control-FMT group. Bar represents mean ± standard error of the mean.
Disruption of the intestinal barrier during uremic dysbiosis in CKD
The expression levels of intestinal tight junction proteins in the ascending colon were lower in CKD mice compared with those in control mice (Figure 7A). In the FMT experiment, significantly higher expression of ZO-1 was observed in control-FMT mice than in vehicle mice. Compared with control-FMT mice, CKD-FMT mice showed significantly lower levels of occludin and ZO-1 protein; however, the expression of claudin-1 remained unchanged (Figure 6B). As previously reported in CKD models, lower intestinal tight junction protein expression increases intestinal permeability and promotes systemic inflammation [9]. Serum IL-6 levels in CKD mice were significantly elevated compared with those in control mice (Figure 7C). Serum IL-6 concentration was significantly higher in CKD-FMT mice than in control-FMT mice (Figure 7D). These data suggest that uremic dysbiosis leads to intestinal barrier dysfunction and systemic inflammation [27].
Gut microbiota composition in CKD and CKD-FMT mice
The gut microbiota composition of each mouse group was analyzed on the premise that adenine diet per se had little effect on gut microbiota and dysbiosis in adenine-induced CKD mainly depended on uremic state, as previously reported [7]. We also preliminarily demonstrated that the change in the gut microbiota was already evident 2 weeks after adenine feeding, along with a mild but significant increase in UN (Supplementary data, Figure S4A and B). The change in gut microbiota composition after 4 weeks of the adenine diet was similar to that after 2 weeks. There was also an insignificant increase in UN compared with that after 2 weeks, but this became distinguishable after 6 weeks of the adenine diet, accompanied by a marked increase in UN, which was significantly higher than that after 2 weeks. Moreover, both the glucose tolerance in IPGTT and IR in ITT became evident only after 6 weeks of the adenine diet (Figure 1A and B; Supplementary data, Figure S4C–F). These results indicate that the uremic state, and not adenine per se, influences IR. Moreover, we newly prepared 5/6 nephrectomy mice by heminephrectomy and polectomy at the ages of 7 (1/2 nephrectomy) and 8 (polectomy of remaining 1/3 nephrectomy) weeks, as previously described [11]. We subsequently demonstrated that characteristics of gut microbiota in 5/6 nephrectomy mice were comparable with those in adenine-fed mice at 6 weeks, and similar changes were observed in the relative abundance of each OTU at the phylum and class levels in both these groups compared with those in mice without interventions (Figure S4A, G and H). There was a comparable increase in serum UN, which was significantly higher than that at 2 weeks after adenine feeding. This result consolidates the fact that the uremic state, and not the adenine diet per se, induces dysbiosis.
The gut microbiota composition was different between control and CKD mice or control-FMT mice and CKD-FMT mice; however, the difference became smaller between control-FMT and CKD-FMT mice in two-dimensional PCoA (Figure 8A). The relative abundance of each OTU at the phylum level was similar between control and CKD or control-FMT and CKD-FMT mice, whereas those at the class and order levels revealed significant decreases in the populations of Bacilli; Lactobacillales and increases in Clostridia; Clostridales and Erysipelotrichi; Erysipelotrichales in CKD mice than in control mice (Figure 8B;Supplementary data, Figure S5A and B). These changes in Bacilli; Lactobacillales and Erysipelotrichi; Erysipelotrichales in CKD mice persisted in CKD-FMT mice compared with those in control-FMT mice, while the increase in Clostridia; Clostridales in CKD mice was not seen in CKD-FMT mice. Heat maps at the family level showed that the relative abundance of a majority of OTUs was similar between control and control-FMT mice or CKD and CKD-FMT mice (Supplementary data, Figure S5C and D). The probe intensities at the genus level revealed significant decreases in Lactobacillus, Lactonifactor and Tannerrella and increases in Allobaculum, Clostridium cluster IV and Alistipes in CKD mice compared with control mice. All of these changes, except for the decrease in Tannerrella, remained in CKD-FMT mice compared with control-FMT mice (Figure 8C and D).
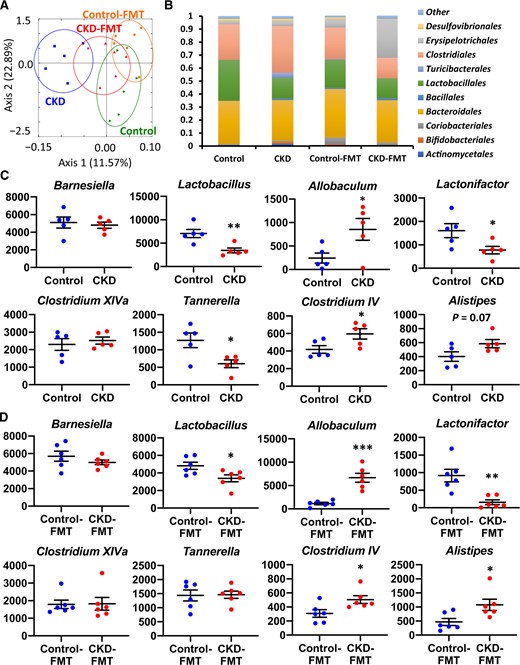
Comparison of the gut microbiota composition between control and adenine-induced CKD mice as well as between control-FMT and CKD-FMT mice. (A) Two-dimensional PCoA of weight Unifrac distance. (B) Relative abundance of microbiota on the basis of the average number of each microbe at the order level. The change in read count of each taxon at the genus level between (C) control and CKD mice (blue and red dots, respectively) or (D) control-FMT and CKD-FMT mice (blue and red dots, respectively). The major genera comprising the largest proportion in these four groups are shown. The y-axis indicates the read count of each microbe. *P < 0.05, **P < 0.01, ***P < 0.001 versus control mice or control-FMT mice. Bar represents mean ± standard error of the mean.
DISCUSSION
Experimental data suggest that intestinal flora is involved in CKD-induced IR [28, 29]. One of the IR triggers includes elevated inflammatory cytokine levels. CKD patients exhibited high levels of circulating proinflammatory cytokines, including IL-6, even in the early stages of CKD. These cytokines may interfere with biochemical pathways and increase IR risk [30–32]. Gut microbiota–derived uremic solutes HA and PhS caused IR in myocytes. The elevations of these factors were observed not only in CKD mice compared with control mice but also in CKD-FMT mice compared with control-FMT mice. These results demonstrated that the alterations in microbiota directly contributed to CKD-induced IR in CKD by increasing levels of these solutes.
Although systemic IR is evident in both CKD and CKD-FMT mice, the effects on each tissue type varied between the groups. In CKD-FMT mice, IR was not observed in adipose tissue, thus indicating that adipose tissue IR is induced independently of uremic dysbiosis. Sarcopenia is evident in CKD and CKD-FMT mice, therefore uremic dysbiosis contributes to the pathogenesis of uremic sarcopenia. In clinical practice, using probiotics or sorbents to modulate the composition of gut microbiota or gut-derived uremic toxins has been shown to counteract uremic sarcopenia [33, 34]. Our data support that these gut-targeted therapies can be treatment strategies for this uremia-related frailty phenotype, which is closely associated with an elevated risk of morbidity and mortality and decreased quality of life among CKD patients [35, 36].
The present FMT experiment showed that vehicle mice exhibited significantly reduced BW, EWAT and IR as compared with FMT mice, and these findings are consistent with the literature [18, 37]. The mechanisms leading to differences in the phenotypes (IR and sarcopenia) between vehicle and control-FMT mice were quite distinct from those leading to the differences between control-FMT and CKD-FMT mice. Our results demonstrate increased chow consumption along with decreased oxygen consumption in mice maintained to be GF as compared with mice receiving FMT from SPF mice. As previously described in the literature, these phenomena can be partly explained by decreased energy harvest from the diet and increased energy expenditure in GF mice compared with SPF mice [18, 37, 38]. These mechanisms may explain why control-FMT mice, compared with vehicle mice, exhibited increased muscle mass and handgrip strength despite the presence of IR in skeletal muscle.
Previous reports strongly suggest that there is increased colonic generation or absorption of bacterial uremic solutes, including protein-bound compounds, during CKD [6, 39]. For instance, a recent study suggests that increased levels of PCS partially contribute to CKD-induced IR [40]. However, in this study, serum PCS was not increased by FMT from CKD mice, along with equivalent renal clearance and urinary excretion of PCS and fecal p-cresol concentrations in mice receiving FMT from control mice. We showed that there was reduced renal clearance of PCS without an increase in intestinal adsorption of PCS or fecal production of p-cresol in CKD mice. This indicates that an increase in serum PCS among CKD mice is mainly because of decreased renal function, although it is contradictory to the previous study conducted in 203 patients with CKD Stages 1–5 [41]. The reasons for this discrepancy remain undetermined but can be presumably attributed to the difference in intestinal barrier function and/or the difference in dietary composition, e.g. the content of tyrosine, a precursor amino acid of p-cresol between mice and humans. In contrast, we showed that increased intestinal absorption of IS, PhS and HA, as well as increased indole and phenol production by fecal bacteria—in addition to reduced renal clearance—contributed to increased serum concentrations. Likewise, elevated serum IS, PhS and HA levels in CKD-FMT mice compared with those in control-FMT mice were explained by increased intestinal absorption of IS, PhS and HA as well as increased indole and phenol production by fecal bacteria, despite the equivalent renal clearance of those uremic solutes between the groups. Other recent studies suggest that HA and PhS have toxic effects in vivo and in vitro [42, 43]. Regarding HA, other older studies demonstrated that HA weakened muscles through impaired glucose utilization in skeletal muscles [44, 45]. Another study showed the association between HA and left ventricular hypertrophy in patients undergoing hemodialysis [46]. For PhS, a recent study showed the association between serum PhS concentration and the degree of albuminuria in patients with diabetic kidney disease. Furthermore, PhS administration induces albuminuria and podocyte damage in an experimental model of diabetes [47]. This study showed a serum PhS concentration of 3.3 (range 0–68.1) µM, which was comparable with that of CKD-FMT mice in our in vivo study [mean 0.17 mg/dL (10 µM)]. Additionally, there are few data regarding the serum concentration of HA in patients with CKD; however, one study on predialysis CKD showed a serum HA concentration of 0.255 (range 0.119–0.379) mg/dL, which was not so far from that of CKD-FMT mice in our study [mean 0.08 mg/dL (4.6 μM)] [48]. Our in vitro study showed that a mixed solution of IS, PhS and HA, with a concentration comparable with that in our in vivo study, blocked insulin signaling of C2C12 myotubes. This suggests that accumulation of these uremic solutes contributes to systemic IR by blocking skeletal muscle insulin signaling. IS has been shown to lower exercise capacity and increase skeletal muscle atrophy with mitochondrial dysfunction [33, 34]. In this study, muscle mitochondrial dysfunction observed in CKD and CKD-FMT mice was partially due to increased serum concentrations of IS. Nevertheless, the effects of other uremic solutes or short-chain fatty acids could not be excluded.
Our FMT experiments demonstrated that, as expected, single FMT with feces from CKD mice did not alter kidney function in normal GF mice. However, we also demonstrated that uremic dysbiosis increased gut-derived toxin levels in the systemic circulation, thereby elevating inflammatory cytokines in the absence of a uremic condition. Two mechanisms are suggested for this phenomenon: increased production of these substances and increased gut permeability by alterations in gut microbiota induced by uremia. We previously demonstrated that indole downregulated occludin and ZO-1 protein levels by inhibiting the aryl hydrocarbon receptor in CaCo2 intestinal cells [20, 49]. Therefore, indole overproduction by uremic dysbiosis may directly increase gut permeability by affecting the expression of these tight junction proteins. Another possibility is the decreased number of Lactobacillus in CKD and CKD-FMT mice, because this strain has been shown to upregulate tight junction protein expression and is believed to block the entry of fecal bacterial fermentation products from the intestine [20].
In our experiment, major changes in the intestinal microbiome in CKD mice at the genus level that persist after FMT included decreases in the number of Lactobacillus and Lactonifactor and increases in the number of Allobaculum, Clostridium cluster IV and Alistipes. According to the Kyoto Encyclopedia of Genes and Genomes database, increases in Clostridium cluster IV and Alistipes bacteria might increase production of indole, a precursor of IS, from tryptophan [47, 50]. This database showed that Clostridium cluster IV bacteria might possess genes encoding tyrosine phenol-lyase and produce phenol, a precursor of PhS [47, 51]. Lactobacillus, which may produce p-cresol from tyrosine [50], had lower numbers in CKD mice, resulting in increased phenol production from the same substrate, tyrosine. Allobaculum numbers positively correlate with blood glucose levels and are reported to increase in response to a high-fat diet [52–54]. Lactonifactor metabolizes phytoestrogens and increases antioxidant enzyme activity in the plasma and liver [55, 56]. An increase in Allobaculum number and a decrease in Lactonifactor number may contribute to IR and sarcopenic states.
On the basis of these findings, we propose a model for the direct effect of uremic dysbiosis on renal IR and uremic sarcopenia (Figure 9). These data show that dysbiosis causes microinflammation by enhancing intestinal permeability and lead to changes in serum concentrations of uremic solutes, presumably through an increase in bacterial fermentation product levels and intestinal permeability. These changes partly contribute to renal IR with uremic sarcopenia and mitochondrial dysfunction. However, the degree of elevation of uremic solutes and IL-6 by FMT was not substantial, therefore the involvement of unanalyzed uremic solutes, short-chain fatty acids or other materials was also likely with a certain probability. In addition, our data indicate that donor phenotypes, i.e. IR, were maintained for up to 4 weeks after FMT, although more persistent phenotype changes via alteration of microbiota composition have not been tested. Previous FMT studies also confirmed the effects of FMT for 2 weeks. This duration of the maintenance of phenotypes is considered to be a study limitation, possibly because of a gradual transformation in gut microbiota back to normal after FMT [17, 18]. Despite these study limitations, as a whole, we propose that uremic dysbiosis may be a novel therapeutic target against metabolic and sarcopenic phenotypes in CKD patients.
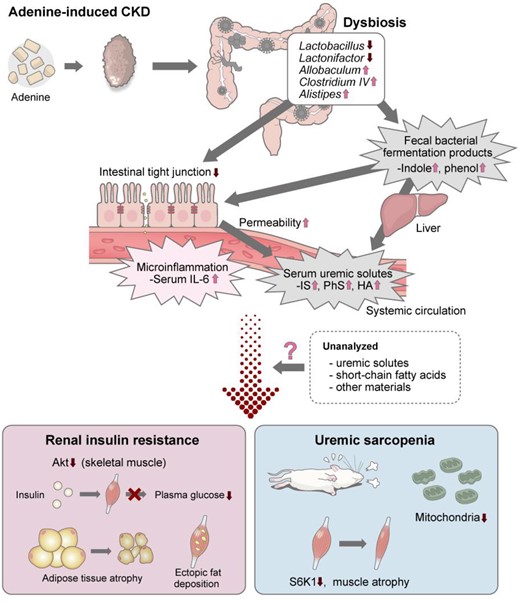
Schematic representation of the findings in this experiment. The causal relationship between dysbiosis in adenine-induced CKD, renal IR and uremic sarcopenia was identified in this experiment and previous studies.
SUPPLEMENTARY DATA
Supplementary data are available at ndt online.
FUNDING
This experiment was supported by grants from the Japan Agency for Medical Research and Development (JP18gm1010007) to J.I., J.M., I.K. and H.I., and from Novartis Pharma to H.I. The funders did not influence the reporting of the data or results presented in this study.
CONFLICT OF INTEREST STATEMENT
None declared.


Comments