


Abstract
Peritoneal dialysis (PD) patients are at high risk of developing glucose metabolism disturbance (GMD). The incidence and prevalence of new-onset GMD, including diabetes mellitus (DM), impaired glucose tolerance (IGT) and impaired fast glucose (IFG), after initiation of PD, as well as their correlated influence factors, varies among studies in different areas and of different sample sizes. Also, the difference compared with hemodialysis (HD) remained unclear. Thus we designed this meta-analysis and systematic review to provide a full landscape of the occurrence of glucose disorders in PD patients.
We searched the MEDLINE, Embase, Web of Science and Cochrane Library databases for relevant studies through September 2018. Meta-analysis was performed on outcomes using random effects models with subgroup analysis and sensitivity analysis.
We identified 1124 records and included 9 studies involving 13 879 PD patients. The pooled incidence of new-onset DM (NODM) was 8% [95% confidence interval (CI) 4–12; I2 = 98%] adjusted by sample sizes in PD patients. Pooled incidence rates of new-onset IGT and IFG were 15% (95% CI 3–31; I2 = 97%) and 32% (95% CI 27–37), respectively. There was no significant difference in NODM risk between PD and HD [risk ratio 0.99 (95% CI 0.69–1.40); P = 0.94; I2 = 92%]. PD patients with NODM were associated with an increased risk of mortality [hazard ratio 1.06 (95% CI 1.01–1.44); P < 0.001; I2 = 92.5%] compared with non-DM PD patients.
Around half of PD patients may develop a glucose disorder, which can affect the prognosis by significantly increasing mortality. The incidence did not differ among different ethnicities or between PD and HD. The risk factor analysis did not draw a definitive conclusion. The glucose tolerance test should be routinely performed in PD patients.
INTRODUCTION
Fueled by the aging of the world’s population and widespread increases in obesity, diabetes has rapidly become a global epidemic and a major public health concern [1]. Currently the global prevalence of diabetes is 8.8% [2]. Diabetes is a leading cause of end-stage renal disease (ESRD) worldwide. It accounts for approximately half of all patients with ESRD in the USA [3], and chronic kidney disease related to diabetes is trending towards exceeding that related to glomerulonephritis to become the leading cause of ESRD in China [4]. On the other hand, ESRD patients are also at high risk of developing glucose disorders, which may linked to worse survival [5–7]. It has been demonstrated that an elevated plasma glucose level is an independent risk factor for mortality among dialysis patients, even in patients with an elevated fasting plasma glucose level [5, 8, 9].
Peritoneal dialysis (PD) is one of the most common and important renal replacement treatments in patients with ESRD. Glucose-based dialysate is the most widely used solution in PD, which means that the patient has either intermittent or continuous exposure of the peritoneal cavity to large volumes of dialysate containing glucose, resulting in 100–300 g/day of glucose absorption via the peritoneal cavity, accounting for ∼20% of daily energy [10, 11]. Therefore PD patients are at a great risk of insulin resistance and new-onset glucose intolerance.
Studies have been conducted to evaluate the occurrence of de novo glucose disorders in PD [3, 5, 8]. Known risk factors for diabetes in the general population, such as advanced age, non-Caucasian ethnicity, obesity, insulin resistance, hypertension, physical inactivity and chronic inflammation are highly prevalent in the PD population [9, 12]; however, the incidence and prevalence of new-onset glucose metabolism disturbance (GMD), including diabetes mellitus (DM), impaired glucose tolerance (IGT) and impaired fasting glucose (IFG), after initiation of PD, as well as their correlated influence factors, varies among studies in different areas and of different sample sizes. Also, the difference compared with HD remained unclear. Thus we designed this meta-analysis and systematic review to summarize the current knowledge, aiming to provide a full landscape regarding the occurrence of glucose disorders in PD patients.
MATERIALS AND METHODS
This systematic review was performed following Preferred Reporting Items for Systematic Reviews and Meta-Analyses (PRISMA) guidelines [13]. A search of published studies was performed using the PubMed, Embase and Cochrane Library through September 2018. The registration of this review was published in PROSPERO (CRD42019126429). We used ‘diabetes or new-onset diabetes or de novo diabetes or GMD or IFG or oral glucose tolerance test or IGT’ AND ‘dialysis or PD or hemodialysis’ as the keywords and search strategy. Publications that addressed GMD and insulin resistance were deemed relevant and were further reviewed. Additional relevant articles were then found by using citations in the publications identified in the initial search.
Publications that met the following inclusion criteria were selected: observational or cohort studies; dialysis patients with ESRD; patients with new-onset GMD (NOGMD) including DM, IGT and IFG and long-term follow-up (>3 months) results reported. We excluded studies with the following properties: patients received renal replacement therapy besides PD and HD; patients with pre-existing DM, IGT and IFG. We contacted the original authors in order to obtain further data if necessary.
The following information was extracted from the included studies: first author, publication year, study design, ethnicity, gender, age, follow-up time, number of patients, dialysis modality, diagnosis criteria, risk factors, number of patients with new-onset DM (NODM), IGT and IFG. NODM incidence was the primary outcome. New-onset IGT (NOIGT) incidence, new-onset IFG (NOIFG) incidence, NODM risk between PD and HD and the risk of mortality between NODM and non-NODM patients on PD were the secondary outcomes. The incidence was pooled by evaluating the reported data with its 95% confidence interval (CI) in each study and calculating the weight according to the sample size [14, 15].
Assessment of risk of bias was performed by two authors (J.X. and C.X.) independently using the Newcastle–Ottawa Quality Assessment Scale (NOS) [16]. Studies scored a maximum of 9 points by NOS. Random effects meta-analyses were performed for the outcomes. Incidence, relative risk (RR) of GMD and hazard ratio (HR) of mortality were analyzed by random effects models using Stata 12.0 (StataCorp, College Station, TX, USA) [14]. The statistical heterogeneity of studies was evaluated using Q and I2 statistics. I2 >75% was recognized as high heterogeneity [14]. A sensitivity analysis was performed by changing different models and excluding each study one at a time. Subgroup analysis was performed according to different ethnicities. If the number of studies was <10, then the publication bias was not investigated [17]. A two-sided P-value <0.05 was considered statistically significant.
RESULTS
Literature search
The process of selecting relevant studies initially found 1124 publications (Figure 1). After exclusion of 675 irrelevant studies and 380 duplicates, 69 potentially eligible studies were deeply screened. Eventually nine studies [5, 6, 8, 10–12, 18–20] involving 13 879 PD patients and 74 623 HD patients were included. Five of these [6, 8, 11, 19, 20] reported new GMD patients on either PD or HD and four studies [5, 10, 12, 18] were performed in PD patients only.
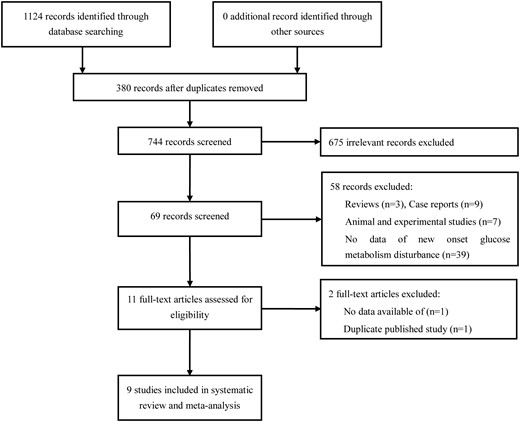
Flow chart of study identification, inclusion and exclusion.
Study characteristics
The characteristics of the included studies are listed in Table 1. All studies implied the cohort design [5, 6, 8, 10–12, 18–20]. The follow-up duration ranged from 7 to 108 months. The mean age of included patients ranged from 40 to 62 years. Male and female patients were almost equivalent in the studies except Chou et al.’s study [19]. Three studies [8, 11, 19] with large sample sizes (>10 000) were from Asia using the health insurance database. One study was performed in Europe [6], one in the USA [20] and seven in Asia [5, 8, 10–12, 18, 19]. The PD patients commonly used continuous ambulatory PD (CAPD) [8, 12, 16, 20]. The diagnosis criteria of GMD were reported in six studies [5, 6, 10, 12, 18, 19]. GMD was classified into three groups according to the 2-h oral glucose tolerance test (OGTT) results and fasting blood glucose (FBG) levels. The values of glucose categorization are based on 1997 definitions: DM ≥11.1 mmol/L, IGT 7.7–11.1 mmol/L and IFG 5.6–7.7 mmol/L [6, 18]. There were four studies [5, 10, 12, 19] that used FBG as the measuring method, while three studies [6, 12, 18] used 2-h OGTT.
Characteristics of included studies
| References | Study design | Ethnicity | Dialysis modality | Gender (F/M) | Age (years) | Follow-up (months) | Sample size | Diagnosis criteria (mmol/L) | Diagnosis method | NODM patients/ total number (%) | NODM incidence (n/1000 person-years) | NOIGT patients/ total number (%) | NOIFG patients/ total number (%) | Risk factors for NOGMD |
|---|---|---|---|---|---|---|---|---|---|---|---|---|---|---|
| Cheng et al. [18] | Cohort study | Asian | CAPD | 23/12 | 43 ± 10 | 52.3 ± 35.4 | 35 | IGT: 7.78–11.11 | 2-h OGTT | NA | NA | 11/35 (31.4) | NA | High serum triglyceride |
| Woodward et al. [20] | Cohort study | American | PD | NA | NA | 24 | 5195 | DM >11.1 | NA | 150/1389 (10.7) | NA | NA | NA | NA |
| HD | 484/3806 (12.7) | NA | NA | NA | ||||||||||
| Tuzcu et al. [6] | Cohort study | Caucasian | CAPD | 19/26 | 39.6 ± 12 | 7 | 45 | DM >11; IGT 7.7–11 | 2-h OGTT | 5/45 (11.1) | NA | 6/45 (13.3) | NA | CAPD with higher LDL levels and lower insulin sensitivity compared with HD and normal group |
| HD | 23/28 | 43.3 ± 13.9 | 51 | 1/51(2.0) | NA | 2/51 (3.9) | NA | |||||||
| Szeto et al. [5] | Cohort study | Asian | CAPD | 117/135 | 59 ± 13 | 49.7 +28.4 | 252 | DM>11.1; IGT 7–11.1; IFG 5.6–7 | FBG | 12/252 (4.8) | NA | 47/252 (18.7) | 79/252 (31.4) | Impaired fasting glucose before PD. Positive correlations: age, baseline serum CRP level, Charlson comorbidity score; negative correlation: serum albumin level |
| Yu et al. [10] | Cohort study | Asian | CAPD | 85/60 | 62 ± 15 | 48 | 145 | DM>11.1; IGT 7–11.1; IFG 5.6–7 | FBG | 6/145 (4.1) | NA | 29/145 (20) | 48/145 (33.1) | High peritoneal transfer capacity; glucose load, baseline CRP and FBG level before PD. Negative correlation: D/D0 and serum albumin |
| Tien et al. [8] | Cohort study | Asian | PD | 13 984/12812 | 56.5 ± 16.6 | 53.2 | 2471 | NA | NA | 302/2471 (12.2) | NA | NA | NA | Being female, being older and having baseline comorbidities: hypertension and cardiovascular diseases |
| HD | 13 984/12812 | 56.5 ± 16.6 | 23 695 | 3044/23 695 (12.8) | NA | NA | NA | |||||||
| Chou et al. [19] | Cohort study | Asian | PD | 1632/916 | 50.2 ± 14.7 | 70 | 2548 | DM >7 | FBG twice | 351/2548 (13.8) | 24 | NA | NA | HD |
| HD | 6500/3692 | 50.3 ± 14.5 | 10 192 | 2217/10 192 (21.8) | 37 | NA | NA | |||||||
| Dong et al. [12] | Cohort study | Asian | PD | 348/264 | 55.5 ± 16.8 | 32.4 (12.9–60.8) | 612 | DM >11.1 (OGTT)/ >7 (FBG); IGT 7.8–11.1 (OGTT) | 2-h OGTT or FBG twice | 25/612 (4.1) | NA | 7/612 (1.1) | NA | Older age, higher body mass index and CRP level |
| Wang et al. [11] | Cohort study | Asian | PD | 3669/2713 | 50.4 ± 15.4 | 49.32 ± 34.2 | 6382 | NA | NA | 240/6382 (3.8) | 9.43 | NA | NA | PD |
| HD | 18 514/18365 | 62 ± 15.3 | 50.76 ± 37.8 | 36 879 | 1276/36 879 (3.5) | 5.9 | NA | NA |
CRP, C-reactive protein; F, female; LDL, low-density lipoprotein; M, male; NA, not available.
Risk of bias
The risk of bias rating for each cohort study was assessed by the NOS method (Table 2). In domains of selection and comparability, four studies with single arms did not fulfill the selection of the nonexposed cohort. The comparability of both groups was not satisfied in four studies due to the single-arm design. In domains of outcome assessment, all included studies were awarded full stars except the study by Woodward et al. [20]. The score evaluation of each study was more than five stars, which represented moderate qualities and moderate risks of bias of included studies.
Assessment of the quality of the studies according to NOS
| References | Selection | Comparability | Outcome assessment | Quality score | |||||
|---|---|---|---|---|---|---|---|---|---|
| ① | ② | ③ | ④ | ⑤ | ⑥ | ⑦ | ⑧ | ||
| Cheng et al. [18] | Yes | No | Yes | Yes | No | Yes | Yes | Yes | 6 |
| Woodward et al. [20] | Yes | No | Yes | Yes | No | Yes | Yes | No | 5 |
| Tuzcu et al.[6] | Yes | Yes | Yes | Yes | Yes | Yes | Yes | Yes | 8 |
| Szeto et al. [5] | Yes | No | Yes | Yes | No | Yes | Yes | Yes | 6 |
| Yu et al. [10] | Yes | Yes | Yes | Yes | Yes | Yes | Yes | Yes | 8 |
| Tien et al. [8] | Yes | Yes | Yes | Yes | Yes | Yes | Yes | Yes | 8 |
| Chou et al. [19] | Yes | Yes | Yes | Yes | Yes | Yes | Yes | Yes | 8 |
| Dong et al. [12] | Yes | No | Yes | Yes | No | Yes | Yes | Yes | 6 |
| Wang et al. [11] | Yes | Yes | Yes | Yes | Yes | Yes | Yes | Yes | 8 |
Representativeness of the exposed cohort.
Selection of the nonexposed cohort.
Ascertainment of exposure.
Demonstration that outcome of interest was not present at the start of the study.
Comparability of cohorts on the basis of the design or analysis.
Assessment of outcome.
Was follow-up long enough for outcomes to occur.
Adequacy of follow-up of cohorts.
Incidence of NOGMDs in PD
A total of nine studies [5, 6, 8, 10–12, 18–20] addressed the rate of NOGMDs in PD patients. Seven studies were from Asia [5, 8, 10–12, 18, 19], one from Europe [6] and one from the USA [20]. The NODM rate (the primary outcome) varied widely between studies, ranging from 3.8 to 13.8% (Table 1). The incidences of NODM in PD patients were reported as 9.43 and 24/1000 person-years in two large-sample scaled studies [11, 19]. By meta-analysis, the pooled incidence of NODM was 8% (eight studies; 95% CI 4–12%; P <0.001; Figure 2), adjusted by sample size. Heterogeneity was high, with I2 = 98%. The rates were 7% in Asians (seven studies; 95% CI 3–12%; P <0.001) and 10% in Caucasians (two studies; 95% CI 9–12%; P <0.001). The difference in NODM rates was not significant between ethnicities (P = 0.40). Five cohort studies [5, 6, 10, 12, 18] with 1089 PD patients reported the rate of NOIGT and the incidence was 15% (95% CI 3–31; P <0.001) with high heterogeneity (I2 = 97%). The regional rates were 15% in Asians (four studies; 95% CI 2–35%; P < 0.001) and 13% in Caucasians (one study [6]; 95% CI 5–27%; P <0.001). The difference in NOIGT rates also was not significant (P = 0.43) between Asians and Caucasians. Only two Asian studies [5, 10] reported the rate of NOIFG. The rate was 32% (95% CI 27–37; P <0.001), which was much higher than the rate of NODM in PD patients (P <0.01).
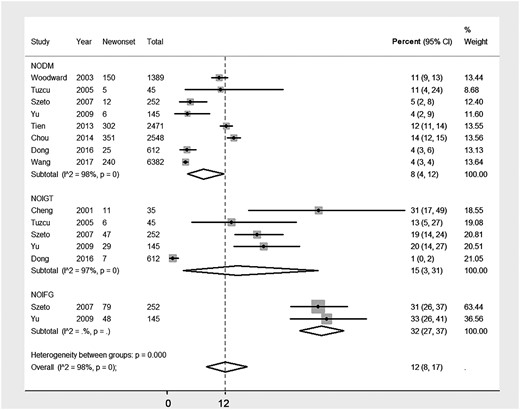
Incidence of NOGMD, including NODM, NOIGT and NOIFG, after initiation of PD.
The risk of NODM between PD and HD
The incidence of NODM in patients with ESRD who underwent HD was 9% (four studies [6, 8, 11, 19]; 95% CI 2–19%; P <0.001). There was not a significant difference in the NODM rate between PD and HD (8% versus 9%; P = 0.122). Then we performed a meta-analysis to compare the NODM incidence between PD and HD. Five studies [6, 8, 11, 19, 20] involving 12 835 PD patients and 74 623 HD patients were identified. There was no significant difference in the NODM risk between PD and HD [RR 0.99 (95% CI 0.69–1.40); P = 0.94; Figure 3]. However, the heterogeneity was high (I2 = 92%). The sensitivity analysis did not find a significantly different result.
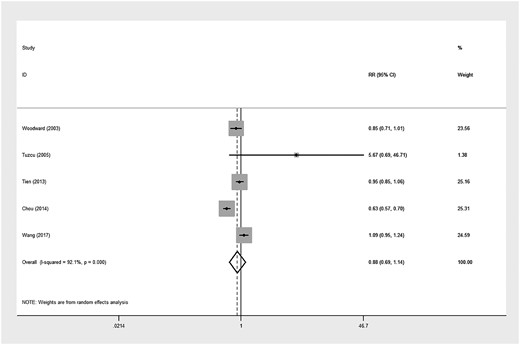
RR of NOD comparing PD with HD in patients with end-stage kidney disease.
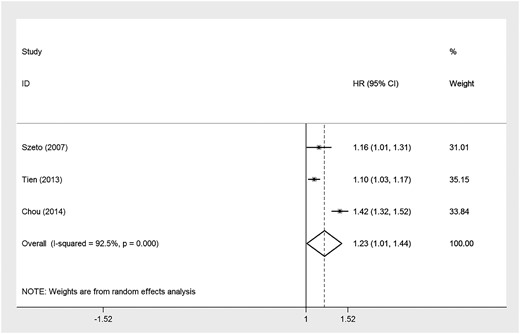
Mortality risk and NODM
The development of NODM was associated with an ∼6% increased risk of mortality [three studies [5, 8, 19]; HR 1.06 (95% CI 1.01–1.44); P <0.001; I2 = 92.5%] compared with non-DM PD patients (Figure 4). The sensitivity analysis confirmed a similar result.
Mortality risk of the development NODM.
Risk factors for developing NOGMDs in PD
Most included studies reported the risk factors or predictors for developing NOGMDs in PD patients (Table 1) [5, 6, 8, 10–12, 18–20]. The most common factors were greater inflammation, such as C-reactive protein level, older age and hyperlipidemia. Moreover, impaired fasting glucose before dialysis, high peritoneal transfer capacity, high glucose content of CAPD solutions, baseline comorbidities such as hypertension and cardiovascular diseases and higher body mass index are all risk factors mentioned in the studies for developing NOGMDs after dialysis.
DISCUSSION
PD patients were reported to be at high risk of developing glucose disorders due to exposure to glucose-based solutions for therapy. In this meta-analysis, we summarized the current knowledge about the occurrence of all kinds of GMD, including DM, IGT and IFG, after initiation of PD, and also their possible correlated influence factors; we performed a comparison between PD and HD and we evaluated the influence of GMD on the prognosis of PD patients.
The results showed that ∼55% of PD patients may develop at least one kind of GMD when starting PD treatment, which means one of two PD patients could have a problem with glucose regulation. The pooled incidence of NODM was 8% (95% CI 4–12). The incidences of NODM in PD patients were reported as 9.43 and 24/1000 person-years in two large-sample scaled studies [11, 19]; however, no pooled person-years incidence could be generated due to the small number of studies. The pooled incidence of NOIGT was 15% (95% CI 3–31) and NOIFG was 32% (95% CI 27–37). The difference was not significant between the ethnicities. The occurrence of GMD among PD patients was approximately six times greater than the prevalence of DM reported in the general population [2, 21]. Furthermore, it was shown to be correlated to a 6% higher risk of mortality, indicating a detrimental prognosis; however, the influence of NOGMD on the deterioration of residual renal function, catheter survival or infectious complications could not be evaluated due to a lack of statistics. It was reported by Yu et al. [10] that patients with high transfer status exhibited a reduced blood albumin and significantly elevated FBG during follow-up and also had the highest morbidity from hyperglycemia, which showed an indicative correlation between peritoneal transfer status and the occurrence of GMD.
Findings among studies comparing NODM risks between HD and PD were conflicting, and the pooled RR was nonsignificant; there were few data about NOIGT or NOIFG in HD, thus it could not be evaluated. Glucose is one of the essential constituents in dialysate both for HD and PD [22, 23]. The glucose load delivered by PD can be as much as 10–30% of a patient’s total energy intake, whereas ∼15–25 g of glucose may be absorbed during HD [11, 24]. Considering the greater glucose uptake from the PD dialysate, the increased incidence rate of glucose disorders in PD patients is reasonable. Tuzcu et al. [6] compared the NODM risk between CAPD and HD in a short-term follow-up of 7 months and PD was associated with a higher risk than HD, whereas the risk of NODM does not differ between HD and PD patients in the overall meta-analysis, including four long-term follow-up studies besides Tuzcu et al.’s study (range 2–5.8 years) [8, 11, 19, 20]. Our results showed that glucose load was not the only reason for the development of GMD. Insulin resistance, which is very common in both PD and HD [25, 26], is also closely related to the occurrence of GMD, which may contribute to the nonsignificance of NODM between PD and HD [27]. It seemed that no definitive conclusion could be drawn on the comparison between PD and HD based on the current statistics, so further evidence should be provided to prove this solution. Meanwhile, future studies comparing the incidence of NODM soon after PD (e.g. within 1–3 months) versus those with delayed NODM (e.g. after 6 months on dialysis) are also needed.
Seven of nine studies evaluated the risk factors associated with NOGMD. None of them drew conclusive results. C-reactive protein was the most-reported risk factor, reported significant by three of nine studies, indicating the potency of inflammation on the occurrence of GMD [5, 10, 12]. Lipid disorders [6, 18], fasting blood glucose level [5, 10] and comorbidities [5, 8] were also reported to be promising potential risk factors. The glucose load was calculated in four of the nine studies [5, 10, 12, 18], but most of them reported it to be nonsignificant [5, 12, 18]. The extent of glucose absorption via the peritoneal membrane varies among patients, therefore glucose load may not reflect actual glucose absorption [24]. Transport of glucose across the peritoneum is usually measured using positron emission tomography. Yu et al. [10] reported a negative relationship between FBG levels after 12-months of dialysis and the fourth hour D/D0, suggesting that patients with high peritoneal transfer status might be at higher risk of developing a glucose disorder. Indices representing insulin resistance, such as insulin resistance evaluated by the homeostasis model assessment method (HOMA-IR), leptin:adiponectin ratio or HOMA corrected for adiponectin (HOMA-AD), were not included by any of the involved studies [28–30]. However, patients with a higher body mass index [12] or lipid disorders [6, 18] were reported to have a higher risk of NOGMD, which implied the possibility of insulin resistance indices to be the potential risk factors. High-quality multicenter studies with properly designed risk factor evaluation are required to provide further evidence.
There are several limitations of our study. First, this meta-analysis is based on a large number of incidences, while the data of person-years are insufficient. Thus the point estimates of our pooled incidences should be interpreted cautiously. Second, high statistical heterogeneity among studies was found. A potential important source of heterogeneity is the differences among different hospitals and ethnicities screened in terms of age distribution, gender distribution and diagnostic screening methods. The sampling error may also lead to high heterogeneity of the data. Third, only a few of the included studies reported on NOIFG, NOIGT and HD patients within specific subgroups, so limited analyses could be done for these results separately. Last but not the least, studies using FBG as a glucose measuring method did not mention the time point of PD exchange and blood sampling in the morning, which could overestimate the occurrence of IGT, except Dong et al. [12]; neither did studies using 2-h OGTT, which could exaggerate the occurrence of IGT or DM as well. As common PD solutions contain glucose and ∼60% of glucose is absorbed during a normal dwell (depending on peritoneal transport type and dwell time). If the patient made the PD exchange in the morning before blood sampling, then plasma glucose would increase due to glucose absorption from the dialysate. This is particularly prominent with 4.25% hypertonic glucose dialysate, when plasma glucose can rise to 10 mmol/L [31]. Future studies should point out that the absolute fasting status with dialysate draining for at least 10 h is needed to complete the FBG. Studies using 2-h OGTT did not mention the suspension of PD exchange at the same time, which should also be mentioned in future studies.
In conclusion, glucose exposure of PD patients has drawn more and more attention. Around half of these patients could develop a glucose disorder after starting PD treatment, which could affect the prognosis of these patients by significantly increasing mortality. The incidence did not differ among different ethnicities or between PD and HD. Although the risk factor analysis did not draw a definitive conclusion, the 75 g oral glucose tolerance test should be routinely performed in PD patients, and more detailed energy and nutrient evaluations should be carried out in these patients concerning their glucose load and peritoneal transfer status.
FUNDING
Z.-G.M. is a Fellow of the International Society of Nephrology and this work was funded in part by the National Nature Science Fund of China (81570621, 81770670, 81700579 and 81200499), the Outstanding Young Investigator Fund of the Shanghai Municipal Health Planning Commission (2018YQ25) and the Outstanding Young Investigator Fund of Changzheng Hospital. Funding of Yueyang Hospital 2018 (2018YJ04), Shanghai science and technology talent program (19YF1450300).
CONFLICT OF INTEREST STATEMENT
None declared.
REFERENCES
Author notes
Cheng Xue, Yan-Yan Gu, Cheng-Ji Cui and Chen-Chen Zhou contributed equally to this work


Comments