


Abstract
This study examined the impact of recurrent episodes of acute kidney injury (AKI) on patient outcomes.
The Welsh National electronic AKI reporting system was used to identify all cases of AKI in patients ≥18 years of age between April 2015 and September 2018. Patients were grouped according to the number of AKI episodes they experienced with each patient’s first episode described as their index episode. We compared the demography and patient outcomes of those patients with a single AKI episode with those patients with multiple AKI episodes. Analysis included 153 776 AKI episodes in 111 528 patients.
Of those who experienced AKI and survived their index episode, 29.3% experienced a second episode, 9.9% a third episode and 4.0% experienced fourth or more episodes. Thirty-day mortality for those patients with multiple episodes of AKI was significantly higher than for those patients with a single episode (31.3% versus 24.9%, P < 0.001). Following a single episode, recovery to baseline renal function at 30 days was achieved in 83.6% of patients and was significantly higher than for patients who had repeated episodes (77.8%, P < 0.001). For surviving patients, non-recovery of renal function following any AKI episode was significantly associated with a higher probability of a further AKI episode (33.4% versus 41.0%, P < 0.001). Furthermore, with each episode of AKI the likelihood of a subsequent episode also increased (31.0% versus 43.2% versus 51.2% versus 51.7% following a first, second, third and fourth episode, P < 0.001 for all comparisons).
The results of this study provide an important contribution to the debate regarding the need for risk stratification for recurrent AKI. The data suggest that such a tool would be useful given the poor patient and renal outcomes associated with recurrent AKI episodes as highlighted by this study.
INTRODUCTION
Acute kidney injury (AKI) is associated with increased patient morbidity and mortality [1, 2]. While in-hospital consequences of AKI are well-described, consequences beyond the index event are less well-characterized. Based on a presumption that early identification may help raise standards of care and improve patient outcomes, an automated real-time electronic (e)-alert system for AKI based on the Kidney Disease: Improving Global Outcomes (KDIGO) change in creatinine diagnostic criteria has been implemented nationally across all areas of the National Health Service (NHS) in England and Wales. Using the e-AKI alert, we have developed a centralized data collection system to provide a comprehensive characterization of the incidence and outcomes of AKI identified by an e-alert in Wales, United Kingdom [3–5].
Previous data suggest that AKI is associated with higher rates of re-hospitalization, with up to 20% of patients readmitted within 30 days [6]. Relatively few studies, however, have described the epidemiology of recurrent AKI. In the largest study to date, Liu et al. [7] in a study of 38 659 patients who experienced a hospitalized episode of AKI, identified a second AKI episode in 28.6% of patients. This is similar to that reported by Siew et al. [8] demonstrating a 25% recurrence rate for AKI within 12 months of discharge. The latter study, however, described cases from a regional Veterans Administration database and therefore focused predominantly on a hospitalized male patient cohort. Other studies addressing recurrent AKI are relatively small in patient numbers [9, 10], or focus on specific patient cohorts [11, 12]. The aims of this study were to determine the incidence and outcomes of repeated episodes of AKI and identify potential risk factors for recurrence from a large population-based data set.
MATERIALS AND METHODS
This case series study used the Welsh National e-alerting system for AKI to identify all cases of AKI in patients over the age of 18 years between April 2015 and September 2018. The Medical Record Number, a unique reference number allocated to patients registered in the National Laboratory Information Management System, was used as the patient identifier. The study has been approved under the conditions of ‘Service Evaluation Project Registration’.
The e-alerting system generates alerts by comparing a current creatinine value to historic creatinine measurements for the same patient in real time. It defines AKI according to KDIGO increase in creatinine parameters [3]. An AKI episode was defined as a period of 30 days. Any AKI e-alert for the same patient within 30 days of the initial alert was not considered a new episode. The first AKI episode was defined as the index episode. To examine the impact of recurrent episodes, patients were classified as either having one episode, two episodes, three episodes, or four or more episodes.
To avoid spurious results resultant from fluctuations in creatinine related to renal replacement therapies, dialysis patients, patients with a known renal transplant and alerts generated in renal ward settings were excluded from the analysis [3].
In addition to measurements of renal function, data were collected on patient age, gender, stage of index AKI episode, pre-existing chronic kidney disease (CKD) [estimated glomerular filtration rate (eGFR) was calculated using the CKD Epidemiology Collaboration eGFR equation [13] and pre-existing CKD was defined as an eGFR <60mL/min per 1.73 m2 derived from the baseline serum creatinine (SCr) associated with the index episode], and the clinical location at which the index episode was generated. An episode was defined as hospital-acquired (HA)-AKI if the initial alert was transmitted by a blood test request in an inpatient or intensive therapy unit (ITU) and high dependency setting. All other episodes were defined as community-acquired (CA)-AKI.
Data on patient mortality were collected from the Welsh Demographic Service [14]. Recovery was defined as achievement of a SCr value during the episode no longer in keeping with the definition of AKI when compared with the baseline SCr value associated with the episode. Patients were only included in the recovery analysis if they survived their episode and had at least one SCr test during the episode. Socio-economic classification of patients was derived from the Welsh Index of Multiple Deprivation (WIMD) score [15]. This is the Welsh Government’s official measure of relative deprivation in which the population of Wales is divided into 1909 geographical units called lower super output areas (LSOAs) each with an average population of 1600 people. The WIMD score is constructed from a weighted sum of the deprivation score for each of the following domains: income (23.5%), employment (23.5%), health (14.0%), education (14.0%), access to services (10.0%), community safety (5.0%), physical environment (5.0%) and housing (5.0%). Patients were grouped according to the WIMD score by their postcode and corresponding LSOA of residence, and the ranked data were categorized into percentiles, with percentile 1 being the most socio-economically deprived and percentile 100 being the least deprived.
Statistical analysis was carried out using SPSS software, version 25 (IBM SPSS, Chicago, IL, USA). Student’s t-test was used for analysis of normally distributed data. Categorical data were compared using a Pearson chi-squared test. Kaplan–Meier analysis was used to estimate and compare survival of patient groups. Binomial logistic regression was used to understand whether 30-day AKI-associated mortality, and recovery from an AKI episode, can be predicted by the number of episodes incurred by a patient. We did this analysis both unadjusted and adjusted for patient demographic covariates, which included pre-existing CKD, AKI stage of index episode, AKI type of index episode, gender and age. P<0.05 were considered statistically significant. For binomial data, 95% confidence intervals were defined as 1.96 multiplied by the standard error.
Data were collected from all Health Boards in the NHS in Wales, representing a population of 3.06 million people. A total of 153 776 episodes of AKI in 111 528 patients were identified. Average follow-up time for index episodes was 448.5 ± 401.4 days with a median of 349.3 days. Details of cohort creation are shown in Figure 1.
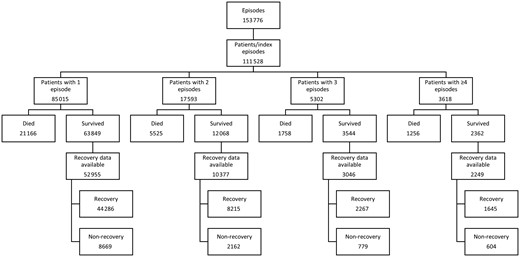
Flow diagram of cohort creation, with exclusion and inclusion criteria.
RESULTS
Patient characteristics
The distribution of AKI severity for the index episode was AKI1 78.4%, AKI2 14.2% and AKI3 7.4%. The mean age of the whole cohort was 70.91 ± 17.3 years. Fifty-three per cent of the AKI patients were female. Pre-existing CKD was identified in 28.3%. A total of 50.99% cases were HA-AKI and 49.01% CA-AKI.
Of those who experienced AKI and survived the index episode, 29.3% (26 513) experienced a second episode, 9.9% (8920) a third episode and 4.0% (3618) experienced fourth or more episodes. In total, this represents 68 761 recurrent AKI episodes. The second episode occurred a mean of 231 ± 358 days following the first episode, the third episode a mean of 169 ± 184 days following the second, and the fourth a mean of 134.8 ± 145 days following the third episode. Patient demographics and location of the index episode are shown in Table 1.
Demography of patients with one AKI episode, two AKI episodes, three AKI episodes and four or more AKI episodes
| One episode | Two episodes | Three episodes | Four or more episodes | |
|---|---|---|---|---|
| Number of patients, n (% of all patients) | 85 015 (76.2) | 17 593 (15.8) | 5302 (4.8) | 3618 (3.2) |
| Mean age ± SD at index episode, year | 70.49 ± 17.9 | 73.22 ± 15.1 | 71.84 ± 14.84 | 67.94 ± 15.49 |
| Gender, % (n) | ||||
| Male | 46.3 (39 353) | 47 (8428) | 49.8 (2638) | 47.9 (1732) |
| Female | 53.7 (45 662) | 52.1 (9165) | 50.2 (2664) | 52.1 (1886) |
| Pre-existing CKD, % (n) | 28.8 (24 493) | 35.6 (6260) | 33.3 (1932) | 31.1 (1125) |
| AKI stage of index episode, % (n) | ||||
| Stage 1 | 78.2 (66 446) | 79.2 (13 936) | 79.7 (4224) | 79.9 (2891) |
| Stage 2 | 14.5 (12 378) | 13.3 (2335) | 12.4 (655) | 12.5 (452) |
| Stage 3 | 7.3 (6191) | 7.5 (1322) | 7.9 (423) | 7.6 (275) |
| Type of AKI at index episode, % (n) | ||||
| CA-AKI | 50.9 (43 286) | 51.7 (9086) | 51.4 (2724) | 49.1 (1777) |
| HA-AKI | 49.1 (41 729) | 48.3 (8507) | 48.6 (2578) | 50.9 (1841) |
| Specialty of AKI at index episode, % of HA (n) | ||||
| General medicine | 22.8 (9501) | 24.3 (2071) | 23.0 (593) | 21.7 (399) |
| General surgery | 13.0 (5427) | 12.8 (1091) | 13.9 (357) | 17.1 (314) |
| Trauma and orthopaedic | 9.2 (3855) | 8.1 (782) | 6.5 (168) | 5.7 (104) |
| Cardiology | 7.5 (3137) | 9.2 (782) | 9.8 (252) | 8.9 (164) |
| ITU and high dependency | 10.1 (4232) | 9.0 (766) | 10.4 (269) | 12.3 (227) |
| Mean WIMD percentile ± SD | 47.91 ± 28.32 | 47.41 ± 28.15 | 46.20 ± 27.96 | 46.06 ± 28.11 |
Patient demographics associated with recurrent AKI
Patients experiencing recurrent AKI were significantly older than those who had a single episode (two or more episodes 72.22 ± 15.2 years versus one episode 70.49 ± 17.9 years, P < 0.001). For those patients with repeated episodes, those who experienced two episodes were significantly older (73.22 ± 15.08 years) than those who experienced three episodes (71.84 ± 14.85 years, P < 0.001), who were in turn significantly older than those who experienced four or more episodes (67.94 ± 15.49 years, P < 0.001). In those surviving the first AKI episode, a higher proportion of male patients experienced recurrent episodes of AKI (two or more episodes: male 29.6% versus female 25.9%, P < 0.001).
A higher percentage of patients with repeated episodes of AKI had pre-existing CKD compared with those who experienced only one episode (two or more episodes 35.1% versus one episode 28.8%). There was also a significantly higher percentage of pre-existing CKD in patients who experienced two (35.6%) or three (33.3%) recurrent episodes compared with those who experienced four or more episodes (31.1%, P < 0.001).
The severity of the index AKI episode was assessed by AKI stage at presentation. There were significantly more Stage 1 index episodes for patients who had multiple episodes, compared to patients who had a single episode (one episode: Stage 1 = 78.2%, Stage 2 = 14.6%, Stage 3 = 7.3%; two or more episodes: Stage 1 = 79.4%, Stage 2 = 13.0%, Stage 3 = 7.6%, P < 0.001).
For surviving patients with biochemistry data available on renal outcome, non-recovery of renal function following any AKI episode was associated with a higher probability of a further AKI episode (33.4% versus 41.0%, P < 0.001). Furthermore, with each episode of AKI, the likelihood of another subsequent episode also increased (Figure 2). If renal function returned to baseline, the likelihood of at least one further episode of AKI rose from 30.1% following the first episode to 48.3% following four AKI episodes. If renal function did not recover to baseline, the likelihood of at least one further episode of AKI rose from 35.3% following the first episode to 59.7% following four AKI episodes.
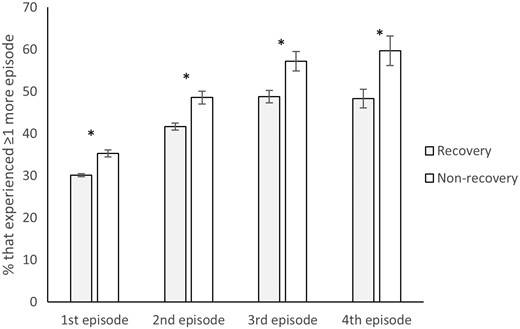
The impact of renal recovery of AKI episodes on the probability of recurrent AKI episodes. A total of 76 744 patients survived and had recovery data available for their index (first) episode (63 349, recovery; 13 395, non-recovery), 19 063 of those that recovered had a second episode and 4726 of those that did not recover had a second episode; 18 282 patients survived and had recovery data available for their second episode (14 078, recovery; 4204, non-recovery), 5863 of those that recovered had a third episode and 2041 of those that did not recover had a third episode; 6245 patients survived and had recovery data available for their third episode (4425, recovery; 1820, non-recovery), 2158 of those that recovered had a fourth episode and 1041 of those that did not recover had a fourth episode; 2635 patients survived and had recovery data available for their fourth episode (1859, recovery; 776, non-recovery), 898 of those that recovered had a further episode and 463 of those that did not recover had a further episode. Error bars represent 95% confidence intervals. Asterisks represent statistically significant differences.
Recurrent episodes of AKI were more common following an index case of HA-AKI compared with an index case of CA-AKI. Location of the index episode did not influence the likelihood of a recurrent episode. Figure 3 shows the full patient journey for patients who had multiple episodes and highlights that recurrent episodes were more likely to be the same type as their index episodes. A second episode of AKI occurred in 28.9% of patients surviving an index HA-AKI episode compared with 26.4% patients surviving an index CA-AKI episode (P < 0.001). Similarly, compared with CA, more patients surviving an HA index episode had a third episode and fourth or more episodes (three episodes: 7.9% versus HA-AKI 8.8%, P < 0.001; four or more episodes: 5.2% versus HA-AKI 6.3%, P < 0.001). To assess the association between recurrent AKI and social deprivation we looked at the mean WIMD score where a lower WIMD score corresponds to a higher level of social deprivation. Recurrent AKI was associated with greater social deprivation as the mean WIMD score was significantly lower for patients with recurrent AKI episodes (WIMD score 46.9 ± 28.0) compared with those with a single AKI episode (WIMD score 47.9 ± 28.3 P < 0.001).
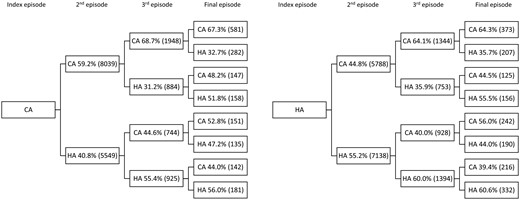
Flow diagram of patient journey for patients with multiple episodes. A total of 26 514 patients had more than one episode and were included in the analysis (13 588, CA; 12 926, HA).
Significance of AKI
Mortality
Thirty-day mortality following a single episode of AKI was 24.9% (Figure 4A). Repeated episodes of AKI (i.e. two or more episodes) were associated with significantly higher 30-day mortality (31.3%) than a single episode (P < 0.001). Thirty-day mortality was also significantly higher for patients who experienced two (31.4%) or three (33.6%) episodes compared with those who experienced four or more episodes (28.2%) of AKI (P < 0.001). Kaplan–Meier curves (censored at 3 years of follow-up) showing survival depending on the number of AKI episodes are in Figure 4B. Censored survival was significantly better for patients who had a single episode of AKI compared with multiple episodes (P < 0.001), but was not significantly different for patients who experienced two, three or four or more episodes. Overall mortality with a maximum follow-up time of 1330 days was 24.9% for patients with one episode and 31.3% for patients with multiple episodes. This is in comparison with the age-standardized mortality rate for Wales of 1035.6 per 100 000 population [14].
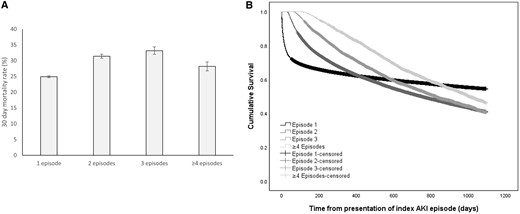
The impact of recurrent episodes of AKI on 30-day mortality and patient survival. (A) Thirty-day mortality rates for patients with one AKI episode, two AKI episodes, three AKI episodes and four or more AKI episodes. Mortality data were available for 111 528 patients (85 015, one episode; 17 953, two episodes; 5302, three episodes; 3618, four or more episodes). (B) Kaplan–Meier survival curves for patients with one AKI episode, two AKI episodes, three AKI episodes and four or more AKI episodes. Error bars represent 95% confidence intervals.
Table 2 shows that males were significantly more likely to experience death within 30 days compared with females. Moreover, the likelihood of death increased significantly with age, if a patient had pre-existing CKD, and if the index episode was HA and Stage 3. Binary logistic regression also showed that for patients who experienced two episodes, the odds of dying within 30 days were 38% [odds ratio (OR) = 1.38, P < 0.001] higher than for patients who experienced just one episode, 50% (OR = 1.50, P < 0.001) for three episodes and 18% (OR = 1.18, P < 0.001) for four or more. The adjusted values in Table 2 show that when adjusted for all other variables, the odds of death increased for all groups except those patients with two episodes.
Adjusted and unadjusted ORs for risk factors in predicting 30 day AKI associated mortality
| Unadjusted | Adjusteda | |||
|---|---|---|---|---|
| OR (95% CI) | P | OR (95% CI) | P | |
| Total number of episodes | ||||
| 1 | Reference | – | – | – |
| 2 | 1.38 (1.33–1.43) | 0.000 | 1.33 (1.28–1.38) | 0.000 |
| 3 | 1.50 (1.41–1.59) | 0.000 | 1.53 (1.44–1.63) | 0.000 |
| ≥4 | 1.18 (1.10–1.28) | 0.000 | 1.37 (1.27–1.48) | 0.000 |
| Gender | ||||
| Female | Reference | – | – | – |
| Male | 1.28 (1.25–1.32) | 0.000 | – | – |
| Pre-existing CKD | ||||
| No | Reference | – | – | – |
| Yes | 1.10 (1.07–1.14) | 0.000 | – | – |
| AKI stage of index episode | ||||
| Stage 1 | Reference | – | – | – |
| Stage 2 | 1.77 (1.71–1.84) | 0.000 | – | – |
| Stage 3 | 1.91 (1.82–2.01) | 0.000 | – | – |
| AKI type of index episode | ||||
| CA | Reference | – | – | – |
| HA | 1.61 (1.55–1.66) | 0.000 | – | – |
| Age at index episode, years | 1.04 (1.04–1.04) | 0.000 | – | – |
Adjusted for sex, pre-existing CKD, AKI stage of index episode, AKI type of index episode and age at index episode.
CI, confidence interval.
Thirty-day renal outcome
For each AKI episode between 14% and 19% of patients had no biochemical data available to assess recovery of renal function and were excluded. Following a single episode, recovery was achieved in 83.6% of patients (Figure 5). This was significantly higher than for patients who had repeated episodes (77.8%, P < 0.001). Recovery was also lower for patients who experienced three (74.4%), or four or more episodes (73.9%) compared with patients who experienced only two episodes of AKI (79.2%, P < 0.001).
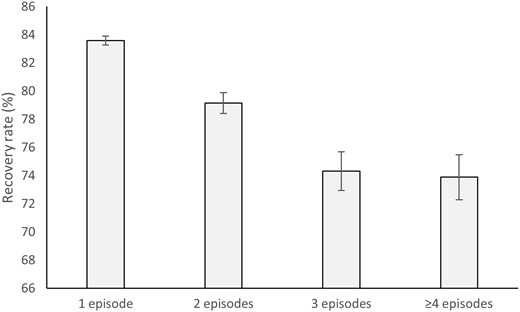
Recovery of renal function for patients with one AKI episode, two AKI episodes, three AKI episodes and four or more AKI episodes. A total of 82 059 patients survived and had recovery data available (63 849, one episode; 12 068, two episodes; 3544, three episodes; 2598, four or more episodes). Error bars represent 95% confidence intervals.
Table 3 shows that males were significantly less likely to recover compared with females. Moreover, the likelihood of recovery increased significantly with age, and if the index episode was HA, and decreased if a patient had pre-existing CKD, and the index episode was Stage 3. Binary logistic regression also showed that for patients who experienced two episodes, the odds of recovering were 26% (OR = 0.75, P < 0.001) lower than for patients who experienced just one episode, 43% (OR = 0.57, P < 0.001) for three episodes and 46% (OR = 0.54, P < 0.001) for four or more. The adjusted values in Table 3 show that when adjusted for all other variables, the odds of recovery increased for all groups.
Adjusted and unadjusted ORs for risk factors in predicting recovery from an AKI episode
| Unadjusted | Adjusteda | |||
|---|---|---|---|---|
| OR (95% CI) | P | OR (95% CI) | P | |
| Total number of episodes | ||||
| 1 | Reference | – | Reference | – |
| 2 | 0.75 (0.71–0.79) | 0.000 | 0.79 (0.74–0.83) | 0.000 |
| 3 | 0.57 (0.52–0.62) | 0.000 | 0.61 (0.56–0.67) | 0.000 |
| ≥4 | 0.54 (0.49–0.59) | 0.000 | 0.56 (0.50–0.61) | 0.000 |
| Gender | ||||
| Female | Reference | – | – | – |
| Male | 0.75 (0.73–0.79) | 0.000 | – | – |
| Pre-existing CKD | ||||
| No | Reference | – | – | – |
| Yes | 0.71 (0.68–0.75) | 0.000 | – | – |
| AKI stage of index episode | ||||
| Stage 1 | Reference | – | – | – |
| Stage 2 | 0.71 (0.67–0.76) | 0.000 | – | – |
| Stage 3 | 0.41 (0.39–0.44) | 0.000 | – | – |
| AKI type of index episode | ||||
| CA | Reference | – | – | – |
| HA | 2.11 (2.02–2.21) | 0.000 | – | – |
| Age at index episode, years | 1.00 (1.00–1.01) | 0.000 | – | – |
Adjusted for sex, pre-existing CKD, AKI stage of index episode, AKI type of index episode and age at index episode.
CI, confidence interval.
DISCUSSION
Previous studies have suggested that AKI is a risk factor for CKD progression [16–18]. Observational studies link the progression of CKD including the development of end-stage renal failure to previous episodes of AKI. Few studies have, however, examined the epidemiology or impact of recurrent episodes of AKI. A study focused on patients with diabetes mellitus suggests that AKI episodes are associated with a cumulative risk for developing advanced CKD [19], and studies in critically ill patients suggest that recurrent AKI is associated with worse outcomes [10, 12]. A small single-centre retrospective study of only 350 patients surviving AKI suggested that development of CKD was more likely with recurrent AKI [10]. In what is to our knowledge the largest study to date, using a national data set, we have shown that roughly a third of patients who have an episode of AKI will experience at least one further episode and a significant number of patients experience multiple episodes. These data are similar to those of Liu et al. in which almost a third of 40 000 hospitalized AKI cases experienced an episode of recurrent AKI during a median follow-up of 1.8 years [7]. Our data are also consistent with the data of Siew et al., drawn from almost 12 000 AKI cases based on a regional Veterans Administration database, in which almost one in eight patients experienced two recurrences [8]. Our study, however, is drawn from >150 000 episodes and it is of note that we have not focused on hospitalized patients and instead used population-based data. We have previously demonstrated that a focus on hospitalized patients with a diagnosis based on retrospective coding data leads to significant under-reporting of AKI compared with e-AKI alerts [3, 4, 20].
The significance of repeated episodes is highlighted by the increase in mortality for patients who experience multiple episodes. This increase in short- and longer term mortality was higher for all cohorts with repeated AKI episodes. Regression analysis also showed that the likelihood of death within 30 days of an AKI episode was higher for patients with recurrent episodes compared with patients with a single episode. While the highest short-term mortality was seen in the groups with either two or three AKI episodes, 30-day mortality in those experiencing four or more episodes remains higher than those experiencing only one episode. Although the group of patients who experience four or more episodes contained >3500 patients, this was the smallest cohort and therefore the lower mortality should be interpreted cautiously. Moreover, it is notable that 30-day mortality does not increase monotonically beyond the third episode of AKI. Rather this could represent survivor selection bias, since to have a fourth episode of AKI, patients have already survived three episodes as is illustrated in the Kaplan–Meier curves. The lack of a stepwise increase in mortality with each recurrent episode of AKI likely represents survival bias. This is supported by the data, which demonstrate that a higher proportion of the patients who experience recurrent episodes of AKI have AKI Stage 1 at the index episode, while a higher mortality is related to AKI Stages 2 and 3. The longer term censored data, in contrast, suggest that mortality for all repeated episodes is similar and significantly higher than for a single episode. Our data also suggest that each additional episode of renal injury makes recovery of renal function less likely. Regression analysis showed that the likelihood of recovery was lower for patients with recurrent episodes compared with patients with a single episode. It should be noted that baseline renal function is reset at each AKI episode not to compound recovery data from ‘hangovers’ related to any preceding episodes. The data also suggest that each repeated episode carries a worse outcome, in terms of mortality and deterioration in renal function. This is a significant observation, as non-recovery from AKI is an important factor determining long-term outcome and CKD progression [9, 16, 21].
A first step in preventing recurrent AKI is to identify patients at highest risk of having multiple AKI episodes. The concept of a ‘drug holiday’ and the cessation of potentially nephrotoxic medication during an AKI episode, and also for those at risk of developing AKI due to an inter-current illness, are widely advocated. Generally, beyond either the acute AKI episode or the acute illness placing a patient at risk, current practice is to restart these medications. If there is a cohort of patients in whom the likelihood of recurrence can be predicted, the benefit of restarting such medication needs to be balanced by the risk of AKI recurrence. Our data suggest those most likely to have repeated episodes are older patients, with pre-existing CKD and those with incomplete recovery of their renal function following an acute episode. Interestingly, the data also suggest that patients from socially deprived areas are at higher risk of recurrent episodes. Previously, we have demonstrated that social deprivation is associated with higher incidence and worse outcome following AKI [22]. This was related to a greater burden of CKD at an earlier age. Interestingly, the severity of AKI at presentation of the index case was not useful in predicting recurrent episodes, despite a significant proportion of patients having AKI Stage 2 or 3. This is consistent with the observations of Liu et al. in which the severity of AKI was not associated with recurrent AKI [7]. This may in part be driven by higher rates of death observed in this population [3].
Current evidence suggests post-discharge care may improve outcomes for patients discharged from hospital following medical emergencies [23, 24]. For example, following acute myocardial infarction, early follow-up with a cardiologist is associated with decreased mortality and improved compliance with secondary preventative measures [25, 26]. The follow-up of patients following an AKI episode remains undefined. Not all patients who experience an episode of AKI can or should be followed up in a specialist clinic, given the large number of patients this would entail and the fact that in the majority of cases AKI is not indicative of intrinsic renal disease. Harel et al. [27], however, suggest specialist follow-up following AKI does translate into better outcomes. Their study suggested that nephrologist follow-up improves all-cause mortality of severe AKI survivors, although the study focused only on patients who required dialysis during an inpatient AKI episode. Published data suggest that <10% of patients who experience an episode of dialysis-requiring AKI see a nephrologist within the first year [28]. Dialysis-requiring AKI, however, represents only a small minority of patients who experience an episode of AKI. An alternative approach to identify who might benefit from specialist follow-up may be to highlight those most likely to experience recurrent AKI episodes. This would optimize a patient’s chance of avoiding repeated AKI episodes, which are associated with poor outcomes. We suggest that patients with pre-existing CKD who suffer AKI and those whose renal function fails to recover to its pre-AKI baseline would be two overlapping cohorts that may benefit from specialist nephrology referral and follow-up.
Although this study is to our knowledge the first national study using an e-alert-based system to characterize the magnitude and impact of recurrent AKI, its findings need to be qualified by its limitations. Using an IT-based approach precludes inclusion of clinical information, such as patient comorbidity and linkage to primary care data sets, and lacks the cause of AKI, the need for RRT and cause of death. As a result, we were unable to examine the relationship between patient clinical characteristics and the rate of AKI recurrence. Previous data suggest that patient-related chronic conditions such as heart failure, liver disease and cancer all associate with a higher rate of recurrent AKI [7, 8]. Future studies able to access detailed clinical data would allow development of a formal risk prediction tool for recurrent AKI using a similar approach to what we have used for the RISK study to predict an index episode of AKI [29]. Similarly, the use of biochemistry data precludes the use of urine output-based definitions of AKI, although it should be noted that these data are not systematically available and are rarely accessible to large population-based studies. Finally, the diagnosis of AKI is made by comparing creatinine values on an individual patient against previous results. This approach does consequently exclude patients with no previous measurements of creatinine on the system. An alternative suggestion has been the use of population-based estimated reference creatinine measures [30]. Currently, however, in our clinical setting when a creatinine value is above the reference range and does not generate an alert, a message to highlight the raised value accompanies the result report.
The strengths of our study include the size of the patient data set and the length of follow-up. To our knowledge, this is the largest published report addressing recurrent AKI with >150 000 AKI episodes. Due to its size, the data set included a substantial representation of all stages of AKI including those with more severe AKI, as well as a broad demography. The data therefore allow the results to be generalized to broader populations than previously published studies. Use of the e-alerting system provides access to cases of AKI that occur in both hospital and community settings, including primary care, and therefore overcomes some limitations inherent in studies of AKI in hospitalized cohorts or in which AKI diagnosis is reliant on hospital coding [31–34].
In conclusion, the results of this study provide an important contribution to the debate regarding the need for risk stratification for recurrent AKI. The data suggest that such a tool would be useful given the poor patient and renal outcomes associated with recurrent episodes of AKI as highlighted by this study. Further work is, however, required to determine the specific process of care and interventions to affect clinical outcomes in those patients at high risk of recurrent AKI.
FUNDING
The work was carried out under the auspices of the Welsh AKI Steering Group, which is sponsored by the Welsh Renal Clinical Network and the Welsh Government.
AUTHORS’ CONTRIBUTIONS
J.H. analysed the data, produced the figures and wrote the report. J.D.W. and J.G. interpreted the data and wrote the report. A.O.P. set up the programme of work, designed the study, interpreted the data and wrote the report. The work was carried out under the auspices of the Welsh AKI steering group, which is sponsored by the Welsh Renal Clinical Network and Welsh Government.
CONFLICT OF INTEREST STATEMENT
None declared.
REFERENCES
NHS Wales Informatics Service. Welsh Demographic Services,
Welsh Index of Multiple Deprivation,
Risk Investigators.


Comments