


Abstract
Citric acid–based bicarbonate haemodialysis (CIT-HD) has gained more clinical acceptance over the last few years in France and is a substitute for other acidifiers [e.g. acetic acid (CH3COOH) and hydrochloric acid (HCl)]. This trend was justified by several clinical benefits compared with CH3COOH as well as the desire to avoid the consequences of the corrosive action of HCl, but a nationwide clinical report raised concerns about the long-term safety of CIT-HD. The aim of this study was to assess the long-term effects of CIT-HD exposure on patient outcomes in western France.
This is a population-based retrospective multicentre observational study performed in 1132 incident end-stage kidney disease patients in five sanitary territories in western France who started their renal replacement therapy after 1 January 2008 and followed up through 15 October 2018. Relevant data, collected prospectively with the same medical software, were anonymously aggregated for the purposes of the study. The primary goal of this study was to investigate the effects of citrate exposure on all-cause mortality. To provide a control group to CIT-HD one, propensity score matching (PSM) at 2:1 was performed in two steps: the first analysis was intended to be exploratory, comparing patients who received citrate ≤80% of the time (CIT-HD ≤80) versus those who received citrate >80% of the time (CIT-HD >80), while the second analysis was intended to be explanatory in comparing patients with 0% (CIT-HD0) versus 100% citrate time exposure (CIT-HD100).
After PSM, in the exploratory part of the analysis, 432 CIT-HD ≤80 patients were compared with 216 CIT-HD >80 patients and no difference was found for all-cause mortality using the Kaplan–Meier model (log-rank 0.97), univariate Cox regression analysis {hazard ratio [HR] 1.01 [95% confidence interval (CI) 0.71–1.40]} and multivariate Cox regression analysis [HR 1.11 (95% CI 0.76–1.61)] when adjusted for nine variables with clinical pertinence and high statistical relevance in the univariate analysis. In the explanatory part of the analysis, 316 CIT-HD0 patients were then compared with 158 CIT-HD100 patients and no difference was found using the Kaplan–Meier model (log-rank 0.06), univariate Cox regression analysis [HR 0.69 (95% CI 0.47–1.03)] and multivariate Cox regression analysis [HR 0.87 (95% CI 0.57–1.33)] when adjusted for seven variables with clinical pertinence and high statistical relevance in the univariate analysis.
Findings of this study support the notion that CIT-HD exposure ≤6 years has no significant effect on all-cause mortality in HD patients. This finding remains true for patients receiving high-volume online haemodiafiltration, a modality most frequently prescribed in this cohort.
INTRODUCTION
Bicarbonate (HCO3) haemodialysis (HD) requires acidification of dialysis fluid to prevent calcium (Ca) and magnesium (Mg) precipitation to keep their concentration constant. Three acids (i.e. acidifiers—acetic acid (CH3COOH), hydrochloric acid (HCl) and citric acid (C6H8O7; CIT)] are currently used at low concentration in HD. CH3COOH was the first to be used. CH3COOH-based HCO3 haemodialysis (CH3COOH-HD) was associated with haemodynamic instability, particularly in high-efficiency HD and online haemodiafiltration (HDF) with suboptimal biocompatibility marked by cell toxicity [1]. Hydrochloric-based HCO3 haemodialysis (HCl-HD) was introduced subsequently to correct side effects of CH3COOH. On the positive side, HCl-HD was shown to improve haemodynamic tolerance in short-term studies, with potential survival benefits in long-term observational studies [2,]. In contrast, HCl-HD was associated with premature ageing of concentrate piping and damage to dialysis machine (e.g. pump and tubing); furthermore, HCl was recognized as being more difficult to transport and store. CIT was the third acidifier to be introduced. CIT is known to chelate ionized Ca (iCa) and magnesium (iMg) conferring anticoagulant activity in different settings (e.g. blood bank storage for transfusion, catheter locking solution and regional citrate–Ca anticoagulation). CIT-based HCO3 haemodialysis (CIT-HD) was introduced to solve issues observed with other acids. CIT dissociates into citrate, a naturally existing anion that acts as an indirect buffer base after conversion to HCO3 through its metabolic pathway—not modified by chronic renal failure [3,]—in muscle and especially the liver, whose dysfunction prohibits its use. In CIT-HD, despite low concentrations (0.8–1.0 mmol/L), citrate reduces dialysate Ca (dCa) and Mg (dMg) concentrations, then diffuses through the membrane and further decreases plasma iCa and iMg concentrations, a mechanism that tends to reduce the divalent ion mass balance. In this context, reduced iCa concentrations have no anticoagulant effect [4], while it may negatively impact long-term Ca and Mg mass balance [5]. Specific effects of CIT-HD on Ca mass balance have been well described in landmark studies, both in acute studies showing a reduction in iCa concentrations and in long-term studies where it is associated with an increase in intact parathyroid hormone (iPTH) [6, 7]. The chelation effect of CIT-HD on divalent ions has prompted the manufacturer to compensate for this negative mass balance effect by increasing dCa up to 0.15–0.25 mmol/L, not considering adjustment for dMg. CIT-HD has been used in the USA [8] for more than a decade and worldwide without particular concerns. Minor side effects (e.g. cramps) of CIT-HD observed initially were not completely abolished despite an increase in dCa [9]. Furthermore, in the same study, it was shown that low total protein and albumin (Alb) concentrations might play an essential role in these side effects.
To the best of our knowledge, all CIT-HD-related studies have been acute or short-term studies focusing on biological and clinical consequences; none of them have explored long-term patient outcomes.
CIT-HD was introduced in 2013 in France, with rapid acceptance and no major concerns until a safety concern was recently raised by a retrospective national database study from the Renal Epidemiology and Information Network registry (Mercadal et al., oral presentation, annual meeting of Société Francophone de Néphrologie, Dialyse et Transplantation, October 2018, Lille, France and abstract, MON-110, World Congress of Nephrology, Melbourne, NSW, Australia, 2019). The French National Agency for Medicines and Health Products Safety (ANSM) initiated several database studies from dialysis care providers to assess the safety of CIT-HD. In conjunction with this request, the ANSM asked us to perform this retrospective observational multicentre study exploiting a large database of dialysis patients treated in western France. The objective of the study was to explore the long-term effect of CIT-HD on HD patient outcomes.
MATERIALS AND METHODS
Study design and objectives
This retrospective observational study had two parts. The first part of the study was exploratory and consisted of selecting patients with CIT-HD exposure—calculated as the ratio of the prescription duration to the total observational period: >80% (CIT-HD >80) or ≤80% (CIT-HD ≤80). Patient outcome was analysed over a 10-year period before and after propensity score matching (PSM) on main patient characteristics to minimize selection biases. The second part of the study was explanatory, centering on the role of CIT. It consisted of selecting patients who received exclusively CIT acidifier over the observation period (CIT-HD100) versus those who never received CIT (CIT-HD0). Patient outcome was analysed over the same 10-year period before and after PSM on the main patient and treatment characteristics.
Data source
This was a retrospective study performed on a dataset of incident HD patients treated in western France. Data of interest were extracted from patient electronic medical records, de-identified and anonymized to create a workable subset of data. A total of 1132 incident end-stage kidney disease (ESKD) patients on HD from dialysis facilities in five sanitary territories were included in the final dataset. Data capturing, storage and analysis rely on a common electronic medical record integrated into Dialog7 software, allowing the optimized collection of data. These dialysis facilities offer all renal replacement therapy options, from in-centre HD (HDC), medicalized dialysis units (UDMs) and self-care dialysis units (UADs) to home therapy (peritoneal dialysis and HD), including access to renal transplantation. Each sanitary territory is managed by a chief medical nephrologist supported by his staff and caregivers and provides full service to dialysis patients through a public and non-profit association healthcare system.
Study population
The patient inclusion period started on 1 January 2008 for four sanitary territories and on 1 January 2010 for the last one (Saint-Lô). The follow-up period was extended to 15 October 2018 for four sanitary territories and to 15 May 2018 for one (Saint-Malo) due to a software change. All ESKD patients starting dialysis in this time frame and having provided written informed consent on secondary use of their clinical data for research purposes and eligible for study inclusion were included after 90 days of regular dialysis treatment and stabilization.
Main patient characteristics and laboratory data were collected at dialysis initiation, including age, gender, causal nephropathy, dry weight, body mass index (BMI), Charlson comorbidity index (CCI), diabetes mellitus (DM) status, cardiovascular disease (CVD), vascular access (VA) type and laboratory data including serum Alb, C-reactive protein (CRP), creatinine index, haemoglobin (Hb), ferritin and iPTH.
The mean weekly dialysis time (WDT) was calculated. Exposure to treatment modality was expressed as the percentage of time spent on each modality for each patient, including the treatment option (HD, online HDF <50% and ≥50% exposure) and dialysis facility (HDC/UDM, UAD/home HD, considering ≥50% time exposure). Prescribed dialysate HCO3 (dHCO3), dCa and, in the case of CIT-HD, the ‘effective’ diffusive dialysate Ca (eff-dCa)—estimated from the manufacturer’s Ca nominal concentration by subtracting 0.15 mmol/L, accounting for 10% of iCa chelation estimate [10]—were averaged on the observation period and used as time-averaged values (TAVs). Angiotensin-converting enzyme inhibitor/angiotensin II receptor blocker (ACEi/ARB) prescription, expressed as the percentage of time spent on these medications, was also used as a potential marker of cardiovascular severity.
TAVs for lab tests included Alb, C Reactive Protein (CRP), erythropoietin resistance index (ERI), creatinine index, Hb, ferritin, Ca, corrected Ca for Alb, phosphorus (P), iPTH, pre- and post-dialysis HCO3- and eqKt/V.
Renal replacement modalities and operating procedures
All patients were treated with high-flux synthetic membranes and under conditions of ultrapure dialysis fluid, whatever the modality (e.g. HD or online HDF) and type of dialysis unit (e.g. HDC, UDM and UAD). HCl acidifier was predominant (e.g. 75%) in all these dialysis units before 2014. After 2014, HCl acidifier was steadily substituted by CIT (from 17% in May 2014 to 57% in May 2018) according to dialysis provider policy. The dialysate CIT concentration was 1.0 and 0.8 mmol/L for 96 and 4% of CIT exposure, respectively. The renal replacement treatment schedule (e.g. number of dialysis sessions and treatment duration) was prescribed and adjusted to residual kidney function and patient needs. The choice of dialysis modality and facility type relied on a medical decision, accounting for comorbid conditions, medical risk and patient’s choice.
Calculations and statistics
Data are presented as mean ± standard deviation (SD), median with interquartile range (IQR; 25th–75th percentile) or frequency as appropriate. Comparisons between groups were performed with the chi-squared test for categorical data or the Mann–Whitney U test for non-parametric data.
The first ‘exploratory’ part of the study analysed the outcomes of patients partially exposed to citrate acidifier (≤80% or >80% treatment time, whole population). The second ‘explanatory’ part of the study was focused on the outcome of patients who received citrate acidifier exclusively (CIT-HD100) versus those who had never been exposed to citrate acidifier (CIT-HD0).
Due to the retrospective observational nature of the study and to minimize differences between groups, PSM analyses were performed (matched population) in both cases in a 2:1 ratio including the following patient characteristics: age, gender, BMI, CCI, DM (yes/no), CVD (yes/no) and initial VA (tunnelled catheter versus arteriovenous fistula or graft). Validation of the paired match was ascertained by comparing variables using McNemar or Wilcoxon tests as appropriate.
Survival analysis was performed according to the Kaplan–Meier method and compared with the log-rank test. Multivariate Cox regression analysis analysed the hazard ratio (HR) of receiving citrate or non-citrate acidifier, including variables statistically significant in univariate analysis and with clinical pertinence. Statistical analyses were performed with SAS software version 9.1 (SAS Institute, Cary, NC, USA). All analyses were considered significant for P < 0.05.
RESULTS
Exploratory analysis
The initial cohort of incident HD patients consisted of 1132 subjects. In the first part of the study, based on limited time exposure to citrate acidifier, 898 patients were in the CIT-HD ≤80 group and 234 in the CIT-HD >80 group (whole population). After PSM with a 2:1 ratio, 432 were assigned to the CIT-HD ≤80 group and 216 to the CIT-HD >80 group and then compared (matched population) (Figure 1). The median follow-up period was 29 (IQR 16.7–52) and 22 (IQR 9–34.5) months, respectively. Data are presented in Table 1. Kaplan–Meier survival analysis revealed no difference, as shown by virtually superimposable curves (Figure 2) with a log-rank P = 0.97. The unadjusted Cox regression model showed no difference in all-cause mortality between CIT-HD ≤80 and CIT-HD >80 {HR 1.01 [95% confidence interval (CI) 0.72–1.40]}. Adjusted multivariate analysis including age, BMI, CCI, CVD (yes/no) as initial demographic variables, VA initiation, Alb initiation and CRP initiation, facility type, dialysis modality exposure (HD, online HDF <50 and ≥50%) and WDT variables did not change the results [HR 1.11 (95% CI 0.76–1.61)] (Table 2).
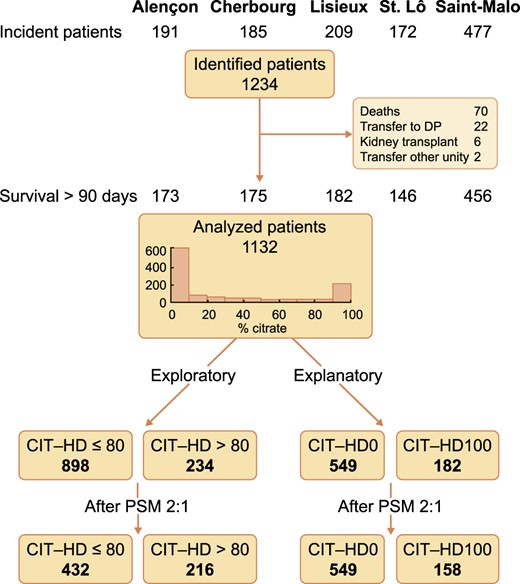
Study design flow diagram.
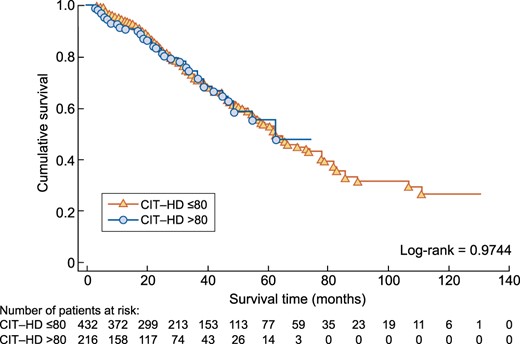
Kaplan–Meier analysis comparing all-cause mortality between the CIT-HD ≤80 and CIT-HD >80 study groups after PSM.
Baseline characteristics and HD parameters of the CIT-HD ≤80 and CIT-HD >80 patients before and after PSM
| Whole cohort | Matched cohort | |||||
|---|---|---|---|---|---|---|
| Characteristics | CIT-HD ≤80 | CIT-HD >80 | P-value | CIT-HD ≤80 | CIT-HD >80 | P-value |
| n | 898 | 234 | 432 | 216 | ||
| Demographics | ||||||
| Age (years) | 69.52 ± 14.38 | 69.12 ± 13.83 | 0.4709 | 68.77 ± 13.97 | 69.03 ± 13.51 | 0.7825 |
| Gender (female), % | 38.08 | 40.60 | 0.4818 | 37.73 | 38.89 | 0.7132 |
| Weight (kg) | 75.60 ± 18.14 | 77.71 ± 20.27 | 0.3424 | 79.66 ± 18.04 | 78.57 ± 20.38 | 0.3573 |
| BMI (kg/m²) | 27.43 ± 6.22 | 28.56 ± 7.02 | 0.0669 | 28.80 ± 6.18 | 28.56 ± 7.02 | 0.4917 |
| CCI | 7.32 ± 2.29 | 6.66 ± 2.12 | <0.0001 | 6.77 ± 2.12 | 6.74 ± 2.14 | 0.4411 |
| Renal disease, % | 0.1588 | 0.3126 | ||||
| Cystic disease | 6.68 | 9.40 | 6.71 | 9.72 | ||
| Diabetes | 20.38 | 22.65 | 24.07 | 22.69 | ||
| Glomerulonephritis | 11.92 | 9.40 | 12.04 | 9.72 | ||
| Interstitial | 9.91 | 12.39 | 8.56 | 11.11 | ||
| Vascular and hypertension | 31.63 | 32.48 | 29.40 | 32.87 | ||
| Unknown and other | 19.49 | 13.68 | 19.21 | 13.89 | ||
| DM, % | 33.30 | 41.03 | 0.0271 | 42.82 | 42.59 | 0.9376 |
| CVD, % | 32.63 | 25.21 | 0.0291 | 25.00 | 25.93 | 0.7389 |
| HD parameters, % | ||||||
| VA catheter initiation | 32.81 | 29.49 | 0.3320 | 28.24 | 31.48 | 0.2829 |
| Facility type, % | 0.1966 | 0.0704 | ||||
| HDC/UDM | 84.53 | 87.97 | 81.94 | 87.50 | ||
| UAD/home HD | 15.47 | 12.13 | 18.06 | 12.50 | ||
| Online HDF | 62.4 | 69.9 | 0.0335 | 61.8 | 73.1 | 0.0042 |
| HD parameters (TAV) | ||||||
| WDT (min) | 605 ± 114 | 563 ± 112 | <0.0001 | 609 ± 112 | 567 ± 113 | <0.0001 |
| Anti-Xa (IU/session) | 3467 ± 1375 | 3786 ± 1398 | 0.0005 | 3578 ± 1344 | 3831 ± 1425 | 0.0269 |
| Other treatments | ||||||
| ACEi/ARB, % | 38.14 ± 42.06 | 47.59 ± 42.35 | 0.0046 | 39.86 ± 42.23 | 49.15 ± 42.33 | 0.0028 |
| Laboratory initiation | ||||||
| Alb (g/L) | 33.73 ± 5.83 | 33.04 ± 6.01 | 0.2118 | 33.83 ± 5.60 | 33.09 ± 6.02 | 0.0291 |
| CRP (mg/L), median (IQR) | 7.2(2.2–23.0) | 8.0(2.0–28.5) | 0.9649 | 7.7(2.9–21.0) | 8.0(2.0–29.0) | 0.0150 |
| Hb (g/dL) | 10.18 ± 1.52 | 10.05 ± 1.50 | 0.1720 | 10.21 ± 1.50 | 10.06 ± 1.50 | 0.0131 |
| Creatinine index (mg/kg/day) | 16.83 ± 3.25 | 16.87 ± 2.44 | 0.9915 | 17.10 ± 3.15 | 16.86 ± 2.49 | 0.0757 |
| iPTH (ng/L) | 324.5 ± 254.9 | 322.7 ± 221.8 | 0.4602 | 340.1 ± 265.9 | 313.4 ± 207.3 | 0.6574 |
| Ferritin (µg/L) | 277.2 ± 262.5 | 250.8 ± 251.7 | 0.4167 | 263.6 ± 249.9 | 254.3 ± 259.6 | 0.2877 |
Data are presented as mean ± SD unless stated otherwise. The interquartile range (IQR) is the 25th–75th percentile.
Note: Statistical significant of P-values are in bold.
Comparison between CIT-HD ≤80 and CIT-HD >80
| Univariate | Multivariate | |||
|---|---|---|---|---|
| Characteristics | HR (95% CI) | P-value | HR (95% CI) | P-value |
| Age (years) | 1.06 (1.04–1.07) | <0.0001 | 1.03 (1.01–1.05) | 0.0008 |
| BMI (kg/m²) | 0.97 (0.95–0.99) | 0.0033 | 0.98 (0.95–1.00) | 0.0582 |
| CCI | 1.21 (1.14–1.28) | <0.0001 | 1.07 (0.96–1.19) | 0.2001 |
| CVD (ref. no) yes | 1.86 (1.40–2.46) | <0.0001 | 1.69 (1.22–2.34) | 0.0018 |
| VA initiation (ref. catheter) no catheter | 0.67 (0.50–0.91) | 0.0107 | 0.66 (0.47–0.92) | 0.0143 |
| Dialysis modality (ref. HD) | 0.0060 | <0.0001 | ||
| Online HDF <50% | 0.60 (0.37–0.97) | 0.96 (0.55–1.68) | ||
| Online HDF ≥50% | 0.52 (0.35–0.78) | 0.34 (0.21–0.57) | ||
| Facility type (ref. HDC/UDM) UAD/home HD | 0.16 (0.08–0.32) | <0.0001 | 0.16 (0.08–0.34) | <0.0001 |
| WDT (min) (TAV) | 0.97 (0.96–0.98) | <0.0001 | 0.98 (0.97–1.00) | 0.0138 |
| Alb initiation (ref. ≤35) >35 (g/L) | 0.71 (0.25–0.96) | 0.0250 | 0.81 (0.58–1.14) | 0.2208 |
| CRP initiation (ref. <10) ≥10 (mg/L) | 1.62 (1.22–2.16) | 0.0009 | 1.15 (0.82–1.61) | 0.4198 |
| (ref. CIT-HD ≤80) CIT-HD >80 | 1.01 (0.72–1.40) | 0.9744 | 1.11 (0.76–1.61) | 0.6003 |
| All-cause mortality |
Univariate and multivariate Cox regression analysis for all-cause mortality.
Note: Statistical significant of P-values are in bold.
Explanatory analysis
In the second part of the study, 731 patients who met the selection criteria were identified: 549 patients were never exposed to citrate (CIT-HD0), while 182 patients received citrate throughout the observational period (CIT-HD100). After PSM with a 2:1 ratio, 316 patients were assigned to the CIT-HD0 group and 158 patients to the CIT-HD100 group. The median follow-up period was 22 (IQR 13–37) and 20 (IQR 9–33) months, respectively. Data are presented in Table 3. Kaplan–Meier survival analysis did not reveal a significant difference between CIT-HD0 and CIT-HD100 (Figure 3), with a log-rank P = 0.06. The unadjusted Cox model showed no significant difference in all-cause mortality between CIT-HD0 and CIT-HD100 [HR 0.69 (95% CI 0.47–1.03)]. Adjusted multivariate analysis including age, BMI, CCI, CVD (yes/no) as initial demographic variables, facility type, dialysis modality exposure (HD, online HDF <50 and ≥50%) and WDT variables did not modify the results [HR 0.87 (95% CI 0.57–1.33)] (Table 4).
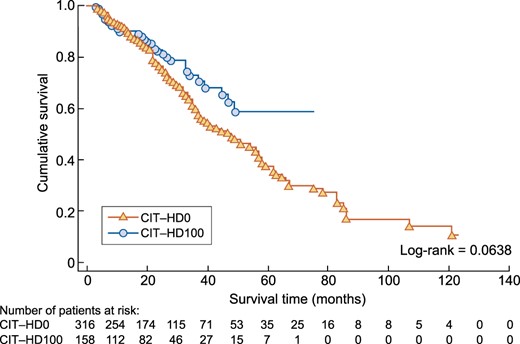
Kaplan–Meier analysis comparing all-cause mortality between the CIT-HD0 and CIT-HD100 study groups after PSM.
Baseline characteristics and HD parameters of the CIT-HD0 and CIT-HD100 patients before and after PSM
| Whole cohort | Matched cohort | |||||
|---|---|---|---|---|---|---|
| CIT-HD0 | CIT-HD100 | P-value | CIT-HD0 | CIT-HD100 | P-value | |
| Characteristics | (n = 549) | (n = 182) | (n = 316) | (n = 158) | ||
| Demographic variables | ||||||
| Age (years) | 70.16 ± 14.67 | 69.23 ± 13.55 | 0.1974 | 68.84 ± 14.79 | 69.14 ± 13.24 | 0.9254 |
| Gender (female), % | 39.34 | 43.41 | 0.3330 | 40.19 | 40.51 | 0.9338 |
| Weight (kg) | 74.29 ± 17.96 | 77.41 ± 20.58 | 0.1609 | 78.36 ± 17.93 | 77.20 ± 19.61 | 0.3515 |
| BMI (kg/m²) | 26.96 ± 6.20 | 28.92 ± 7.49 | 0.0050 | 28.24 ± 6.15 | 28.28 ± 6.65 | 0.8012 |
| CCI | 7.43 ± 2.35 | 6.53 ± 2.14 | <0.0001 | 6.75 ± 2.21 | 6.67 ± 2.20 | 0.6954 |
| Renal disease, % | 0.5066 | 0.4614 | ||||
| Cystic disease | 8.38 | 7.69 | 9.49 | 7.59 | ||
| Diabetes | 18.94 | 23.63 | 21.52 | 23.42 | ||
| Glomerulonephritis | 9.65 | 10.44 | 11.71 | 11.39 | ||
| Interstitial | 10.20 | 10.99 | 8.86 | 9.49 | ||
| Vascular and hypertension | 31.33 | 31.87 | 28.48 | 31.65 | ||
| Unknown and other | 21.49 | 15.38 | 19.94 | 16.46 | ||
| DM, % | 32.60 | 41.76 | 0.0247 | 140.51 | 43.04 | 0.5108 |
| CVD, % | 32.24 | 24.73 | 0.0560 | 24.37 | 25.32 | 0.7797 |
| HD parameters, % | ||||||
| VA catheter initiation | 36.93 | 29.67 | 0.0756 | 29.43 | 32.91 | 0.3213 |
| Facility type, % | 0.0225 | 0.0002 | ||||
| HDC/UDM | 87.25 | 93.41 | 84.49 | 93.67 | ||
| UAD/home HD | 12.75 | 6.59 | 15.51 | 6.33 | ||
| Online HDF | 57.7 | 73.4 | 0.0001 | 60.4 | 79.7 | 0.0001 |
| HD parameters (TAV) | ||||||
| WDT (min) | 605 ± 114 | 563 ± 112 | <0.0001 | 601 ± 113 | 559 ± 109 | 0.0001 |
| dCa (mmol/L) | 1.50 ± 0.05 | 1.62 ± 0.10 | <0.0001 | 1.51 ± 0.05 | 1.63 ± 0.10 | <0.0001 |
| Eff-dCa (mmol/L) | 1.50 ± 0.05 | 1.47 ± 0.09 | <0.0001 | 1.51 ± 0.05 | 1.47 ± 0.10 | <0.0001 |
| dHCO3 (mmol/L) | 34.8 ± 1.6 | 33.5 ± 1.5 | <0.0001 | 34.8 ± 1.3 | 33.6 ± 1.5 | <0.0001 |
| Anti-Xa (IU/session) | 3447 ± 1335 | 3855 ± 1410 | 0.0004 | 3500 ± 1342 | 3887 ± 1430 | 0.0039 |
| Other treatments | ||||||
| ACEi/ARB, % | 36.37 ± 42.47 | 50.01 ± 42.53 | 0.0004 | 40.35 ± 42.91 | 52.48 ± 42.45 | 0.0006 |
| Laboratory initiation | ||||||
| Alb (g/L) | 33.44 ± 5.89 | 32.55 ± 5.88 | 0.0962 | 34.14 ± 5.85 | 32.61 ± 5.89 | 0.0037 |
| CRP (mg/L), median (IQR) | 9.0(2.5–23.3) | 7.0(2.0–26.2) | 0.3814 | 7.0(2.0–20.5) | 7.0(2.0–27.0) | 0.3748 |
| Hb (g/dL) | 10.16 ± 1.50 | 10.01 ± 1.49 | 0.1312 | 10.18 ± 1.54 | 10.03 ± 1.49 | 0.0655 |
| Creatinine index (mg/kg/day) | 16.79 ± 3.32 | 16.85 ± 2.39 | 0.9968 | 17.05 ± 3.06 | 16.86 ± 2.49 | 0.2710 |
| iPTH (ng/L) | 328.1 ± 258.6 | 319.2 ± 219.3 | 0.6857 | 341.8 ± 272.0 | 309.0 ± 200.6 | 0.7654 |
| Ferritin (µg/L) | 278.0 ± 258.8 | 254.2 ± 239.9 | 0.7457 | 260.8 ± 246.7 | 260.4 ± 252.4 | 0.7521 |
Data are presented as mean ± SD unless stated otherwise. The interquartile range (IQR) is the 25th–75th percentile.
Note: Statistical significant of P-values are in bold.
Comparison between CIT-HD0 and CIT-HD100
| Univariate | Multivariate | |||
|---|---|---|---|---|
| Characteristics | HR (95% CI) | P-value | HR (95% CI) | P-value |
| Age (years) | 1.04 (1.03–1.06) | <0.0001 | 1.03 (1.03–1.05) | <0.0001 |
| BMI (kg/m²) | 0.97 (0.95–1.00) | 0.0312 | 0.97 (0.94–0.99) | 0.0261 |
| CCI | 1.17 (1.10–1.26) | <0.0001 | 1.05 (0.94–1.17) | 0.4071 |
| CVD (ref. no) yes | 1.52 (1.09–2.10) | 0.0125 | 1.31 (0.92–1.86) | 0.1320 |
| Dialysis modality (ref. HD) | <0.0001 | <0.0001 | ||
| Online HDF <50% | 0.71 (0.45–1.11) | 0.66 (0.40–1.09) | ||
| Online HDF ≥50% | 0.42 (0.28–0.63) | 0.29 (0.13–0.49) | ||
| Facility type (ref. HDC/UDM) UAD/HDD | 0.29 (0.14–0.60) | 0.0010 | 0.29 (0.14–0.56) | <0.0001 |
| WDT (TAV) | 0.98 (0.97–0.99) | 0.0066 | 1.00 (1.00–1.00) | 0.1538 |
| (Ref. CIT-HD0) CIT-HD100 | 0.69 (0.47–1.03) | 0.0698 | 0.87 (0.57–1.33) | 0.5176 |
| All-cause mortality |
Univariate and multivariate Cox regression analysis for all-cause mortality
Note: Statistical significant of P-values are in bold.
After PSM, some differences persisted and concerned mainly HD prescription parameters: first, a higher HDC:UDM ratio in the CIT-HD100 group explained by earlier provision of citrate in HDC due to a clinical pre-assessment before CIT was deployed or generalized in other facilities; second, a higher percentage of patients receiving online HDF ≥50% in the CIT-HD100 group due to concomitant prevalent increase of both CIT-HD and online HDF; third, a shorter WDT in the CIT-HD group related to the shorter median follow-up with a probable better residual renal function allowing a lower dose of dialysis; fourth, a higher proportion of patients receiving ACEis/ARBs in the CIT-HD100 group, suggesting on one hand a poor initial cardiovascular condition and on the other a potential protective effect over the long term. A few other variables were slightly different, including dCa and eff-dCa, as well as low molecular weight heparin dosing. The last finding confirms that CIT acidifier choice was not indicated for its anticoagulant activity in this cohort.
Lab test values are presented in Table 5 as TAVs over the observation period. Serum Alb concentration was significantly lower in the CIT-HD100 group but within the same range as it was at baseline, indicating no time change. Hb concentration was lower in the CIT-HD100 group but still in the target range >11 g/dL. ERI was significantly lower in the CIT-HD100 group. Regarding bone mineral markers, total Ca was lower in the CIT-HD100 group. Interestingly, this difference disappeared when Ca was corrected for Alb concentrations. We acknowledge that iCa dosages would have been more pertinent for interpreting intermediary outcomes, but unfortunately iCa was not routinely performed in our current practice. Otherwise the most important finding is the fact that iPTH, a sensitive indicator of Ca imbalance, did not differ between the two groups. As shown, iPTH concentrations ranged between 130 and 585 ng/L and were not different between groups. Furthermore, iPTH, which was similar in the two groups, initially remained stable over time until the end of the observation period. As shown, the last iPTH concentrations remained similar in both groups (CIT-HD0 305.5 ± 244 versus CIT-HD100 307.1 ± 195 ng/L), suggesting that parathyroid glands were not stimulated. Pre-dialysis HCO3 concentration was lower in the CIT-HD100 group while remaining in the target range, but this value should be interpreted in light of a lower dialysate plasma HCO3 gradient due to reduced dHCO3 prescription. In addition, the lower post-dialysis HCO3 concentration observed in the CIT-HD100 group is in agreement with previous studies [9, 10].
Time-averaged laboratory variables of the matched CIT-HD0 and CIT-HD100 patients after PSM
| Matched cohort | ||||
|---|---|---|---|---|
| Characteristics | Measurements (n/year) | CIT-HD0 | CIT-HD100 | P-value |
| n | 316 | 158 | ||
| Laboratory (TAV) | ||||
| Alb (g/L) | 10.2 | 36.30 ± 4.77 | 34.38 ± 3.92 | <0.0001 |
| CRP (mg/L), median (IQR) | 12.5 | 10.0 (3.0–17.0) | 8.0 (1.0–15.0) | 0.7940 |
| Hb (g/dL) | 18.5 | 11.46 ± 0.66 | 11.17 ± 0.59 | <0.0001 |
| ERI (UI/kg/week/gHb) | 16 | 10.49 ± 9.88 | 8.35 ± 6.55 | 0.0139 |
| Creatinine index (mg/kg/day) | 9.8 | 17.97 ± 2.28 | 17.64 ± 1.91 | 0.1240 |
| nPCR (g/kg/24 h) | 10.2 | 1.14 ± 0.24 | 1.17 ± 0.24 | 0.2578 |
| Ferritin (µg/L) | 8.8 | 343.4 ± 181.9 | 318.2 ± 139.3 | 0.1271 |
| Ca (mmol/L) | 14.7 | 2.20 ± 0.12 | 2.17 ± 0.11 | 0.0084 |
| Corrected Ca (mmol/L) | 9.8 | 2.30 ± 0.14 | 2.30 ± 0.23 | 0.6463 |
| P (mmol/L) | 13.5 | 1.54 ± 0.36 | 1.53 ± 0.29 | 0.5548 |
| iPTH (ng/L) | 3.9 | 299.2 ± 184.9 | 331.4 ± 231.6 | 0.0921 |
| eqKt/V | 10.1 | 1.75 ± 0.36 | 1.74 ± 0.35 | 0.7650 |
| HCO3 pre (mmol/L) | 14.8 | 22.31 ± 1.74 | 21.95 ± 1.61 | 0.0331 |
| HCO3 post (mmol/L) | 10.3 | 26.73 ± 1.79 | 26.02 ± 1.44 | <0.0001 |
Data are presented as mean ± SD unless stated otherwise. The interquartile range (IQR) is the 25th–75th percentile.
Note: Statistical significant of P-values are in bold.
DISCUSSION
CIT-HD is an interesting option for dialysis that was developed with the intent of improving haemodynamic tolerance of dialysis sessions, particularly in high-risk patients. As shown from a market survey, CIT-HD is gaining more clinical acceptance worldwide. Most previous studies on CIT-HD have focused on short- or mid-term effects and never considered long-term outcomes, highlighting the importance of our retrospective long-term observational study.
Direct clinical comparisons of HD with various acidifiers are difficult to interpret considering the variety of dialysate compositions that include citrate concentrations ranging between 0.66 and 1 mmol/L, CH3COOH-HD acetate concentrations ranging between 2.5 and 11 mmol/L and dCa or dMg adjusted or not to CIT-HD. Interestingly, in a recent prospective randomized study, lower intradialytic blood pressure (BP) and other minor adverse events (e.g. cramps and fatigue) were reported through the first 2 weeks of CIT-HD exposure then vanished afterwards, suggesting an adaptation to the new dialysis condition [9,]. Despite the lower BP observed in patients exposed to CIT-HD, the overall haemodynamic effects of CIT-HD were considered beneficial (e.g. lower peripheral vascular resistance and stable stroke index), particularly for patients presenting with intradialytic hypertension in another interventional study [11,]. An increase in symptomatic intradialytic hypotensive episodes and cramps was observed, particularly when CIT-HD is associated with low dCa (1.25 mmol/L) and probably low dMg [12,]. Overall, CIT-HD is considered as safe as CH3COOH-HD and some studies have reported better tolerance (e.g. less malaise) [13,] and an improved subjective patient perception [11].
Thrombogenicity of the extracorporeal circuit and heparin consumption tend to be reduced with CIT-HD use. The antithrombotic effect of citrate results from a possible partial local Ca-chelating effect within the extracorporeal circuit even though iCa never reaches anticoagulant levels (e.g. iCa <0.40 mmol/L) [4,]. Although controversial [14, 15], this property may explain why CIT-HD is frequently indicated in high bleeding risk patients to decrease heparin needs [16, 17]. CIT-HD contributes to improve overall dialysis efficiency [8, 10, 11, 17] by preserving membrane permeability and facilitates dialyser reuse [12]. The effect of CIT-HD on acid–base status was a concern in frail patients. However, due to the relatively slow metabolization of CIT, plasma HCO3 increases steadily during the dialysis session but the risk of post-dialysis alkalosis appears quite limited [9]. This property has interest in patients suffering from chronic respiratory disease [18]. Recent studies with CIT-HD have confirmed that pre-dialysis HCO3 was not modified or only slightly increased over time but remained in the optimal target range [9–11].
Aside from these clinical benefits, it must be underlined that CIT-HD has a negative significant impact on dialysis Ca mass balance [5, 6]. From recent studies, one can estimate that 10–20% of available diffusive Ca is reduced when CIT-HD is used [5]. As a rule of thumb, an equivalent Ca mass balance should be maintained with CIT-HD as compared with CH3COOH-HD or HCl-HD and baseline dCa should be increased by 0.15–0.25 mmol/L. Mg is similarly affected by citrate complexing phenomenon, meaning that Mg mass balance is potentially reduced [5]. In the long run, recurrent negative Ca and Mg dialysis mass balance are likely to induce iPTH hormone release and to exacerbate secondary hyperparathyroidism [5, 6].
Our current study on CIT-HD provides original and interesting findings that are discussed and kept in their current clinical context. The use of CIT-HD has increased over the last decade but remains limited, ranging from 13% to 20% of dialysis patients in Europe, indicating a strong bias of indication and reflecting mostly local practices or policies in patients at risk. In western France, CIT was introduced in 2013 and its use increased from 17% in 2014 to 57% in 2018, mainly as a substitute for HCl, which had replaced CH3COOH (CH3COOH: 26.5% in 2012, 9.6% in 2014 and 0% in 2018), except for the Saint-Malo sector, where some dialysis machines were damaged by HCL-HD (leakage on hydraulic circuit) and continued to use CH3COOH acidifier until CIT-HD was available. CH3COOH is potentially deleterious, notably from a haemodynamic aspect [1], even with low concentrations (e.g. 3–4 mmol/L), particularly in elderly, cardiac or fragile patients, and amplified with high-volume online HDF [19]. These pathophysiologic considerations may explain why CIT-HD was indicated mainly for in-centre patients receiving online HDF and having a higher comorbid profile.
Interestingly, the introduction of CIT-HD in our region has been associated with an early increase in dCa prescription to prevent hypocalcaemia and parathyroid gland stimulation. This practice change may be illustrated by comparing the average dCa before and after 498 switches—concerning 378 patients—from non-CIT-HD to CIT-HD. The average dCa went from 1.50 ± 0.05 to 1.63 ± 0.08 mmol/L. Furthermore, these values are certainly downplayed to the extent that nearly 25% of the cases had no immediate adjustment of their dCa prescription. This reactivity of clinicians has certainly been beneficial for patients in the long run and may explain the lack of changes in bone mineral metabolism markers (e.g. Cor-Ca and iPTH) between CIT-HD0 and CIT-HD100. Other findings of our study are of clinical relevance. Dialysis efficiency (e.g. eqKt/V = 1.75) and acid–base status remained similar between the two groups. However, it is notable that pre- and post-dialysis plasma HCO3 concentrations remained significantly lower in the CIT-HD100 group. This finding is likely due to a lower dHCO3 prescription, but also reflects a new acid–base equilibrium resulting from a reduction of HCO3 load while the production of protein remained constant, as suggested by the stability of the normalized protein catabolic rate over time. Finally, an interesting finding relates ERI to citrate use. As shown, CIT-HD100 is associated with a significantly lower ERI. This is likely associated with the anti-inflammatory effect of citrate [7, 10, 20, 21]. Taken together, these intermediary clinical and biological outcomes, as well as dialysis performance data, confirm the efficacy and safety of CIT-HD while not disclosing any significant differences with other acidifiers provided electrolyte concentration adjustment is performed.
Furthermore, this is the first study reporting on long-term outcomes of CIT acidifier use in dialysis. As shown in the most pertinent PSM analyses, patient outcomes and clinical endpoints did not reveal any significant differences between patients receiving CIT and those receiving other acidifiers. In the first analysis, the survival rate of patients from the CIT-HD >80 group was superimposable to those propensity score matched from the CIT-HD ≤80 group. Due to the lag time of citrate marketing, patients from the CIT-HD ≤80 group are likely to have a time bias that tends to attribute a significant survival benefit to incident patients dialysed with CH3COOH-HD or HCl-HD and then transferred to CIT-HD. To avoid this bias, the second PSM explanatory study was necessary. Interestingly, in this analysis the survival rate tends to be better in the CIT-HD100 group as compared with the CIT-HD0 group, but the difference did not reach statistical significance. Several hypotheses could be formulated to support this finding. Ca adaptation in CIT concentrate may have prevented hypocalcaemia and related cardiac events [22]. Regarding the specific role of Mg, our study could not address this concern since plasma Mg levels were not measured on a routine basis. However, it is well documented that low serum Mg concentrations may facilitate severe cardiovascular events in dialysis patients and might have additional side effects, such as triggering inflammation, decreasing immunity, inducing insulin resistance [23–25] and promoting vascular calcifications [26]. Corroborating these facts, it has been shown that high dMg levels are associated with lower cardiovascular mortality risk [27, 28,] and Mg supplementation tends to reduce carotid intima–media thickness of dialysis patients [29]. Because dMg was not adjusted for CIT content by manufacturers, our study is reassuring since it reveals a negative impact of CIT on standard dMg. This finding could raise further concerns about optimal dMg with CIT-HD. The beneficial role of CIT on vascular calcification propensity has been recently highlighted in a prospective randomized study showing a favourable impact of CIT on in vitro half-life bioassays [30].
The current study has some limitations. We acknowledge that given the retrospective nature of our study, several confounding and remaining factors could not be accounted for. An important bias of selection was already avoided before performing PSM to the extent that the CIT-HD prescription relied on local and institutional policy more than on an individual basis, even for its antithrombotic effect in the case of haemorrhagic-risk patients. To explore further the effects of CIT on dialysis patient outcomes, we designed the PSM analyses in two steps, taking advantage of having access to a large dataset (1132 patients). In addition, to analyse more precisely the role of CIT versus other acidifiers (CH3COOH or HCl) on patient outcomes, we used the effective time exposure to citrate. In the first part of the analysis, the relative risk of partial time exposure (≤80% of treatment time) to CIT was analysed in 1132 patients with PSM on more pertinent parameters in a 2:1 ratio to minimize bias. The weakness of this exploratory study is the time bias introduced that favours the CIT-HD ≤80 group. It thus makes essential the second part of the study where the relative risk of full or no exposure to CIT was analysed in 731 patients. The PSM developed in that case to explore the most critical time exposure risk to citrate is also quite reassuring. As shown, matching provided adequate pairs of data, resulting in almost identical population subsets either on patient characteristics or on treatment modalities. Nevertheless, higher AECi/ARB exposure—even though it was not significant in univariate Cox regression analysis [≥50% versus <50% exposure group; HR 0.74 (95% CI 0.53–1.04)]—in the CIT-HD100 group could be interpreted as better cardiovascular protection and considered as a residual bias. The online HDF definition could also have increased the survival benefit of this technique in the interpretation of the Cox analysis. Therefore, and despite its limitations, our study is of high clinical relevance since it confirms the safety and efficacy of CIT-HD in long-term use. To the best of our knowledge, this is the first large cohort study reporting on outcomes of incident dialysis patients receiving CIT-HD over a 6-year period.
In conclusion, our findings support the notion that CIT-HD is not associated with additional risk. Such findings are of great interest for the nephrology and patient communities, as it confirms the long-term safety of CIT-HD. In addition, considering the high proportion of patients receiving online HDF in this cohort, one could assume that citrate is also safe in high-volume online HDF, provided dialysate Ca and Mg concentrations are adequately dosed in the dialysis fluid.
ACKNOWLEDGEMENTS
We thank the nephrologists who participated in the care of patients and the collection of medical data during the study: Julien Bouet, Jérôme Potier and Aure Rauline (Cherbourg), Marie-Laure Lombart, Simon Duquennoy and Gérard Cam (Saint-Malo), Loay Al Moussa and Solveig Aussant (Lisieux), Laurène Blacher (Alençon) and Thibault Besselièvre (Saint-Lô).
AUTHORS’ CONTRIBUTIONS
J.P., G.Q., I.L., E.C., E.Z., T.D.H., D.H. and E.R. were involved in the control of the data. J.P. aggregated, anonymized and analysed the data. J.P., B.C., N.M., L.G., J.P.C. and M.M. were involved in the design of the work and interpretation of the data. N.M. and L.G. ensured the statistics. J.P. and B.C. were involved in drafting the manuscript and all authors were involved in revising the manuscript and approved the final version.
CONFLICT OF INTEREST STATEMENT
B.C. is a part-time consulting employee for Fresenius Medical Care. E.Z. reports non-financial support from Meditor and Sanofy-Genzyme, personal fees and non-financial support from Amicus and personal fees from Shire outside the submitted work. The other authors declare no conflicts of interest.
(See related article by Pizzarelli and Basile. The Gordian knot of the long-term safety of dialysate citrate: is there really a concern about patient hard outcomes? Nephrol Dial Transplant 2020; 35: )


Comments