


Abstract
Activation of mitogen-activated protein kinase phosphatase-1 (MKP-1), a dual-specificity protein phosphatase, regulates mitogen-activated protein kinase signaling. C-Jun N-terminal kinase (JNK) and p38 are activated in cisplatin-induced renal injury. However, the change of MKP-1 expression in cisplatin-induced renal injury and the regulatory effect of sirtuin 2 (SIRT2), a nicotinamide adenine dinucleotide–dependent deacetylase, on MKP-1 remains unknown.
To address these issues, we used constitutional Sirt2 knockout (KO) mice, transgenic (TG) mice with increased expression of SIRT2 specifically in proximal tubular epithelial cellsand wild-type (WT) mice. Cisplatin nephrotoxicity was induced by intraperitoneal injection of cisplatin.
MKP-1 expression in the kidney was decreased after cisplatin treatment. Cisplatin-induced downregulation of MKP-1 was reversed in Sirt2 KO mice kidney and further decreased in Sirt2 TG mice kidney. We observed similar phenomenon with SIRT2-knockdown or SIRT2-overexpressed tubular epithelial cells. Phosphorylation of p38 and JNK, a downstream signal pathway of MKP-1, increased in WT mice kidney following treatment with cisplatin. A decrease in SIRT2 suppressed cisplatin-induced phosphorylation of p38 and JNK in kidney and tubular epithelial cells. Overexpression of SIRT2 further increased phosphorylation of p38 and JNK in kidney and tubular epithelial cells. Acetylation of MKP-1 was significantly increased in SIRT2-knockdown cells and decreased in SIRT2-overexpressed cells after cisplatin stimulation. Sirt2 KO mice and Sirt2 TG mice showed amelioration and aggravation of renal injury, apoptosis, necroptosis and inflammation induced by cisplatin.
Our data show that SIRT2 is associated with cisplatin-induced renal injury through regulation of MKP-1 expression.
INTRODUCTION
Mitogen-activated protein kinase phosphatase-1 (MKP-1) is a major part of the dual-specificity family of phosphatases and specifically inactivates mitogen-activated protein kinases (MAPKs) by dephosphorylating both phosphotyrosine and phosphoserine/phosphothreonine residues [1]. MKP-1 has several functions [2–4]. Increased expression of MKP-1 in cancer cell leads to multidrug resistance to chemotherapeutic agents [5]. MKP-1 plays a critical role in cardiovascular disease as a counterregulator of MAPK signaling pathways [6]. Recently MKP-1 was introduced as a new protein in anti-inflammation [7]. Loss of MKP-1 in monocytes has been linked to dysregulation of monocyte adhesion and migration [8]. We previously demonstrated that acetylation of MKP-1 regulates lipopolysaccharide-induced renal inflammation [9]. As dysregulation of protein tyrosine phosphorylation can be related to human diseases, MKP-1 represents a potential therapeutic target in cancer, diabetes, autoimmune disorders and neurological diseases. However, there are little data on the expression and role of MKP-1 in cisplatin-induced renal injury.
As one important limitation of cisplatin in cancer therapy is nephrotoxicity, amelioration of cisplatin-induced renal toxicity may improve therapeutic effects in cancer patients. As activation of MAPKs may be related with drug-induced apoptosis, cisplatin increases renal injury through up-regulation of p38 and c-Jun N-terminal kinase (JNK) [10, 11]. Because MAPKs are a downstream signal pathway of MKP-1, changes of MKP-1 expression may regulate cisplatin-induced phosphorylation of p38 and JNK. Thus regulation of MKP-1 in the kidney can be a new avenue to ameliorate cisplatin linked to renal injury.
Acetylation of MKP-1 inhibits toll-like receptor signaling [12], thus increased acetylation of MKP-1 downregulates MAPK signaling [12]. We previously demonstrated that SIRT2, a nicotinamide adenine dinucleotide (NAD)-dependent histone deacetylase, regulates acetylation of MKP-1 and MAPK signaling, resulting in downregulation of lipopolysaccharide-induced chemokine (C-X-C motif) ligand 2 (CXCL2) and chemokine (C-C motif) ligand 2 (CCL2) renal expression [9]. It has been suggested that sensitivity to cisplatin in SIRT2−/− DT40 cells is significantly higher than in SIRT2+/+ DT40 cells [13]. However, very little is known about the effect of cisplatin on MKP-1 expression in the normal kidney and the role of SIRT2 on MKP-1 in cisplatin-related nephrotoxicity. To address this, we characterized MKP-1 expression changes in the kidney after treatment with cisplatin and evaluated the role of SIRT2 in a constitutively deleted form of Sirt2−/− mice [Sirt2 knockout (KO) mice] and transgenic (TG) mice with increased expression of SIRT2 specifically in renal tubular epithelial cells after cisplatin administration.
MATERIALS AND METHODS
Mouse strains: production of transgenic mouse
All mouse studies were approved by the Institutional Animal Care and Use Committee of Chonbuk National University Hospital. A constitutively deleted form of Sirt2−/− mice (referred to as Sirt2 KO mice) was purchased from Jackson Laboratory (Bar Harbor, ME, USA) [9]. We generated a conditional knock-in mouse that expresses a constitutively activated form of Sirt2 by Ozgene (Bentley DC, WA, Australia; Supplementary data, Figure S1A). To generate renal tubule–specific SIRT2 transgenic mice on a C57BL/6J background, a transgenic expression vector containing a lox-stop-lox followed by mouse Sirt2 cDNA was constructed (Supplementary data, Figure S1A). Mice were generated as heterozygous TG by breeding them with wild-type (WT) C57BL/6J mice. TG mice expressing Cre recombinase under control of γ-glutamyltransferase 1 (γGT-Cre), which is expressed in cortical tubular epithelium of the kidney, were generated. A double fluorescent Cre recombinase reporter mouse (ROSAmT/mG) was used to evaluate the effect of γGT-Cre mouse on proximal tubular epithelial cells (Jackson Laboratory) (Supplementary data, Figure S1B). Heterozygous TG mice were then bred with γGT-Cre mice to permit the expression of SIRT2 specifically in renal tubular epithelial cells (γGT-Cre; Sirt2, referred to as Sirt2 TG mice) (Supplementary data, Figure S1C and 1D). The genotype of each mouse was confirmed by polymerase chain reaction (PCR) with DNA from mouse tails. As biologic response was not different between C57BL/6J and siblings of heterozygous TG mice without a γGT-Cre gene, we used C57BL/6J as WT mice. Male mice were used in the experiments.
Animal experiments
The dose of cisplatin and the time of treatment were selected based on our previous study [14]. Cisplatin (20 mg/kg) was administered intraperitoneally once. Maximal renal injury, as assessed by functional and histological measurements, was observed at 3 days after cisplatin injection. Animal deaths were monitored and body weight was measured periodically during the study. A Kaplan–Meier survival curve was used to show the survival patterns of different groups.
Tubular injury score
To grade tubular injury, three pathological features in the kidney after cisplatin administration were assessed in the renal cortex and outer medulla: tubular necrosis, tubular dilation and presence of tubular casts in this study [15]. Histological damage in periodic acid–Schiff-stained kidney sections was scored by measuring the magnitudes of tubular epithelial cell loss, necrosis, intratubular debris and tubular cast formation as follows: 0, none; 0.5, <10%; 1, 10–25%; 2, 25–50%; 3, 50–75%; and 4, >75%. Morphometric examinations were performed in a blinded manner by two independent investigators.
Cell culture
Mouse proximal tubular (MPT) cells (generously provided by Dr Lloyd G. Cantley, Yale University School of Medicine, New Haven, CT, USA), an immortalized proximal tubular epithelial mouse cell line, were grown in α-Minimal Essential Medium (MEM) supplemented with 10% foetal bovine serum and antibiotics (100 U/mL penicillin G, 100 μg/mL streptomycin and 0.25 μg/mL amphotericin). Cells were seeded in a 6-cm cell culture plate and allowed to adhere for 16 h in an incubator at 37°C with 5% carbon dioxidein 95% air and were subsequently serum starved.
Transfection of small interfering RNA (siRNA) targeting SIRT2 or MKP-1
MPT cells (5 × 10⁵ cells/dish) were plated in 6-cm dishes and allowed to grow overnight. siRNA (100 pmol, Dharmacon ON-TARGETplus SMART pool, Dharmacon, Lafayette, CO, USA) and 18 μL Lipofectamine RNAiMAX (Invitrogen, Waltham, MA, USA) were diluted in Opti-MEM (Invitrogen) to a total volume of 2 mL. The diluted siRNA and Lipofectamine RNAiMAX were mixed and incubated to generate the transfection mixture at room temperature for 5 min. The cells were washed with Opti-MEM medium and then the transfection mixture was added to the dish and incubated for 16 h.
SIRT2 adenovirus infection
Replication-deficient recombinant adenovirus vectors containing SIRT2 gene were purchased from ViraQuest (North Liberty, IA, USA). The efficiency of virus infection was 95% as measured by green fluorescent protein (GFP) expression. Cells were infected with Ad-CMVeGFP-SIRT2 (Ad-SIRT2) or Ad-CMVeGFP (Ad-control) (multiplicity of infection 1) in 2% serum α-MEM medium for 24 h and then cultured in α-MEM containing 10% foetal bovine serum for another 48 h. The cells were treated with cisplatin and collected for protein analyses.
Western blot analyses
Western blot analyses were performed as previously described [9]. Kidney tissues and MPT cells were homogenized and used for Western blot analyses. Primary antibodies against SIRT2 (Abcam, Cambridge, UK), MKP-1, intercellular adhesion molecule-1 (CAM-1, Santa Cruz Biotechnology, Santa Cruz, CA, USA), acetyl-lysine antibody, phospho-p38, p38, phospho-JNK and JNK (Cell Signaling Technology, Danvers, MA, USA), cleaved caspase 3, receptor-interacting serine/threonine-protein kinase 1 (RIP1) (Cell Signaling Technology) were used. Signals were visualized by chemiluminescent detection according to the manufacturer’s protocol (Amersham Pharmacia Biotech, London, UK).
Immunofluorescence
Immunofluorescence staining was performed as described previously [9]. Anti-SIRT2 (Abcam), anti-MKP-1 and anti-aquaporin 1 (Santa Cruz Biotechnology), FITC-labeled Lotus tetragonolobus lectin (Vector Laboratories, Burlingame, CA, USA) and active-caspase 3 (Cell Signaling Technology) were used for frozen sections of mouse kidney. Secondary Alexa Fluor 555-conjugated antibodies against rabbit or mouse immunoglobulins (1:1000; Invitrogen, Carlsbad, CA, USA) were used to visualize antigen–antibody complexes. Nuclei were stained with 4′, 6-diamidino-2-phenylindole(DAPI). Digital images were obtained using a Zeiss LSM 510 confocal microscope (Carl Zeiss, Göttingen, Germany). The positive area of ICAM-1 was evaluated from the unit area (0.45 mm × 0.45 mm) and expressed as a percentage per unit area using a digital image analysis program (AnalySIS, Soft Imaging System, Münster, Germany).
Immunohistochemistry
Immunohistochemistry was performed as previously described [9]. Kidney sections were incubated overnight with primary antibodies against and MKP-1 (Santa Cruz Biotechnology) and ERHR-3 (Fitzgerald, Acton, NJ, USA) and Gr-1 (BD Biosciences, San Jose, CA, USA). Visualization was achieved using 3-amino-9-ethyl carbazole high-sensitive substrate chromogen (Dako, Carpinteria, CA, USA) chromogenic substrate. The number of ERHR-3-positive cells was evaluated from the unit area (0.45 mm × 0.45 mm) and expressed as cell number per unit area using a digital image analysis program (AnalySIS, Soft Imaging System).
Terminal deoxynucleotidyl transferase dUTP nick end labeling assay
Terminal deoxynucleotidyl transferase dUTP nick end labeling (TUNEL) assay was performed to detect apoptosis in kidney tissue sections using the Apoptag Plus Peroxidase in situ Apoptosis Kit (Chemicon International, Temecula, CA, USA) in accordance with the previous method. TUNEL-positive cells were counted in 10 random, non-overlapping fields (×400 magnification) per kidney section using a digital image analysis program (AnalySIS, Soft Imaging System).
RT-PCR
Reverse transcription (RT)-PCR analysis for the assessment of MKP-1 levels in mouse kidney tissues was carried out on a C1000 Thermal Cycler (Bio-Rad, Hercules, CA, USA). Total RNA was isolated from renal tissues by using Trizol (Invitrogen). Complementary DNA was reverse-transcribed from total RNA samples using the Transcriptor First Strand cDNA Synthesis Kit (Roche, Mannheim, Germany). PCR products were quantitatively synthesized from cDNA samples using the TaqManGene Expression Master Mix (PCR Step). Supplementary data, Table S1 summarizes the primer sequences of mouse MKP-1 and glyceraldehyde 3-phosphate dehydrogenase (GAPDH). The resulting DNA amount was normalized to GAPDH amplified in a reaction.
Enzyme-linked immunosorbent assasy (ELISA)
The kidney tissue level of kidney injury molecule (KIM)-1 was measured using an ELISA kit (Abcam) following the manufacturer’s protocol. Each sample was studied in triplicate and the average of the three readings was considered as the actual value. Samples with odds readings were repeated. All assays were performed by the same person using the same equipment.
Annexin V assay
Annexin V staining was carried out using an FITC Annexin V/Dead cell Apoptosis Kit (Invitrogen) and analysed by FACS in a BD FACSCalibur (BD Biosciences) [16].
Statistical analysis
Data are presented as mean ± standard deviation (SD). For parametric data, significance was determined using Student’s t-test and one-way analysis of variance as specified in the text, followed by Tukey’s post hoc tests. Non-parametric data were analysed using the Mann–Whitney U or Kruskal–Wallis tests followed by Dunn’s post-test. Statistical values of P <0.05 were considered significant.
RESULTS
MKP-1 is expressed in normal mouse kidney
First, we evaluated whether MKP-1 mRNA is expressed in the kidney of WT mice. To address this, we performed RT-PCR. MKP-1 mRNA was detected in the kidney of WT mice at 8 weeks after birth and at embryonic Day 15.5 (Figure 1A). To further examine MKP-1 protein expression in the kidney, we performed immunoblot analyses and immunofluorescence studies. MKP-1 was constitutively expressed in the nuclei of renal tubular epithelial cells of WT mice (Figure 1B and C; Supplementary data, Figure S5).
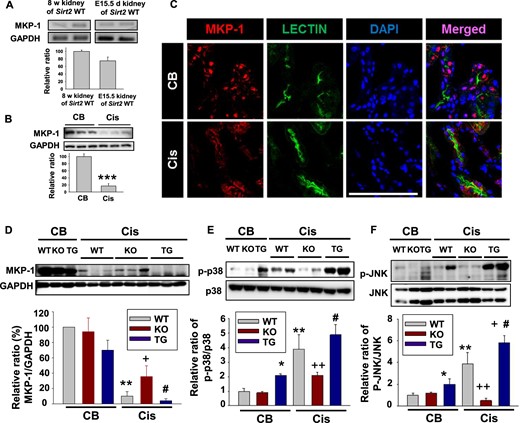
SIRT2 regulates cisplatin-induced downregulated MKP-1 expression in the kidney. (A) MKP-1 mRNA expression analysis in kidney of WT mice. Kidneys were harvested at embryo Day 15.5 and postnatal 8 weeks in WT mice. RT-PCR using kidney RNA to analyze the mRNA level of MKP-1 was carried out as described in the Materials and Methods section (n = 4, each group). (B) Western blot analyses of MKP-1 in the kidney of WT mice after cisplatin (Cis) treatment (n = 6, each group). (C) Fluorescent immunostaining of kidney sections with antibodies against MKP-1 and lectin to monitor the effects of Cis. CB or Cis-treated mouse kidneys were processed as described in our protocol. MKP-1 was detected with AlexaFluor 555-conjugated secondary antibody (red); nuclei were stained with DAPI (blue). Lectin (green) was used as a marker of proximal tubular epithelial cells. Bar = 100 μm. (D–F) Western blot analysis of MKP-1 (D), phosphorylation of p38 (E) and c-Jun N-terminal kinases (JNK; F) in the kidney of WT (n = 6), Sirt2 KO (n = 6) and Sirt2 TG (n = 6) mice. Kidneys were harvested 3 days after Cis (20 mg/kg body weight) or CB injection. Samples containing 20 µg of protein were subjected to electrophoresis and then analyzed by Western blot with antibody against MKP-1, GAPDH, phospho-p38 (p-p38), p38, phospho-JNK (p-JNK) and JNK. Relative protein level of MKP-1 was normalized to GAPDH. Relative protein levels of p-P38 and p-JNK were normalized to p38 and JNK, respectively. Data are expressed as mean ± SD. *P < 0.05 versus WT + CB; **P < 0.01 versus WT + CB; +P < 0.05 versus WT + Cis; ++ P < 0.01 versus WT + Cis; #P < 0.05 versus Sirt2 KO + Cis.
MKP-1 expression is decreased after cisplatin treatment
In the next experiment, to examine whether cisplatin regulates MKP-1 expression in the kidney, we administered cisplatin intraperitoneally to WT mice and performed immunoblot analyses. MKP-1 expression was decreased in the kidney after treatment with cisplatin (Figure 1B).
SIRT2 regulates cisplatin-induced downregulated MKP-1 expression in the kidney
Cisplatin-induced downregulated MKP-1 expression was reversed in the kidney of Sirt2 KO mice and further decreased in the kidney of Sirt2 TG mice (Figure 1D). As MAPKs may be responsible, we evaluated expression of the phosphorylated forms of p38 and JNK in the kidney. Phosphorylated p38 expression increased in the kidney of WT mice after treatment with cisplatin. SIRT2 KO mice suppressed cisplatin-induced phosphorylation of p38,and SIRT2 overexpression further increased cisplatin-induced phosphorylation of p38 in the kidney (Figure 1E). Phosphorylation of p38 was not significantly changed in the kidneys of Sirt2 KO mice after treatment with control buffer (CB; Figure 1E). Cisplatin also increased phosphorylation of JNK in WT mice kidney. Cisplatin-induced phosphorylation of JNK was downregulated in Sirt2 KO mice kidney and further increased in the kidney of Sirt2 TG mice (Figure 1F).
Cisplatin-induced suppression of MKP-1 expression is regulated by SIRT2 in MPT cells
We evaluated whether cisplatin regulates MKP-1 expression in SIRT2-knockdown or SIRT2-overexpressed MPT cells. Western blot analyses showed that cisplatin treatment significantly suppressed MKP-1 expression in control-siRNA- or control-adenovirus-transfected MPT cells (Figure 2A and B). The cisplatin-induced decrease of MKP-1 expression was significantly increased in SIRT2-knockdown MPT cells and decreased in SIRT2-overexpressed MPT cells (Figure 2A and B). To further evaluate the signal mechanism in MKP-1 expression regulated by SIRT2, MPT cells were treated with AGK2 (SIRT2 inhibitor) with or without SB203580 (p38 inhibitor) after cisplatin treatment. Our data showed that cisplatin-induced MKP-1 protein expression was increased in MPT cells after treatment with AGK2 and SB203580 compared with cells treated with AGK2 (Supplementary data, Figure S2). This finding suggests that a p38 MAPK signaling pathway is associated with regulation of the SIRT2–MKP-1 axis. In the next experiment, we explored whether SIRT2 physically interacts with MKP-1 in MPT cells after treatment with cisplatin. After immunoprecipitation with MKP-1 or SIRT2 antibody, immunoblot analyses showed that SIRT2 directly interacts with MKP-1 (Figure 2C and D). Cisplatin treatment significantly increased the interaction between MKP-1 and SIRT2 (Figure 2C and D). In the next experiment, we evaluated the changes of MKP-1 acetylation in SIRT2-knockdown or SIRT2-overexpressed MPT cells after treatment with cisplatin. Immunoprecipitation analysis demonstrated that cisplatin treatment increased acetylation of MKP-1 in MPT cells. Cisplatin-induced acetylation of MKP-1 was significantly increased in SIRT2-knockdown MPT cells and decreased in Ad-SIRT2-transfected MPT cells after cisplatin stimulation (Figure 2E and F). Our data also showed that cisplatin decreased SIRT2 expression in control-siRNA- or control-adenovirus-transfected MPT cells (Figure 2A and B). In the next experiment, we evaluated the change of SIRT2 expression in the kidneys of WT mice after cisplatin treatment. SIRT2 expression was decreased in the kidneys after cisplatin administration (Supplementary data, Figure 1C).
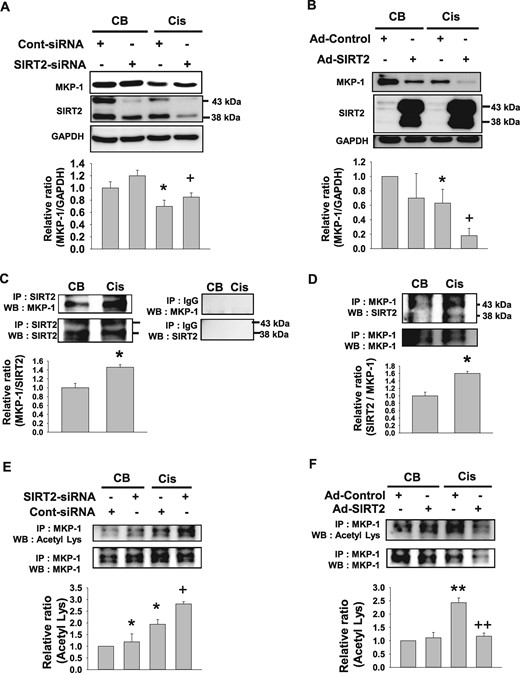
Cisplatin-induced suppression of MKP-1 expression is regulated by SIRT2 in MPT cells. (A) Western blot analyses of MKP-1 from MPT cells after treatment with small interfering RNA targeting SIRT2 (SIRT2–siRNA) or control siRNA (Cont-siRNA) plus cisplatin treatment (Cis; 20 mg/mL) for 24 h (n = 4, each group). (B) Western blot analyses of MKP-1 in SIRT2-overexpressing adenovirus (Ad-SIRT2) or control-adenovirus (Ad-control)-transfected MPT cells at 24 h after Cis treatment (n = 4, each group). Transfected MPT cell lysates were immunoblotted with an MKP-1 antibody. Data are expressed as mean ± SD. *P < 0.05 versus CB + Cont-siRNA or CB + Ad-Control; **P < 0.01 versus CB + Cont-siRNA or CB + Ad-Control; +P < 0.05 versus Cis + Cont-siRNA or Cis + Ad-Control; ++P < 0.01 versus Cis + Cont-siRNA or Cis + Ad-Control. (C) Western blot analyses of MKP-1 from MPT cells after Cis (20 mg/mL) or CB treatment. MPT cell lysates were immunoprecipitated against SIRT2 antibody, and immunoprecipitates were immunoblotted with MKP-1 (n = 4, each group). Data are expressed as mean ± SD. *P < 0.05 versus CB. (D) Western blot analyses of SIRT2 from MPT cells after Cis (20 mg/mL) or CB treatment. MPT cell lysates were immunoprecipitated against MKP-1 antibody and immunoprecipitates were immunoblotted with SIRT2 (n = 4, each group). Data are expressed as mean ± SD. *P < 0.05 versus CB. (E) Western blot analyses of MKP-1 acetylation in small interfering RNA targeting SIRT2 (SIRT2–siRNA) or control siRNA (Cont-siRNA) at 24 h after cisplatin (Cis; 20 mg/mL) treatment (n = 4, each group). (F) Western blot analyses of MKP-1 acetylation in SIRT2-overexpressing adenovirus (Ad-SIRT2) or control-adenovirus (Ad-control)-transfected MPT cells at 24 h after Cis treatment (n = 4, each group). Transfected MPT cell lysates were immunoprecipitated against MKP-1 antibody, and immunoprecipitates were immunoblotted with an acetyl-lysine antibody. Data are expressed as mean ± SD. *P < 0.05 versus CB + Cont-siRNA or CB + Ad-Control; **P < 0.01 versus CB + Cont-siRNA or CB + Ad-Control; +P < 0.05 versus Cis + Cont-siRNA or Cis + Ad-Control; ++P < 0.01 versus Cis + Cont-siRNA or Cis + Ad-Control.
SIRT2 regulates cisplatin-induced MAPK signaling in MPT cells
It has been demonstrated that increased acetylation of MKP-1 suppresses MAPK signaling [12]. We evaluated the effect of SIRT2 on the cisplatin-induced MAPK-dependent signaling pathway. Cisplatin treatment increased phosphorylation of p38 and JNK in control-siRNA- or control-adenovirus-transfected MPT cells (Figure 3). Phosphorylation of p38 and JNK in SIRT2-siRNA-transfected MPT cells was significantly decreased compared with control-siRNA-transfected MPT cells after cisplatin treatment (Figure 3A and C). Overexpression of SIRT2 by Ad-SIRT2 significantly increased the phosphorylation of p38 and JNK compared with Ad-control-transfected cells after cisplatin treatment (Figure 3B and D). Treatment with SIRT2–siRNA or Ad-SIRT2 alone did not affect phosphorylation of JNK and p38.
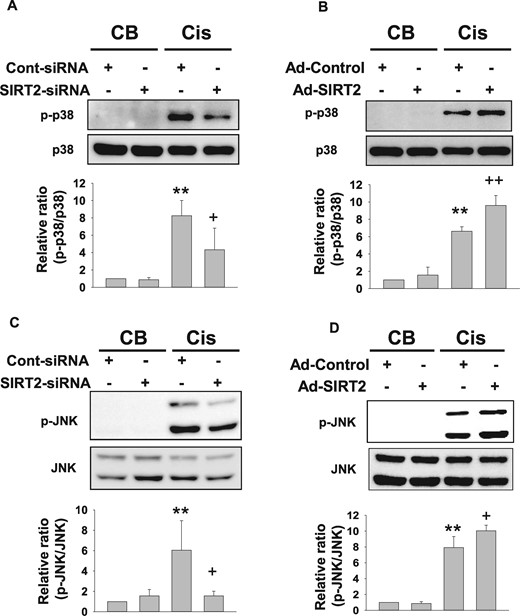
SIRT2 regulates cisplatin-induced p38 and JNK phosphorylation in MPT cells (A and B). Western blot analysis of p38 phosphorylation in SIRT2-siRNA- or Ad-SIRT2-transfected MPT cell. siRNA- or adenovirus-transfected MPT cells were treated with cisplatin (Cis) for 24 h (n = 4, each group in A and B). Densitometric analyses are presented as the relative ratio of phospho-p38 (p-p38) to p38. Bars represent the mean ± SD. (C and D) Western blot analysis of JNK phosphorylation in SIRT2–siRNA- or Ad-SIRT2-transfected MPT cells. siRNA- or adenovirus-transfected MPT cells were treated with Cis for 24 h (n = 5, each group in C and D). Densitometric analyses are presented as the relative ratio of phospho-JNK (p-JNK) to JNK. Bars represent the mean ± SD. Data are expressed as mean ± S.D. **P < 0.01 versus CB + Cont-siRNA or CB + Ad-Control; +P < 0.05 versus Cis + Cont-siRNA or Cis + Ad-Control; ++P < 0.01 versus Cis + Cont-siRNA or Cis + Ad-Control.
Knockdown of MKP-1 increases cisplatin-induced MAPK signaling in MPT cells
Considering that MKP-1 is an upstream regulator of p38 and JNK in the MAPK pathway, we hypothesized that MKP-1 also has a regulatory role in MPT cells after cisplatin treatment [3]. To evaluate the role of MKP-1 in cisplatin-induced MAPK signaling, we treated MPT cells with MKP-1 siRNA with or without cisplatin. Phosphorylation of p38 and JNK in MKP-1-siRNA-transfected MPT cells was significantly increased compared with control-siRNA-transfected MPT cells after cisplatin treatment (Supplementary data, Figures S3A–C). Treatment with MKP-1-siRNA alone did not affect phosphorylation of JNK or p38.
Absence of SIRT2 improves kidney function, tubular injury and survival in cisplatin-induced acute kidney injury
After induction of cisplatin nephrotoxicity, renal function measured by serum creatinine was significantly improved in Sirt2 KO mice at 3 days after cisplatin treatment compared with WT mice (Figure 4A). Serum level of creatinine showed a tendency higher in Sirt2 TG mice compared with WT mice after cisplatin treatment, but there was no statistical significance (Figure 4A). A biomarker for renal tubular injury, KIM-1 level was examined. Kidney tissue level of KIM-1 was significantly decreased in Sirt2 KO mice and increased in Sirt2 TG mice after cisplatin treatment compared with WT mice (Figure 4B). Treatment with cisplatin significantly decreased the survival rate in WT mice compared with CB treatment (Figure 4C). However, positive effects in increasing the survival rates and extending the survival times were observed in Sirt2 KO mice compared with WT mice after administration of cisplatin (Figure 4C). In contrast, Sirt2 TG mice had a lower survival rate after cisplatin injection compared with WT mice (Figure 4C). We next evaluated whether cisplatin-induced renal tubular damage was changed in WT mice, Sirt2 KO mice and Sirt2 TG mice. As presented in Figure 4D and E, this cisplatin-induced renal tubular damage was significantly ameliorated in Sirt2 KO mice compared with WT mice. When we determined the cisplatin-induced tubular injury score, the tubular injury score was significantly higher in Sirt2 TG mice compared with WT mice (Figure 4D and E).
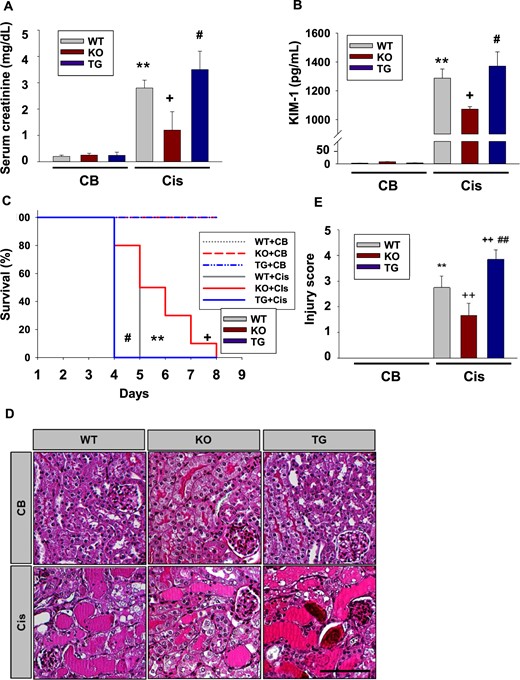
Effect of SIRT2 on kidney function, survival and renal injury. (A) Serum levels of creatinine. Blood samples from WT (n = 12), Sirt2 KO (n = 12) and Sirt2 TG (n = 12) mice were collected 3 days after Cis (20 mg/kg body weight) or CB injection and serum creatinine was measured. (B) Tissue level of KIM-1 in the kidney. Kidney samples from WT (n = 5), Sirt2 KO (n = 5) and Sirt2 TG (n = 5) mice were collected 3 days after Cis (20 mg/kg body weight) injection and kidney tissue level of KIM-1 was measured by ELISA. (C) Survival rate of WT (n = 10), Sirt2 KO (n = 10) and Sirt2 TG (n = 10) mice after Cis (20 mg/kg body weight) or CB administration. (D) Representative findings of periodic acid–Schiff staining of kidneys from WT, Sirt2 KO and Sirt2 TG mice treated with Cis or CB. Scale bar = 100 μm. (E) Injury score. Kidneys were harvested from WT (n = 6), Sirt2 KO (n = 6) and Sirt2 TG (n = 6) mice 3 days after Cis (20 mg/kg body weight) administration. Data are expressed as mean ± SD. **P < 0.01 versus WT + CB; +P < 0.05 versus WT + Cis; ++P < 0.01 versus WT + Cis; #P < 0.05 versus Sirt2 KO + Cis; ##P < 0.01 versus Sirt2 KO + Cis.
SIRT2 regulates cisplatin-induced tubular apoptosis and necroptosis
As cisplatin-induced tubular injury was ameliorated in Sirt2 KO mice compared with WT mice, apoptosis was measured by determination of TUNEL-positive cells. The number of TUNEL-positive tubular cells was decreased in Sirt2 KO mice and increased in Sirt2 TG mice compared with WT mice after cisplatin treatment (Figure 5A and B). In the next experiment, we determined the expression levels of cleaved caspase-3 in the kidneys of WT, Sirt2 KO and Sirt2 TG mice. The expression of cleaved caspase-3 was lower in Sirt2 KO mice and higher in Sirt2 TG mice after cisplatin treatment compared with WT mice (Figure 5C and D). In the next experiment we evaluated the effect of SIRT2 on the change of Annexin V in cisplatin-treated MPT cells. Flow cytometry data showed that the number of annexin V-positive cells was increased by 12% after exposure to cisplatin (Figure 5E). In contrast, Annexin V-positive apoptotic cell death was diminished in SIRT2-siRNA-transfected cells compared with control-siRNA-transfected cells after cisplatin treatment (Figure 5E). Necroptosis is a regulated form of necrotic cell death in cisplatin-induced renal injury [17]. To assess whether SIRT2 regulates necroptosis in cisplatin-induced kidney injury, Western blot analysis of RIP1, a marker of necroptosis, was performed in the kidneys of Sirt2 KO, Sirt2 TG and WT mice. Our data showed that cisplatin-induced RIPK1 expression decreased in the kidneys of Sirt2 KO mice and increased in the kidney of Sirt2 TG mice compared with WT mice (Figure 5F).
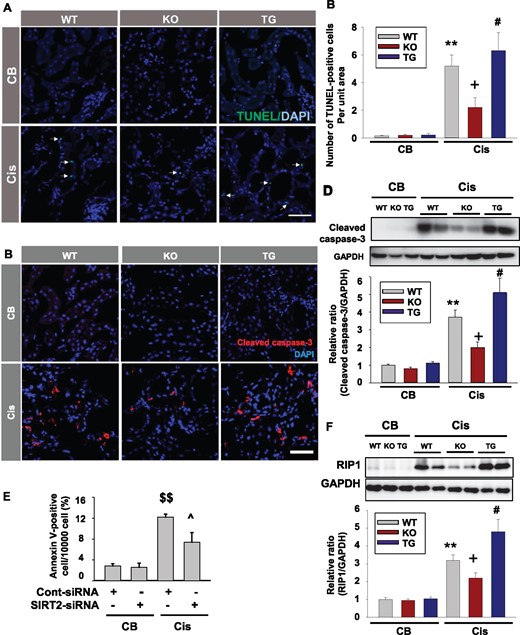
SIRT2 regulates cisplatin-induced tubular apoptosis and necroptosis. (A and B) Apoptosis was assessed by the terminal deoxynucleotidyl TUNEL assay and the number of apoptotic cells, as defined by chromatin condensation or nuclear fragmentation (apoptotic bodies), was counted. Scale bar = 100 µm. Kidneys in WT, Sirt2 KO and Sirt2 TG mice were harvested 3 days after cisplatin (Cis) or CB injection. TUNEL-positive cells were counted in 10 randomly, non-overlapping fields (×400 magnification) per kidney (n = 8, each group). The number of TUNEL-positive cells was significantly decreased in Sirt2 KO mice kidney and increased in Sirt2 TG mice kidney compared with WT mice. (C and D) Cleaved caspase-3 expression was evaluated by immunofluorescence (C) and Western blot analysis (D) using anti-caspase-3 (detecting cleaved forms) antibody. Kidneys in WT (n = 5), Sirt2 KO (n = 5) and Sirt2 TG (n = 5) mice were harvested 3 days after cisplatin administration. Densitometric analysis for cleaved caspase-3 is presented as the relative ratio of each cleaved caspase-3 to GAPDH. (E) Flow cytometry analyses of Annexin-V in small interfering RNA-targeting SIRT2 (SIRT2–siRNA) or control-siRNA (Cont-siRNA)-transfected MPT cells at 24 h after cisplatin (Cis; 20 mg/mL) treatment (n = 4, each group). (F) Western blot analysis of RIP-1. Kidneys in WT (n = 5), Sirt2 TG (n = 5) and Sirt2 KO (n = 5) mice were harvested 3 days after cisplatin administration. Data are expressed as mean ± SD. **P < 0.01 versus WT + CB; +P < 0.01 versus WT + Cis; #P < 0.05 versus WT + Cis; $$P < 0.05 versus CB + Cont-siRNA; ^P < 0.05 versus Cis + Cont-siRNA.
SIRT2 regulates cisplatin-induced renal inflammation
Western blot or immunohistochemistry results showed that cisplatin-induced ICAM-1 expression was decreased in Sirt2 KO mice kidney and further increased in Sirt2 TG mice kidney compared with WT mice (Figure 6A–C). To further evaluate the signal mechanism in ICAM-1 expression regulated by SIRT2, MPT cells were treated with AGK2 (SIRT2 inhibitor) with or without SB203580 (p38 inhibitor) after cisplatin treatment. We found that inhibition of p38 using SB203580 abrogated the cisplatin-induced ICAM-1 expression that was down-regulated by SIRT2 (Supplementary data, Figure S4). This finding suggests that a p38 MAPK signaling pathway is associated with regulation of ICAM-1 expression through regulation by SIRT2 and that the SIRT2–MKP-1 axis is regulated by p38. Since ICAM-1 plays a critical role in macrophage recruitment, we examined whether there were changes with ERHR-3-positive macrophage infiltration of the kidneys of WT, Sirt2 KO and Sirt2 TG mice [18, 19]. The cisplatin-induced increase of ERHR-3-positive macrophage accumulation was significantly lower in Sirt2 KO mice than WT mice (Figure 6D and E). However, there was an increased number of ERHR-3-positive macrophages in the kidney of Sirt2 TG mice compared with Sirt2 KO mice (Figure 6D and E). Compared with WT mice, Sirt2 KO mice exhibited decreased Gr-1-positive neutrophil infiltration in the kidney after cisplatin treatment. The number of Gr-1-positive neutrophils was higher in Sirt2 TG mice than in Sirt2 KO mice (Figure 6F and G).
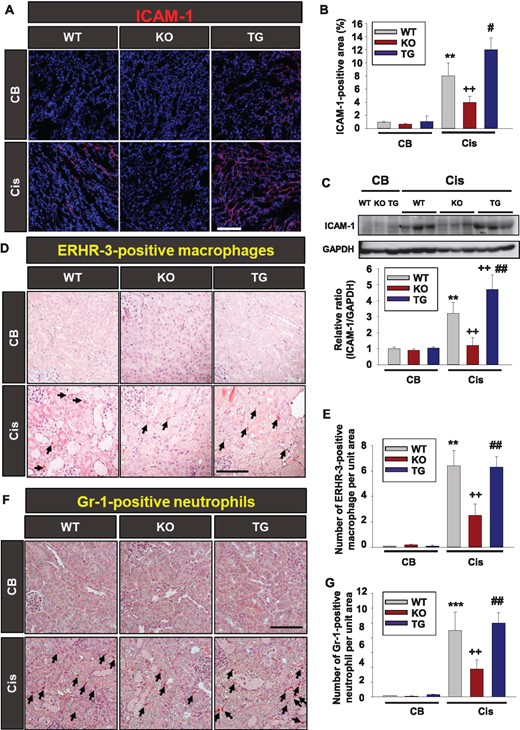
SIRT2 regulates cisplatin-induced renal inflammation. (A) Immunofluorescence study of ICAM-1. Kidneys from WT (n = 8), Sirt2 KO (n = 8) and Sirt2 TG (n = 8) mice were harvested at 3 days after intraperitoneal cisplatin (Cis) or CB injection. Tissues were fixed in 4% formaldehyde solution and kidney sections were then stained with ICAM-1 antibody. Scale bar = 100 μm. (B) Quantitative score of ICAM-1-positive area in the kidney section. (C) Western blot analysis of ICAM-1 in the kidney tissue from WT (n = 8), Sirt2 KO (n = 8) and Sirt2 TG (n = 8) mice treated with Cis or CB. Densitometric analyses are presented as the relative ratio of ICAM-1 to GAPDH. Note that the expression of ICAM-1 was significantly decreased in Sirt2 KO mice kidneys and increased in Sirt2 TG mice compared with WT mice kidneys. Data are expressed as mean ± SD. (D) Immunohistochemical findings of ERHR-3-positive macrophage. Kidneys from WT (n = 8), Sirt2 KO (n = 8) and Sirt2 TG (n = 8) mice were harvested at 3 days after intraperitoneal Cis or CB injection. Tissues were fixed in 4% formaldehyde solution and kidney sections were then stained with ERHR-3 antibody. Scale bar = 100 μm. (E) Quantitative score of ERHR-3-positive macrophages in the kidney section. (F) Immunohistochemical study of Gr-1-positive neutrophil. Kidneys from WT (n = 8), Sirt2 KO (n = 8) and Sirt2 TG (n = 8) mice were harvested at 3 days after intraperitoneal Cis or CB injection. (G) Quantitative score of Gr-1-positive neutrophils in the kidney section (G). Data are expressed as mean ± SD. **P < 0.01 versus WT + CB; ***P < 0.001 versus WT + CB; ++P < 0.01 versus WT + Cis; #P < 0.05 versus Sirt2 KO + Cis; ##P < 0.01 versus Sirt2 KO + Cis.
DISCUSSION
MKP-1 is a dual-specificity protein phosphatase. MKP-1 dephosphorylates both tyrosine and serine/threonine residues of MAPKs, including p38 MAPK and JNK [6]. Thus the JNK and p38 MAPK signal pathways are effective downstream targets of MKP-1. As MAPKs may be responsible for drug-induced apoptosis, it has been demonstrated that MKP-1 decreases drug-induced JNK activation and increases multidrug resistance in cancer cells [20]. In renal cancer cells, increased MKP-1 expression is linked to increased cancer cell survival by attenuating apoptosis [21]. Thus it has been suggested that MKP-1 is required for resistance in cancer cells [22, 23]. However, the role of MKP-1 in normal kidney is not well known.
Regarding MKP-1 expression in normal kidney, it was reported that MKP-1 is strongly expressed in the developing stage (E18), but MKP-1 protein was undetectable in adult rat kidney [24]. However, Kim et al. [25] demonstrated that MKP-1 activity was detected in normal mouse kidney. In this study we found that MKP-1 mRNA and protein were expressed in the kidney of normal adult mice (Figure 1A and B). Although there were reports about MKP-1 expression in normal kidney, there are little data on the exact location of MKP-1 in renal cells [26, 27]. In this study we tried to evaluate the location of MKP-1 in kidney tissue. Our immunofluorescence data showed that MKP-1 is located in the DAPI-positive area of renal tubular epithelial cells (Figure 1C). It has been demonstrated that MKP-1 expresses in the nucleus of renal tubular cell lines [26, 28]. All of these data suggest that MKP-1 is normally expressed in the nucleus of renal tubular epithelial cells.
Kim et al. [25] reported that there is no significant change of MKP-1 in the kidney after treatment with cisplatin. However, we showed that cisplatin treatment decreased the renal expression of MKP-1 (Figure 1B and C). As activation of MAPKs is related with drug-induced apoptosis, cisplatin increases renal injury through up-regulation of p38 and JNK [10, 11]. Because MAPKs are a downstream signaling pathway of MKP-1, cisplatin-induced down-regulation of MKP-1 is a new possible mechanism of cisplatin-induced phosphorylation of MAPK (JNK and p38) in renal injury. Because MAPKs are also therapeutic targets of MKP-1, regulation of MKP-1 expression can be a new method to ameliorate cisplatin-induced renal injury.
SIRT2 is a sirtuin family protein and an NAD+-dependent deacetylase. There are few reports on the role of SIRT2 on cisplatin-induced renal injury. In this study we evaluated the effect of SIRT2 on renal injury induced by cisplatin. MKP-1 has a high specificity for p38 MAPK and JNK, but may have a relatively low specificity for extracellular signal-regulated kinase [4]. We therefore evaluated the p38 and JNK signaling pathways in the kidney and MPT cells. Our data showed that phosphorylation of p38 and JNK decreased in Sirt2 KO mice and increased in Sirt2 TG mice compared with WT mice (Figure 1E and F). There was the same pattern of expression changes of JNK phosphorylation in Sirt2 KO and Sirt2 TG mice compared with WT mice (Figure 1F).
We showed that cisplatin increased acetylation of MKP-1 in MPT cells (Figure 2E and F). However, MKP-1 expression was significantly decreased in cisplatin-treated MPT cells (Figure 1B). Finally, cisplatin-induced phosphorylation of p38 and JNK was increased (Figure 3). We found that the decrease of SIRT2 resulted in amelioration of renal function as shown by reduction of creatinine, renal caspase 3-activation, TUNEL-positive apoptotic cells and improved histological damage previously increased by cisplatin (Figure 5).
SIRT2 regulates acetylation level of MKP-1 in renal tubular epithelial cells. In this study, our data showed that MKP-1 acetylation level was increased in SIRT2-knockdown cell and decreased in SIRT2-overexpressed MPT cells after treatment with cisplatin (Figure 2E and F). We also found that SIRT2 regulates MKP-1 expression in the kidney after cisplatin treatment (Figure 1D). SIRT2-related MKP-1 expression was regulated by p38-dependent signal mechanism (Supplementary data, Figure S2). Therefore, both acetylation level and expression of MKP-1 can be regulated by SIRT2 in cisplatin-induced renal injury.
Knockout of SIRT2 in cancer cells increases sensitivity to cisplatin treatment [13]. They showed mild sensitivity to cisplatin in SIRT2 knockout cell and it may be related with increased sensitive to pro-apoptotic stimulus. However, in this study, our data showed that a decrease of SIRT2 in the renal tubular epithelial cell suppressed the sensitivity to cisplatin treatment (Figure 4). The mechanism of decreased sensitivity to cisplatin may be related with changes of MKP-1 expression. Therefore there is a discrepancy in the mechanism of SIRT2 on sensitivity to cisplatin between cancer cell and kidney cells.
Our data showed that down-regulation of MKP-1 in the kidney is a new possible mechanism of cisplatin-induced renal injury with increased phosphorylation of MAPK. Therefore regulation of MKP-1 expression by SIRT2 can be a new therapeutic target to ameliorate cisplatin-induced renal injury (Figure 7).
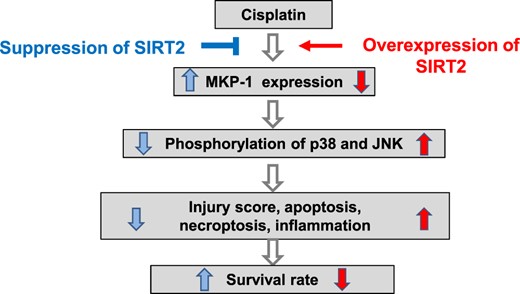
Schematic summary of the effect SIRT2 on MKP-1 in the cisplatin-induced renal injury model.
ACKNOWLEDGEMENTS
This research was supported by the Basic Science Research Program through the National Research Foundation of Korea (NRF) funded by the Ministry of Education, Science and Technology (NRF-2017R1A2A2A05001197 and NRF-2019R1A2C1090358, to K.W.), the Biomedical Research Institute, Jeonbuk National University Hospital(CUHBRI-2012-02-003, to K.W.), and a grant from the Basic Science Research Program through the NRF funded by the Ministry of Education (NRF-2017R1A6A3A11029375, to J.Y.J).
CONFLICT OF INTEREST STATEMENT
There are no conflicts of interest.


Comments