


Abstract
Serum chloride (Cl) levels confer better prognostic value than serum sodium (Na) levels among patients with heart failure. Little is known about the relationship between serum Cl levels and clinical outcomes among patients with chronic kidney disease (CKD).
This was a retrospective cohort study enrolling patients with Stages G3–G5 CKD who visited the nephrology outpatient department of Osaka University Hospital from April 2005 to December 2014. The main exposure was time-varying serum Cl levels categorized as quartiles. The study outcome was a composite of all-cause death and cardiovascular events.
A total of 2661 patients with CKD were included in the analysis. During a median follow-up of 4.0 years, 284 deaths and 416 cardiovascular events occurred. Compared with patients in the third Cl quartile, those in the first Cl quartile showed a significantly higher risk of the outcome after adjustment for demographics and clinical factors including time-varying serum Na, serum albumin and bicarbonate levels, and use of diuretics and sodium bicarbonate [hazard ratio (HR) 2.13; 95% confidence interval (CI) 1.20–3.81; P = 0.01] and, additionally, anion gap (HR 2.13; 95% CI 1.26–3.57; P = 0.004). Adding serum Cl levels, but not serum Na levels, to the multivariable model significantly improved net reclassification index (0.335; P < 0.001) and integrated discrimination improvement (0.0113; P = 0.01).
Lower serum Cl levels are an independent predictor of death and cardiovascular events. The incremental prognostic value of Cl was superior to that of Na in patients with CKD.
INTRODUCTION
Electrolyte abnormalities are common complications in patients with chronic kidney disease (CKD) [1–6]. Among them, hyponatremia has been recognized as highly clinically relevant not only because it is one of the most frequent electrolyte disorders in CKD but also because it is a well-established prognostic marker for poor clinical outcomes such as death, cardiovascular events, progression of CKD and fracture [7–11].
In contrast, chloride (Cl), the most abundant anion in the extracellular fluid, has been regarded merely as a counter anion of sodium (Na) and received little attention. However, recent cohort studies of patients with heart failure have shown that hypochloremia predicts more accurately the risk of death than hyponatremia [12, 13]. The link between Cl and mortality risk was also reported among hypertensive patients [14]. Although the precise underlying mechanism remains unclear, Cl, rather than Na, is known to directly regulate renin secretion, tubuloglomerular feedback and activities of diuretic-sensitive Na transporters in the renal tubules [15–19]. Lower serum Cl levels are associated with higher plasma renin levels, poorer diuretic efficiency and a lower rate of decongestion among patients with heart failure [20, 21]. Therefore, Cl may play a role in the pathogenesis of cardiovascular diseases, independent of Na.
Evidence regarding the relationship between Cl and prognosis of patients with CKD is scarce. Since they often have acid–base disturbances that affect serum Cl levels, the prognostic value of Cl in CKD might vary from that in other patient populations. A previous cohort study of 923 patients with Stages G2–G5 CKD reported that low serum Cl levels (<104 mEq/L) were associated with an increased risk of death and cardiovascular events [22]. Unfortunately, the study was limited in that it did not account for bicarbonate levels, anion gap or use of diuretics and sodium bicarbonate, which could confound the association between Cl and the outcome [5, 6, 23, 24]. It should be also noted that serum Cl levels might be altered during the course of CKD progression. Furthermore, it is unknown which type of cardiovascular events in CKD is more closely related to low Cl.
Here, we investigated in more detail the relationship between time-varying serum Cl levels and the risk of death and cardiovascular events, independent of the abovementioned confounders, among nondialysis CKD patients. Moreover, we compared the risk reclassification ability of Cl with that of Na.
MATERIALS AND METHODS
Study design and population
This was a retrospective cohort study of nondialysis patients with CKD who visited the outpatient department of nephrology at Osaka University Hospital from April 2005 to December 2014. We included patients who were ≥18 years whose estimated glomerular filtration rate (eGFR), measured twice with an interval of at least 90 days, was consistently 10–60 mL/min/1.73 m2. We excluded patients who had already received renal replacement therapy (RRT) or received sodium bicarbonate at study baseline. Patients were followed from the day of the second eGFR measurement until death, initiation of RRT, loss to follow-up or the end of the study period (31 May 2016), whichever came first. For patients with available data on bicarbonate levels, follow-up was initiated from the first measurement of bicarbonate levels and serum Cl levels. The study protocol was approved by the Ethics Committee of Osaka University Hospital (No. 16296).
Study outcome
The outcome of this study was a composite of all-cause death and cardiovascular events requiring hospitalization. Cardiovascular events were defined as coronary artery diseases (angina pectoris and myocardial infarction), congestive heart failure and stroke (cerebral infarction, transient ischemic attack and intracranial hemorrhage). The date and cause of death and hospitalizations were obtained from patients’ medical records. We also collected the date of initiation of RRT.
Exposure
The exposure of interest was time-varying serum Cl levels. The data were collected every 3 months during the study period. If there were multiple measurements during a 3-month interval, the measurement taken at the nearest day to the last day of the interval was adopted. If Cl data were missing during a 3-month interval, the last observation carried forward method was used for imputation. Given a potential nonlinear relationship with the outcome, serum Cl levels were categorized into four groups based on the cutoff values of baseline serum Cl quartiles.
Demographic and clinical variables
All data were collected from the medical records, including age, sex, body mass index, systolic and diastolic blood pressure, presence or absence of diabetes mellitus, and laboratory data (hemoglobin, serum levels of total protein, albumin, creatinine, Na, Cl, potassium, calcium, phosphate, bicarbonate, C-reactive protein and total cholesterol), past hospitalizations due to cardiovascular events, medications [sodium bicarbonate, diuretics (loop, thiazide and spironolactone), angiotensin-converting enzyme inhibitors and angiotensin II receptor blockers] and an echocardiographic finding [left ventricular ejection fraction (LVEF)]. Bicarbonate levels were derived from venous blood gas measurements.
The following data were collected every 3 months during the study period by the same method as for Cl: hemoglobin, albumin, creatinine, Na, calcium, phosphate, bicarbonate and dose of medications (loop and thiazide diuretics, spironolactone and sodium bicarbonate). Loop diuretic dose was converted to furosemide equivalents (8 mg torasemide = 60 mg azosemide = 40 mg furosemide) [25]. Thiazide diuretic dose was converted to trichlormethiazide equivalents (1 mg trichlormethiazide = 12.5 mg hydrochlorothiazide).
Statistical analysis
Data were presented as the number (percent) for categorical variables and as the mean (SD) for continuous variables with normal distribution or the median (interquartile range) for those with skewed distribution. Baseline characteristics across serum Cl quartiles were compared using the Cuzick test for trend for continuous variables or the Mantel–Haenszel test for trend for categorical variables.
A multivariable logistic regression analysis was performed to identify factors that were associated with low Cl (first Cl quartile) among patients with normal to high Na (second to fourth Na quartiles).
We examined serial changes in serum Cl levels during 12 months after initiation of diuretics and sodium bicarbonate among patients who had not received these drugs at study entry. A repeated measures mixed-effects linear regression model was used to test the slope of serum Cl levels after initiation of each drug.
A shared frailty Cox proportional hazards model was used to estimate a hazard ratio (HR) and 95% confidence interval (CI) for the outcome, which accounted for the dependence of recurrent events within a patient [28]. We constructed several multivariable models: Model 1 unadjusted; Model 2 adjusted for age, sex, body mass index, systolic blood pressure, diabetes mellitus, past hospitalizations due to cardiovascular events, hemoglobin, albumin, eGFR, calcium, phosphate and medication dose (sodium bicarbonate, loop and thiazide diuretics, and spironolactone); Model 3 adjusted for covariates in Model 2 plus Na; Model 4 adjusted for covariates in Model 2 plus Na and bicarbonate levels; Model 5 adjusted for covariates in Model 2 plus anion gap. Because Na, Cl, bicarbonate and anion gap were highly intercorrelated, as is obvious in the formula for anion gap, we did not enter all these variables together into a single statistical model. The following covariates measured multiple times during the study period were treated as time-varying covariates: hemoglobin, albumin, Na, Cl, calcium, phosphate, bicarbonate and medication dose (sodium bicarbonate, loop and thiazide diuretics, and spironolactone). We performed multiple imputation (multivariate normal model) by creating five imputed datasets in order to fill in the missing values of bicarbonate levels. The relationship between serum Cl levels as a continuous variable and the risk of the outcome was examined in multivariable Model 4. A restricted cubic spline curve with four knots was depicted to show a potential nonlinear relationship between serum Cl levels and the adjusted HR. Subgroup analyses were performed for the following covariates: age, sex, diabetes mellitus, past history of cardiovascular disease, serum Na levels, eGFR and use of loop diuretics. A product term between serum Cl levels and each covariate was entered into multivariable Model 3 in order to assess the interaction affecting risk of the outcome.
To evaluate the incremental value of Cl and Na with reference to the multivariable Model 4, the category-free net reclassification index (NRI), the integrated discrimination improvement (IDI) and Harrell’s C-statistic were estimated. These analyses were performed in a baseline model (but not in the time-dependent model); thus all data were based on the baseline measurements. The outcome was the first event of death or cardiovascular hospitalization. Serum Cl and Na levels were treated as binary (Q1 versus Q2–4) to specifically estimate the impact of low Cl and low Na.
The relationship between Cl and risk of initiation of RRT was also analyzed in a multivariable Cox model (Model 4).
Statistical analyses were performed using STATA IC version 14 (STATA Corporation, College Station, TX, USA) or software R 2.3.0 (R Foundation for Statistical Computing, Vienna, Austria). A P-value of <0.05 was considered to indicate statistical significance.
RESULTS
Our database initially contained a total of 3178 patients whose eGFR (measured twice with an interval of at least 90 days) was 10–60 mL/min/1.73 m2 (Figure 1). After excluding patients who were followed up for <60 days (n = 149) and those who were prescribed sodium bicarbonate at baseline (n = 249), there were 119 (4.3%) patients with missing serum Cl data. Therefore, the remaining 2661 patients were included in the subsequent analysis.
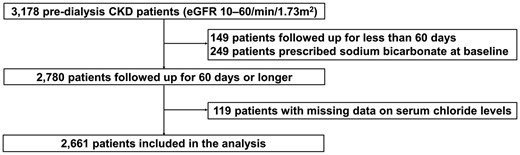
Flow chart of patient selection.
Baseline characteristics according to serum Cl quartiles are shown in Table 1. Patients in the lower Cl quartiles had lower blood pressure levels, more preserved kidney function and higher frequency of past hospitalizations due to congestive heart failure, and were more likely to receive diuretics. Bicarbonate levels increased, whereas serum Na levels decreased, with decreasing Cl quartiles.
Baseline characteristics according to quartile of serum chloride levels
| Characteristics | Quartile of serum chloride levels (range, mEq/L) | ||||||
|---|---|---|---|---|---|---|---|
| n (%) of missing values | Total | 1st (–104) | 2nd (105–106) | 3rd (107–108) | 4th (109–) | ||
| n = 2661 | n = 892 | n = 645 | n = 581 | n = 543 | P for trend | ||
| Demographics | |||||||
| Age, years | 0 (0.0) | 62.8 (14.6) | 62.2 (14.8) | 62.0 (14.8) | 64.1 (14.0) | 63.2 (14.6) | 0.02 |
| Male, n (%) | 0 (0.0) | 1, 669 (62.7) | 576 (64.6) | 396 (61.4) | 370 (63.7) | 327 (60.2) | 0.2 |
| Body mass index, kg/m2 | 61 (2.3) | 23.1 (4.4) | 22.7 (4.5) | 23.4 (4.3) | 23.1 (4.0) | 23.3 (4.8) | 0.01 |
| Systolic blood pressure, mmHg | 66 (2.5) | 130 (21) | 126 (22) | 130 (20) | 132 (19) | 133 (21) | <0.001 |
| Diastolic blood pressure, mmHg | 106 (4.0) | 75 (20) | 74 (29) | 76 (14) | 75 (13) | 76 (13) | <0.001 |
| Diabetes mellitus, n (%) | 0 (0.0) | 814 (30.6) | 306 (34.3) | 186 (28.8) | 159 (27.4) | 163 (30.0) | 0.03 |
| CKD Stage 3 | 0 (0.0) | 1875 (70.5) | 696 (78.0) | 505 (78.3) | 411 (70.7) | 263 (48.4) | <0.001 |
| CKD Stage 4 | 0 (0.0) | 621 (23.3) | 155 (17.4) | 118 (18.3) | 142 (24.4) | 206 (37.9) | <0.001 |
| CKD Stage 5 | 0 (0.0) | 165 (6.2) | 41 (4.6) | 22 (3.4) | 28 (4.8) | 74 (13.6) | <0.001 |
| Laboratory data | |||||||
| Hemoglobin, g/dL | 40 (1.5) | 12.3 (2.1) | 12.6 (2.2) | 12.7 (2.0) | 12.2 (2.0) | 11.5 (1.9) | <0.001 |
| Total protein, g/dL | 363 (13.6) | 6.9 (0.9) | 7.1 (0.9) | 7.0 (0.8) | 6.9 (0.9) | 6.6 (0.9) | <0.001 |
| Albumin, g/dL | 289 (10.9) | 3.7 (0.6) | 3.8 (0.7) | 3.7 (0.6) | 3.7 (0.6) | 3.6 (0.7) | <0.001 |
| Cre, mg/dL | 0 (0.0) | 1.6 (0.8) | 1.5 (0.8) | 1.4 (0.7) | 1.6 (0.8) | 2.0 (1.0) | <0.001 |
| eGFR, mL/min/1.73 m2 | 0 (0.0) | 39.7 (14.8) | 42.3 (14.4) | 43.1 (13.7) | 39.3 (14.2) | 31.8 (14.5) | <0.001 |
| BUN, mg/dL | 15 (0.6) | 26.5 (13.8) | 26.1 (14.8) | 23.3 (11.0) | 25.7 (11.6) | 31.9 (15.7) | <0.001 |
| Sodium, mEq/L | 30 (1.1) | 139 (3) | 137 (4) | 140 (2) | 140 (2) | 141 (2) | <0.001 |
| Chloride, mEq/L | 0 (0.0) | 106 (4) | 102 (3) | 106 (1) | 107 (0) | 111 (2) | <0.001 |
| Potassium, mEq/L | 10 (0.4) | 4.4 (0.6) | 4.3 (0.6) | 4.4 (0.5) | 4.5 (0.5) | 4.6 (0.6) | <0.001 |
| Calcium, mg/dL | 637 (23.9) | 8.9 (0.7) | 9.0 (0.8) | 9.0 (0.6) | 9.0 (0.6) | 8.7 (0.7) | <0.001 |
| Phosphate, mg/dL | 896 (33.7) | 3.5 (0.7) | 3.5 (0.7) | 3.5 (0.6) | 3.5 (0.6) | 3.6 (0.8) | 0.2 |
| Bicarbonate, mEq/L | 1, 879 (70.6) | 24.5 (3.8) | 26.8 (4.0) | 25.1 (3.1) | 24.7 (2.4) | 22.0 (3.3) | <0.001 |
| C-reactive protein, mg/dL | 409 (15.4) | 0.1 [0.0, 0.4] | 0.1 [0.0, 0.7] | 0.1 [0.0, 0.3] | 0.1 [0.0, 0.3] | 0.1 [0.0, 0.3] | <0.001 |
| Total cholesterol, mg/dL | 487 (18.3) | 146 (97) | 142 (102) | 157 (94) | 148 (91) | 138 (97) | 0.4 |
| Adjusted anion gap | 1, 936 (72.8) | 6.7 (2.5) | 7.1 (2.8) | 6.8 (2.5) | 6.2 (2.0) | 6.5 (2.4) | 0.03 |
| Past hospitalizations, n (%) | |||||||
| Myocardial infarction | 0 (0.0) | 18 (0.7) | 5 (0.6) | 4 (0.6) | 5 (0.9) | 4 (0.7) | 0.6 |
| Angina pectoris | 0 (0.0) | 77 (2.9) | 25 (2.8) | 10 (1.6) | 21 (3.6) | 21 (3.9) | 0.1 |
| Congestive heart failure | 0 (0.0) | 72 (2.7) | 38 (4.3) | 12 (1.9) | 11 (1.9) | 11 (2.0) | 0.006 |
| Cerebral infarction | 0 (0.0) | 39 (1.5) | 14 (1.6) | 5 (0.8) | 15 (2.6) | 5 (0.9) | 0.9 |
| Cerebral hemorrhage | 0 (0.0) | 27 (1.0) | 9 (1.0) | 5 (0.8) | 7 (1.2) | 6 (1.1) | 0.7 |
| Medications, n (%) | |||||||
| Loop diuretics | 0 (0.0) | 511 (19.2) | 194 (21.7) | 109 (16.9) | 95 (16.4) | 113 (20.8) | 0.3 |
| Thiazide diuretics | 0 (0.0) | 88 (3.3) | 39 (4.4) | 15 (2.3) | 18 (3.1) | 16 (2.9) | 0.2 |
| Spironolactone | 0 (0.0) | 252 (9.5) | 111 (12.4) | 41 (6.4) | 50 (8.6) | 50 (9.2) | 0.05 |
| ACE inhibitors | 0 (0.0) | 272 (10.2) | 94 (10.5) | 59 (9.1) | 64 (11.0) | 55 (10.1) | 0.9 |
| ARBs | 0 (0.0) | 799 (30.0) | 246 (27.6) | 186 (28.8) | 177 (30.5) | 190 (35.0) | 0.003 |
| ACE inhibitor or ARB | 0 (0.0) | 1071 (40.2) | 340 (38.1) | 245 (38.0) | 241 (41.5) | 245 (45.1) | 0.006 |
Data presented as mean (SD), median [interquartile range] or number (percent).
Cre, creatinine; BUN, blood urea nitrogen; ACE, angiotensin-converting enzyme; ARB, angiotensin II receptor blocker.
Among patients with normal-to-high serum Na levels (139− mEq/L), those who had higher serum albumin levels, higher bicarbonate levels, higher adjusted anion gap and higher serum phosphate levels were more likely to have low serum Cl levels [i.e. first Cl quantile (−104 mEq/L)] (Table 2).
Multivariable logistic regression analysis for low serum chloride [first quartile (–104 mEq/L)] among patients with normal to high serum sodium [second to fourth quartiles (139– mEq/L)].
| Variables | Odds ratio | 95% CI | P |
|---|---|---|---|
| Serum albumin, per 0.1 g/dL | 1.52 | 1.32–1.75 | <0.001 |
| eGFR, per 1 mL/min/1.73 m2 | 1.00 | 0.96–1.04 | 0.9 |
| Serum calcium, per 1 mg/dL | 1.74 | 0.76–3.99 | 0.2 |
| Serum phosphate, per 1 mg/dL | 2.59 | 1.22–5.53 | 0.01 |
| Bicarbonate, per 1 mEq/L | 4.47 | 2.94–6.78 | <0.001 |
| Adjusted anion gap, per 1 unit | 3.42 | 2.29–5.13 | <0.001 |
| Loop diuretics use | 1.19 | 0.38–3.67 | 0.8 |
| Thiazide diuretics use | 0.30 | 0.03–3.16 | 0.3 |
| Spironolactone use | 1.01 | 0.23–4.50 | 0.9 |
During a median follow-up of 4.0 years, a total of 700 outcomes occurred: 284 deaths and 416 hospitalizations due to cardiovascular events (256 congestive heart failure, 114 ischemic heart disease, 14 cerebral hemorrhage and 32 cerebral infarction). RRT was initiated in 335 patients. The median number of measurements of serum Cl levels for each patient was 13 (min 1, max 44). The change in serum Cl levels over the study period was trivial (Figure 2). In a mixed-effects linear regression model, the initiation of loop and thiazide diuretics had little effect on serial changes in serum Cl levels whereas spironolactone slightly increased serum Cl levels. Serum Cl levels were rapidly decreased after the initiation of sodium bicarbonate (Supplementary data, Table S1).
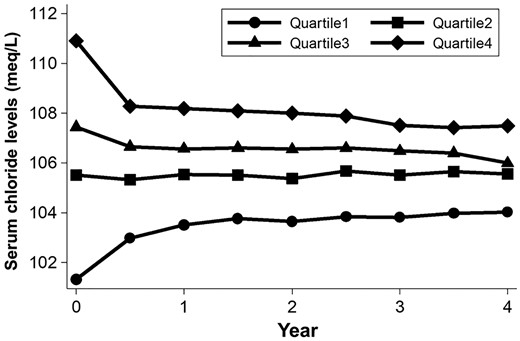
Change in serum chloride levels over the study period. Dots represent the average serum chloride level in each serum chloride quartile. Note that there is trivial change in serum chloride levels throughout the study period.
In an unadjusted Cox model, patients in the first Cl quartile showed a 2.52-fold higher risk (95% CI 1.89–3.37; P < 0.001) of the composite endpoint compared with patients in the third Cl quartile (Table 3). The risk remained significant after adjustment for demographics and clinical factors including serum Na levels, bicarbonate levels, anion gap and medication dose (Table 3). When missing values of bicarbonate levels were imputed by multiple imputation, the risk in the first Cl quartile was not materially altered (adjusted HR 1.74; 95% CI 1.21–2.49; P = 0.003).
Shared frailty Cox proportional hazards models for the risk of death and cardiovascular hospitalizations
| Quartile of serum chloride levels (range; mEq/L) | ||||||||||||
|---|---|---|---|---|---|---|---|---|---|---|---|---|
| 1st (–104) | 2nd (105–106) | 3rd (107–108) | 4th (109–) | |||||||||
| n = 892 | n = 645 | n = 581 | n = 543 | |||||||||
| Outcome | ||||||||||||
| Death, n (%) | 116 (13.0) | 62 (9.6) | 53 (9.1) | 53 (9.8) | ||||||||
| Hospitalizations, n (%) | 208 (23.3) | 69 (10.7) | 73 (12.6) | 66 (12.2) | ||||||||
| Models | HR | 95% CI | P | HR | 95% CI | P | HR | 95% CI | P | HR | 95% CI | P |
|---|---|---|---|---|---|---|---|---|---|---|---|---|
| Model 1 | 2.52 | 1.89–3.37 | <0.001 | 1.11 | 0.80–1.53 | 0.5 | 1.00 | – | – | 1.47 | 1.04–2.06 | 0.03 |
| Model 2 | 2.08 | 1.56–2.78 | <0.001 | 1.19 | 0.86–1.66 | 0.3 | 1.00 | – | – | 1.03 | 0.74–1.45 | 0.9 |
| Model 3 | 2.02 | 1.48–2.74 | <0.001 | 1.19 | 0.85–1.66 | 0.3 | 1.00 | – | – | 1.02 | 0.72–1.44 | 0.9 |
| Model 4 | 2.13 | 1.20–3.81 | 0.01 | 0.93 | 0.49–1.75 | 0.8 | 1.00 | – | – | 0.92 | 0.50–1.70 | 0.8 |
| Model 5 | 2.13 | 1.26–3.57 | 0.004 | 0.91 | 0.48–1.72 | 0.8 | 1.00 | – | – | 0.92 | 0.51–1.65 | 0.8 |
–, not applicable.
Model 1: unadjusted.
Model 2: adjusted for age, sex, body mass index, systolic blood pressure, diabetes mellitus, past hospitalizations due to cardiovascular diseases, estimated glomerular filtration rate, hemoglobin, albumin, calcium, phosphate and medication dose (loop and thiazide diuretics, spironolactone and sodium bicarbonate).
Model 3: adjusted for covariates in Model 2 + serum sodium levels.
Model 4: adjusted for covariates in Model 2 + serum sodium levels + bicarbonate levels.
Model 5: adjusted for covariates in Model 2 + adjusted anion gap.
| Models | HR | 95% CI | P | HR | 95% CI | P | HR | 95% CI | P | HR | 95% CI | P |
|---|---|---|---|---|---|---|---|---|---|---|---|---|
| Model 1 | 2.52 | 1.89–3.37 | <0.001 | 1.11 | 0.80–1.53 | 0.5 | 1.00 | – | – | 1.47 | 1.04–2.06 | 0.03 |
| Model 2 | 2.08 | 1.56–2.78 | <0.001 | 1.19 | 0.86–1.66 | 0.3 | 1.00 | – | – | 1.03 | 0.74–1.45 | 0.9 |
| Model 3 | 2.02 | 1.48–2.74 | <0.001 | 1.19 | 0.85–1.66 | 0.3 | 1.00 | – | – | 1.02 | 0.72–1.44 | 0.9 |
| Model 4 | 2.13 | 1.20–3.81 | 0.01 | 0.93 | 0.49–1.75 | 0.8 | 1.00 | – | – | 0.92 | 0.50–1.70 | 0.8 |
| Model 5 | 2.13 | 1.26–3.57 | 0.004 | 0.91 | 0.48–1.72 | 0.8 | 1.00 | – | – | 0.92 | 0.51–1.65 | 0.8 |
–, not applicable.
Model 1: unadjusted.
Model 2: adjusted for age, sex, body mass index, systolic blood pressure, diabetes mellitus, past hospitalizations due to cardiovascular diseases, estimated glomerular filtration rate, hemoglobin, albumin, calcium, phosphate and medication dose (loop and thiazide diuretics, spironolactone and sodium bicarbonate).
Model 3: adjusted for covariates in Model 2 + serum sodium levels.
Model 4: adjusted for covariates in Model 2 + serum sodium levels + bicarbonate levels.
Model 5: adjusted for covariates in Model 2 + adjusted anion gap.
The unadjusted HR of the fourth Cl quartile was elevated compared with that of the third Cl quartile. However, adjustment by bicarbonate levels in addition to other demographic and clinical factors reduced the risk in this category (Table 3).
When serum Cl levels were treated as a continuous variable, a 1 mEq/L decrease in Cl was associated with an 11% increase (95% CI 1.02–1.20; P = 0.02) in the risk of the outcome. The restricted cubic spline curve showed that the risk was monotonically increased with decreasing serum Cl levels (Figure 3).
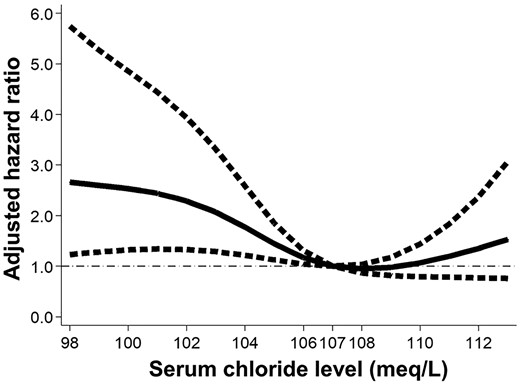
Risk of death and cardiovascular hospitalizations increases as serum chloride levels decrease. A restricted cubic spline curve with four knots showing the association of serum chloride levels with hazard ratio (solid line) and 95% confidence interval (dotted line). Model is adjusted for age, sex, body mass index, systolic blood pressure, diabetes mellitus, past hospitalizations due to cardiovascular diseases, estimated glomerular filtration rate, hemoglobin, albumin, calcium, phosphate, sodium, bicarbonate levels and medication dose (loop and thiazide diuretics, spironolactone and sodium bicarbonate). The reference value of chloride is 107 mEq/L.
Subgroup analysis showed no significant effect modification by prespecified baseline covariates (Figure 4); the interaction terms between Cl and these covariates were not significant. The risk in the first Cl quartile was consistently higher across all subgroups although the difference did not reach significance in a few subgroups due to a small number of patients in those subgroups. Of note, the risk was elevated not only in the lower Na subgroup (HR 2.04; 95% CI 1.48–2.80; P < 0.001) but also the higher Na subgroup (HR 1.65; 95% CI 1.23–2.23; P = 0.001) (Pinteraction = 0.3) (Figure 5).
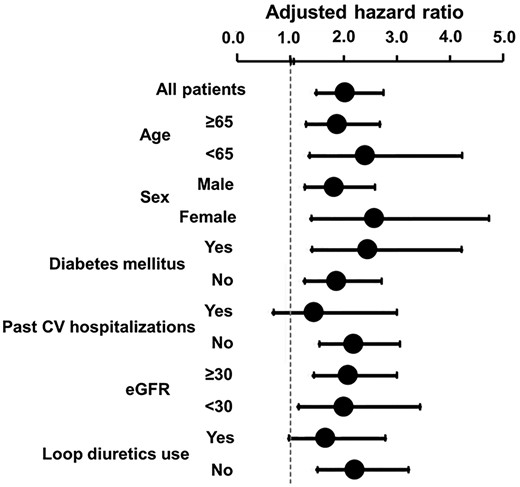
Adjusted hazard ratios in the first chloride quartile are elevated across all subgroups. Models are adjusted for age, sex, body mass index, systolic blood pressure, diabetes mellitus, past hospitalizations due to cardiovascular diseases, estimated glomerular filtration rate, hemoglobin, albumin, calcium, phosphate, sodium and medication dose (loop and thiazide diuretics, spironolactone and sodium bicarbonate). For all subgroups, Pinteraction > 0.1.
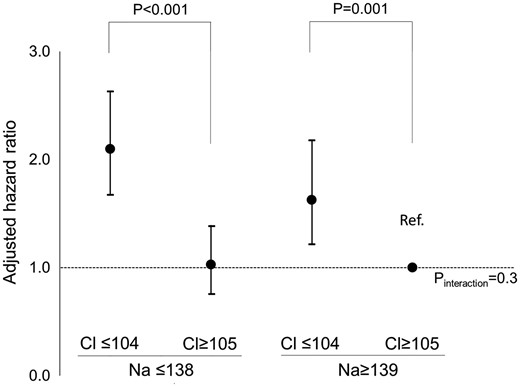
Low chloride (Cl) associates the elevated risk regardless of serum sodium (Na) levels. Low Cl, −104 mEq/L; high Cl, 105− mEq/L; low Na −138 meq/L; high Na 139− mEq/L. Model is adjusted for age, sex, body mass index, systolic blood pressure, diabetes mellitus, past hospitalizations due to cardiovascular diseases, estimated glomerular filtration rate, hemoglobin, albumin, calcium, phosphate, and medication dose (loop and thiazide diuretics, spironolactone, and sodium bicarbonate).
We performed two additional analyses. First, when the outcome was restricted to all-cause deaths and hospitalizations due to congestive heart failure alone, the risk remained significantly elevated among patients in the first Cl quartile, compared with the third Cl quartile (Supplementary data, Table S2). Second, the multivariable model was further adjusted for LVEF. A total of 1475 (55.4%) patients underwent echocardiography during the study period. LVEF did not substantially differ across Cl quintiles [the median (Q1, Q3) values in the first to fourth Cl quintiles were 65 (56, 71), 66 (61, 72), 66 (59, 71) and 66 (59, 71), respectively]. The first Cl quartile exhibited an increased risk of all-cause death and cardiovascular hospitalizations, compared with the third Cl quartile, after including LVEF in multivariable model 4 (adjusted HR 2.32; 95% CI 1.25–4.32; P = 0.008). The result was largely unchanged when the analysis was conducted among only patients with normal EF (>60%) (adjusted HR 3.17; 95% CI 1.37–7.34; P = 0.007).
In reclassification analysis, both Cl and Na improved the prediction of the outcome (Table 4). However, adding serum Na levels to the multivariable model including serum Cl levels improved neither NRI nor IDI. In contrast, adding serum Cl levels to the multivariable model including serum Na levels significantly improved the risk prediction assessed by NRI and IDI. The C-statistic of the multivariable model without Cl and Na was 0.719 (95% CI 0.668–0.769). The magnitude of improvement in the C-statistic after the addition of Cl was greater than after the addition of Na, although it did not reach statistical significance [0.736 (95% CI 0.685–0.786) for Cl, P = 0.09; and 0.726 (95% CI 0.676–0.776) for Na, P = 0.25].
Incremental prognostic value of serum levels of chloride and sodium
| Model | NRI | P | IDI | P |
|---|---|---|---|---|
| Multivariable model without sodium and chloride | ||||
| add sodium | 0.254 | 0.01 | 0.0054 | 0.1 |
| add chloride | 0.325 | 0.001 | 0.0165 | 0.006 |
| Multivariable model with sodium | ||||
| add chloride | 0.335 | 0.001 | 0.0113 | 0.01 |
| Multivariate model with chloride | ||||
| add sodium | 0.200 | 0.06 | 0.0002 | 0.7 |
Multivariate model included age, sex, body mass index, systolic blood pressure, diabetes mellitus, past hospitalizations due to cardiovascular diseases, estimated glomerular filtration rate, hemoglobin, albumin, calcium, phosphate, bicarbonate levels and medication dose (loop and thiazide diuretics, spironolactone).
Serum Cl levels were not significantly associated with the risk of progression to end-stage kidney disease (adjusted HR for first versus third Cl quartile: 0.80; 95% CI 0.51–1.27; P = 0.3). The result was similar when serum Cl levels were treated as a continuous variable.
DISCUSSION
Although serum Cl levels are routinely measured in daily clinical practice of patients with CKD, the implication of hypochloremia, unlike that of hyponatremia, has not been fully studied. The previous cohort study that found a significant association between lower Cl and the elevated risk of death and cardiovascular events in CKD did not address several important confounders especially regarding acid–base disturbances [22]. In the present study, we validated this significant association in a much larger sample size with adjustment for the essential covariates such as bicarbonate levels, anion gap, and use of diuretics and sodium bicarbonate. Furthermore, we used time-varying serum Cl levels thus accounting for its variation over the course of CKD progression. The result was maintained even among patients without hyponatremia. Notably, the prognostic predictability of Cl outperformed that of Na, as shown in the improvement of NRI and IDI by Cl over the multivariable model including Na. These findings highlight that, while the link between hyponatremia and poor outcomes has been focused on to date, we should now recognize the predictive superiority of Cl to Na and pay more attention to Cl in the clinical management of patients with CKD.
The previous study showed a J-shaped association of serum Cl levels with mortality and cardiovascular events [22]. In contrast, we found that the risk was monotonically decreased with increasing serum Cl levels. This discrepancy might be partly because bicarbonate levels were adjusted in our multivariable model but not in the previous study. The unadjusted HR in the fourth Cl quartile was actually elevated in our study as well, but the adjusted HR became lower than 1.0 after adjusting for bicarbonate levels. Therefore, it seems likely that low bicarbonate levels, which was associated with poor prognosis (Supplementary data, Figure S1), partly confounded the apparent relationship between high Cl and the elevated risk.
Dissociation between serum Cl and Na levels is assumed to occur when negatively charged substances are increased in the circulation. In fact, we found that patients with higher serum albumin, bicarbonate, anion gap and phosphate were more likely to have low Cl despite normal to high Na (Table 2). Since higher serum albumin, bicarbonate and phosphate were not significantly associated with an increased risk of the outcome in our study (Supplementary data, Figure S1), these three factors would not explain the better prognostic predictability of Cl compared with Na. On the other hand, higher anion gap was linked to the elevated risk (Supplementary data, Figure S1), thereby possibly rendering Cl a superior prognostic marker to Na. However, since we performed multivariable adjustment for time-varying anion gap, the prognostic impact of low Cl could be independent of that of anion gap.
Cl has several distinct physiological roles that are independent of Na. One of the most important ones is its involvement in fluid homeostasis. For example, tubuloglomerular feedback is controlled by intratubular Cl concentrations [15, 16]. Animal studies have demonstrated that Cl, but not Na, in the tubular fluid suppresses plasma renin activity through direct action on the macular densa [16]. In recent experimental studies, With-No-Lysine (WNK) 1 and WNK4, both of which regulate the activity of Na-Cl cotransporter (NCC) at the distal tubules, were shown to be under direct regulation of Cl [17, 18]. WNK3 regulates the sodium–potassium–chloride co-transporter (NKCC2) at the loop of Henle, the target of loop diuretics, by sensing intracellular Cl [19]. Clinically, lower serum Cl levels are related to poorer loop diuretic responsiveness and impaired decongestion, while Cl supplementation is suggested to improve fluid management of heart failure patients [20, 21]. Besides the involvement in fluid homeostasis, hypochloremia was shown to be associated with lower cardiac output in a cross-sectional study of patients with severe heart failure [29]. Therefore, Cl plays a role in regulating volume status and thus might be related to pathological conditions such as congestive heart failure. Indeed, a growing number of cohort studies among patients with heart failure have reported that hypochloremia, rather than hyponatremia, is associated with worse clinical outcomes [12, 13, 30–32]. Taken together, Cl is not only a useful prognostic marker but might be an important therapeutic target in CKD patients, especially those with heart failure.
The limitations of our study include its observational study design, which precludes causal inference between Cl and prognosis of CKD patients. Although we extensively adjusted for relevant clinical factors, there may be residual confounding and unmeasured confounders. In particular, we did not have information about the volume status and severity of underlying heart diseases. Information about hospitalizations outside our hospital was not available in our database; thus, it was not included in the survival analyses. Our database contained a considerable number of missing values for bicarbonate levels. However, the result was not substantially altered when the missing values were imputed by multiple imputation. Given that this study was conducted in a single nephrology center, the external validity should be further confirmed.
In conclusion, we found that lower serum Cl levels are associated with an increased risk of death and cardiovascular events among patients with CKD. This association was independent of Na, bicarbonate, anion gap, and use of diuretics and sodium bicarbonate. Because Cl had better prognostic predictability than Na, we need to pay more attention to hypochloremia in the management of CKD patients, even when serum Na levels are within the normal range. Future interventional studies are required to investigate whether increasing Cl levels is useful to improve the prognosis of CKD patients.
AUTHORS’ CONTRIBUTIONS
Research idea and study design: K.K., Y.S., T.H., T.O., S.Y., K.S., A.M., N.H., D.M., I.M. and Y.I.; data acquisition and analysis: K.K.; supervision: T.H. and Y.I.; draft writing: K.K. and Y.S.; and revision of the manuscript: T.H., T.O., S.Y., A.M., N.H., D.M., I.M. and Y.I.. Each author contributed important intellectual content during manuscript drafting or revision and accepts accountability for the overall work by ensuring that questions pertaining to the accuracy or integrity of any portion of the work are appropriately investigated and resolved.
CONFLICT OF INTEREST STATEMENT
None declared.


Comments