


Abstract
Mycophenolic acid (MPA) is widely utilized as an immunosuppressant in kidney and liver transplantation, with reports suggesting an independent relationship between MPA concentrations and adverse allograft outcome. Proton-pump inhibitors (PPIs) may have variable effects on the absorption of different MPA formulations leading to differences in MPA exposure.
A multicentre, randomized, prospective, double-blind placebo-controlled cross-over study was conducted to determine the effect of the PPI pantoprazole on the MPA and its metabolite MPA-glucuronide (MPA-G) area under the curve (AUC) >12 h (MPA-AUC12 h) in recipients maintained on mycophenolate mofetil (MMF) or enteric-coated mycophenolate sodium (EC-MPS). We planned a priori to examine separately recipients maintained on MMF and EC-MPS for each pharmacokinetic parameter. The trial (and protocol) was registered with the Australian New Zealand Clinical Trials Registry on 24 March 2011, with the registration number of ACTRN12611000316909 (‘IMPACT’ study).
Of the 45 recipients screened, 40 (19 MMF and 21 EC-MPS) were randomized. The mean (standard deviation) recipient age was 58 (11) years with a median (interquartile range) time post-transplant of 43 (20–132) months. For recipients on MMF, there was a significant reduction in the MPA-AUC12 h [geometric mean (95% confidence interval) placebo: 53.9 (44.0–65.9) mg*h/L versus pantoprazole: 43.8 (35.6–53.4) mg*h/L; P = 0.004] when pantoprazole was co-administered compared with placebo. In contrast, co-administration with pantoprazole significantly increased MPA-AUC12 h [placebo: 36.1 (26.5–49.2) mg*h/L versus pantoprazole: 45.9 (35.5–59.3) mg*h/L; P = 0.023] in those receiving EC-MPS. Pantoprazole had no effect on the pharmacokinetic profiles of MPA-G for either group.
The co-administration of pantoprazole substantially reduced the bioavailability of MPA in patients maintained on MMF and had the opposite effect in patients maintained on EC-MPS, and therefore, clinicians should be cognizant of this drug interaction when prescribing the different MPA formulations.
What is already known about this subject?
• Proton-pump inhibitors (PPIs) could reduce the systemic exposure of mycophenolic acid (MPA) for patients maintained on mycophenolate mofetil (MMF) formulation but not in those maintained on enteric-coated salt form mycophenolate sodium (EC-MPS), but this drug–drug interaction has not been confirmed in adequately powered randomized controlled trial in solid organ transplant recipients.
What this study adds?
• This randomized placebo-controlled cross-over study showed that the co-administration of pantoprazole substantially reduced the bioavailability of MPA in kidney and liver transplant recipients maintained on MMF and had the opposite effect in patients maintained on EC-MPS.
What impact this may have on practice or policy?
• Clinicians should be cognizant of this drug interaction when prescribing PPIs with MMF or EC-MPS, but the longer term clinical effect of this drug–drug interaction in kidney and liver transplant recipients remains unknown.
INTRODUCTION
Mycophenolic acid (MPA) is available as the ester pro-drug mycophenolate mofetil (MMF, Cellcept®) or as the enteric-coated salt form mycophenolate sodium (EC-MPS, Myfortic®). Immunosuppressive regimens containing MPA are widely utilized in kidney and liver transplantation to reduce rejection rates and improve allograft survival [1]. There has been considerable interest in individualizing MMF or EC-MPS dosing according to therapeutic drug monitoring (TDM) to reduce adverse events associated with these drugs while improving clinical outcomes. The APOMYGRE and OPTICEPT trials suggest that adjustment of MMF dosing according to therapeutic MPA monitoring could reduce the risk of treatment failure, including rejection, but the impact of MPA monitoring on longer term allograft outcome remains unclear [2–5]. Consequently, MPA TDM has not been widely adopted into clinical practice among transplanting centres.
Peptic ulcer disease is a common complication following kidney and liver transplantation and therefore prophylactic proton-pump inhibitors (PPIs) are often prescribed in these patients to reduce the risk of symptomatic peptic ulcer or gastro-oesophageal reflux disease [6]. It has been shown that by increasing gastric pH and thus reducing the solubility of MMF in the gut, PPIs could reduce the systemic exposure of MPA for patients on MMF but not EC-MPS [7–9]. This effect may lead to inadequate immunosuppression with an increased risk of rejection. This important effect of PPIs on MPA pharmacokinetics following MMF or EC-MPS administration remains poorly recognized and should be taken into consideration with regard to appropriate dosing of MMF and EC-MPS in kidney and liver transplant recipients. In a single-dose cross-over study of 12 healthy volunteers, the concomitant administration of pantoprazole significantly reduced MPA exposure following MMF treatment (dose 1 g daily), which was not evident following EC-MPS (720 mg daily) treatment [10]. In stable kidney and liver transplant recipients, we aimed to compare the effects of a PPI versus placebo on MPA exposure in those maintained on MMF or EC-MPS.
MATERIALS AND METHODS
This was a multicentre, randomized, prospective, double-blinded, placebo-controlled, cross-over study to assess the effect of gastric acid suppression (PPI pantoprazole) on the pharmacokinetics of MPA in kidney or liver transplant recipients maintained on MMF or EC-MPS. This trial was conducted in two transplanting centres in Australia (Sir Charles Gairdner Hospital, Perth; Royal Adelaide Hospital (RAH), Adelaide]. Local institutional ethics committees at each site approved the study and written consents were obtained from participants prior to randomization. The trial (and protocol) was registered with the Australian New Zealand Clinical Trials Registry on 24 March 2011, with the registration number of ACTRN12611000316909 (‘IMPACT’ study).
Study population
The target population comprised stable adult (>18 years) kidney and liver transplant recipients who were ≥6 months post-transplant. Recipients were maintained on MMF (≥1 g daily) or EC-MPS (≥1080 mg daily) in two equally divided doses. If recipients were maintained on unequal twice daily dosing, then they agreed to alter to two equally divided dose for 2 weeks prior to trial enrolment. Other inclusion criteria for the trial were recipients who were willing to change to pantoprazole (from other PPI or H2-blocker) or willing to start pantoprazole if not already on this drug, maintained on a stable dose of calcineurin inhibitor (CNI; cyclosporine or tacrolimus) and were capable of providing written informed consent. Exclusion criteria included recipients maintained on non-CNI agents except corticosteroids; recent change (<2 weeks) in the total dose of corticosteroids, CNI, MMF or EC-MPS; recent acute rejection (defined as biopsy-proven acute rejection episode requiring intervention within 1 month prior to randomization); Modification of Diet in Renal Disease Study-derived estimated glomerular filtration rate (eGFR) of <20 mL/min/1.73 m2; and significant peptic ulcer disease or ulcerative esophagitis (based on medical history) where withdrawal of acid suppression therapy is not clinically appropriate, and concurrent use of magnesium- or aluminium-based antacid or cholestyramine.
Study design
For recipients who were maintained on PPI and/or H2-blocker, this was ceased 14 days prior to randomization. Recipients were given two packets of study medications clearly labelled Pack A and B. Recipients were advised to commence study medication from Pack A (containing either placebo or pantoprazole, one tablet daily for 7 days; Days 1–7) and then admitted on the morning of the first pharmacokinetic study (Day 8). The previous dose of MMF or EC-MPS was taken 12 h prior to the first blood sample (Time 0). Following the initial venous blood sampling, the recipients took the morning dose of MMF or EC-MPS, along with the CNI and other usual medications as prescribed. Venous blood samplings occurred at time point 0, and then 0.5, 1, 1.5, 2, 3, 4, 5, 6, 8, 10 and 12 h post MMF or EC-MPS dose. The blood samples were centrifuged and plasma separated and stored at −70°C until analysis. Following the completion of the first visit, the recipients were advised to continue on the usual medications for the next 7 days without any study medications (washout period; Days 8–14). On Day 15, the recipients were advised to commence study medication from Pack B (containing either placebo or pantoprazole, one tablet daily for 7 days; Days 15–21), and then re-admitted on Day 22 for the second pharmacokinetic study. A telephone call reminder was scheduled at Day 14 and a compliance check of study medication was undertaken at each pharmacokinetic study visit.
Study drug
The study medications of pantoprazole (40 mg) and matching placebo were prepared by Pharmaceutical Packaging Professionals (Victoria, Australia) on the advice of the clinical pharmacologist from RAH. The pantoprazole (commercial product) pills were de-blistered and placed into an empty gelatine capsule and then filled with lactose or other inert filler to disguise their content. The placebo was made by encapsulating lactose in an identical soft gelatine capsule. Both capsules were indistinguishable visually or by smell from the matching placebo, and dissolved completely once ingested. The trial pharmacists at the RAH prepared two packs labelled Packs A and B, with each pack containing seven tablets of pantoprazole or matching placebo, with packs shipped to Perth. The package of either study medication into Pack A or B was random, undertaken by the trial pharmacist of RAH. The selection of the package of either study medication for each recipient was undertaken by the trial pharmacy team of each site independent of the study according to a pre-specified allocation sequence. The study investigators, study coordinators and recipients were blinded to the study medications. There were 56 study medication packs prepared, with each pack containing Packs A and B (16 packs were unused/expired and discarded). These packs were block randomized for the two sites and for liver and kidney transplant recipients.
Clinical endpoints
The primary endpoint of this study was the pharmacokinetic profile of MPA and MPA-glucuronide (MPA-G) when co-administered with placebo or pantoprazole, expressed as MPA-area under the curve (AUC) and MPA-G AUC >12 h (MPA-AUC12 h and MPAG-AUC12 h, respectively), maximum concentration (Cmax) and time to Cmax (Tmax). Dose-normalized AUC12 h and Cmax for MPA and MPA-G were calculated for a 2 g daily dose of MMF or 1440 mg daily dose of EC-MPS. Secondary endpoints included any biopsy-proven acute rejection, allograft failure and adverse events (as assessed by site investigators) during and for 2 weeks following the completion of the study.
Measurements of MPA and MPA-G
Plasma was analysed for MPA and MPA-G using a validated high-performance liquid chromatography-ultraviolet-based method detection assay [11]. The area under the plasma MPA and MPA-G concentration–time curves (i.e. AUC) to the last quantifiable concentration (AUCt) were calculated using the log-trapezoidal rule. All assays were performed in a laboratory accredited by the National Association of Testing Authorities, Australia (The Queen Elizabeth Hospital, Adelaide, Australia) that subscribes to an external quality assurance programme for MPA. The intra-assay precision and accuracy for MPA were estimated at calibrator concentrations at 0.5 and 20 mg/L and for MPA-G at calibrator concentrations of 5 and 200 mg/L. Inter-assay precision and accuracy of quality control samples were determined for MPA at 2 and 15 mg/L and for MPA-G at 20 and 150 mg/L. Coefficients of variation were <5.0% and biases were <14.0% for each concentration of each analyte.
Sample size calculation
The sample size calculation was derived from the randomized cross-over study in healthy volunteers by Rupprecht et al. [10], where 12 healthy subjects were sufficient to detect a significant difference between MPA AUC12 h following self-administration of MMF with and without pantoprazole (MMF 40.0 ± 7.8 versus MMF + pantoprazole 29.3 ± 7.4 mg*h/L; P < 0.001). Given the effect size (of ≥25% reduction of MPA-AUC12 h) and the potential greater variability observed in this study, a sample size of 15 recipients maintained on MMF would be sufficient to detect a significant difference in MPA-AUC12 h of ≥25% with and without pantoprazole. A similar number will be recruited for recipients maintained on EC-MPS. We planned to recruit 42 recipients (similar proportion of recipients maintained on MMF and EC-MPS), assuming a drop-out rate of up to 30%.
Statistical analysis
Data were expressed as number (percentage), mean [standard deviation (SD)] and median [interquartile range (IQR)] for categorical, normally distributed and non-normally distributed continuous variables, respectively, stratified by the study groups. We planned a priori to examine separately recipients maintained on MMF and EC-MPS, and between the subgroups of CNI types (cyclosporin and tacrolimus) for each pharmacokinetic parameter. For MPA and MPA-G (±dose-normalized) AUC12 h, Cmax and Tmax, the geometric means and 95% confidence intervals (CIs) were derived, with Wilcoxon signed-rank test used to test the difference between placebo versus pantoprazole for each pharmacokinetic parameter within each study group of MMF and EC-MPS. The proportions of recipients in each study group with MPA-AUC12 h with thresholds of >30, >40, >50 and >60 mg*h/L were determined, given the MPA-AUC12 h threshold of 30–60 mg*h/L has been shown to be associated with lower risk of acute rejection [2, 5, 12–14]. Two sensitivity analyses were undertaken: (i) excluding one liver transplant recipient (for the MMF group) and (ii) stratified by entry eGFR thresholds of ≤60 and >60 mL/min/1.73 m2. All analyses were undertaken using Stata version 15.1 (StataCorp LP, College Station, TX, USA), with P < 0.05 considered statistically significant.
RESULTS
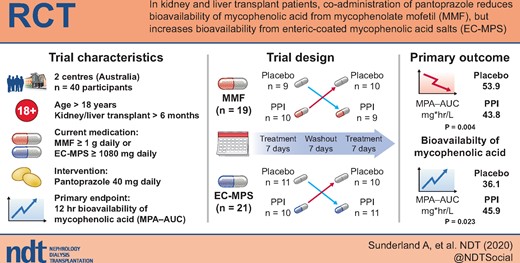
Forty-five liver and kidney transplant recipients were consented and 41 underwent randomization (four screen failures prior to randomization) between December 2011 and August 2017. One recipient withdrew consent after randomization, resulting in 40 recipients completing the study (39 kidney and 1 liver transplant recipients). We were unable to recruit additional liver transplant recipients over the 5-year period and therefore had continued to recruit kidney transplant recipients until the target study sample size was reached. The CONSORT flow diagram for this trial is shown in Figure 1.
The CONSORT flow diagram and trial design of the ‘IMPACT’ trial. Of 40 recipients who were randomized and had completed the trial, 19 were maintained on MMF and 21 were maintained on EC-MPS (Myfortic®). Recipients were randomized to the study medication (i.e. placebo or PPI 40 mg of pantoprazole daily) for 7 days, followed by a wash-out period of 7 days and then the alternative study medication for 7 days. Two 12-h pharmacokinetic profiles were undertaken at the completion of each study medication.
Of the 40 recipients, 19 (47.5%) and 21 (52.5%) were maintained on MMF and EC-MPS, respectively. Six (31.6%) recipients were maintained on 2 g daily of MMF, and 11 (52.4%) recipients were maintained on 1440 mg daily of EC-MPS at time of randomization. Recipients maintained on EC-MPS were younger and were more likely to be recent transplant recipients compared with those on MMF. Mean eGFR was 57 mL/min/1.73 m2 for recipients maintained on MMF compared with 62 mL/min/1.73 m2 for recipients maintained on EC-MPS. Of the 19 recipients who were prescribed PPI prior to enrolment, prior clinical symptom of gastro-oesophageal reflux disease was the main indication for treatment. However, the ascertainment of the diagnosis or results of prior gastroscopy were not collected. Of recipients maintained on MMF, 58% were prescribed tacrolimus, whereas 71% of those on EC-MPS were prescribed tacrolimus. The median doses of CNI, MMF, EC-MPS and prednisolone for MMF and EC-MPS groups are shown in Table 1.
Baseline characteristics of study participants
| Baseline characteristics of study cohort | MMF (n = 19) | EC-MPS (n = 21) | Total (n = 40) |
|---|---|---|---|
| Age, mean (SD) | 61.1 (28.9) | 55.8 (12.3) | 58.3 (11.0) |
| Gender | |||
| Male | 10 (52.6) | 17 (81.0) | 27 (67.5) |
| Female | 9 (47.4) | 4 (19.0) | 13 (32.5) |
| Weight, mean (SD), kg | 79.9 (17.2) | 92.1 (20.0) | 86.1 (19.5) |
| Post-transplant, median (IQR), months | 92 (37–185) | 23 (15.5–51.0) | 43.0 (20.5–131.7) |
| Transplant type | |||
| Kidney | 18 (94.7) | 21 (100.0) | 39 (97.5) |
| Liver | 1 (5.3) | 0 (0.0) | 1 (2.5) |
| Allograft function at randomization | |||
| Creatinine, mean (SD), μmol/L | 120.1 (42.4) | 122.2 (45.3) | 121.2 (43.4) |
| eGFR, mean (SD), mL/min/1.73 m2 | 56.7 (23.9) | 61.7 (24.5) | 59.3 (24.0) |
| Year of transplant | |||
| 1980–89 | 1 (5.3) | 0 (0.0) | 1 (2.5) |
| 1990–99 | 5 (26.3) | 1 (4.8) | 6 (15.0) |
| 2000–09 | 8 (42.1) | 4 (19.0) | 12 (30.0) |
| 2010+ | 5 (26.3) | 16 (76.2) | 21 (52.5) |
| Hospital | |||
| Sir Charles Gairdner Hospital | 10 (52.6) | 17 (81.0) | 27 (67.5) |
| RAH | 9 (47.4) | 4 (19.0) | 13 (32.5) |
| Prior PPI | 7 (36.8) | 12 (57.1) | 19 (47.5) |
| CNI type (total daily dose) | |||
| Cyclosporin | 8 (42.1) | 6 (28.6) | 14 (35.0) |
| Dose, median (IQR), mg | 150 (112–200) | 200 (150–200) | 171.4 (42.6) |
| Tacrolimus | 11 (57.9) | 15 (71.4) | 26 (65.0) |
| Dose, median (IQR), mg | 3 (2–4) | 4 (2–7) | 4.2 (3.3) |
| MPA (total daily dose) | |||
| MMF, median (IQR), mg | 1500 (1000–2000) | – | – |
| EC-MPS, median (IQR), mg | – | 1440 (1080–1440) | – |
| Prednisolone (total daily dose) | |||
| Dose, median (IQR), mg | 5 (0–5) | 5 (5–6) | 5.7 (1.3) |
| Randomized drug | |||
| First drug placebo | 9 (47.4) | 11 (52.3) | 20 (50.0) |
| First drug pantoprazole | 10 (52.6) | 10 (47.7) | 20 (50.0) |
Data are expressed as n (%), mean and SD or as median (IQR).
Pharmacokinetics of MPA and MPA-G
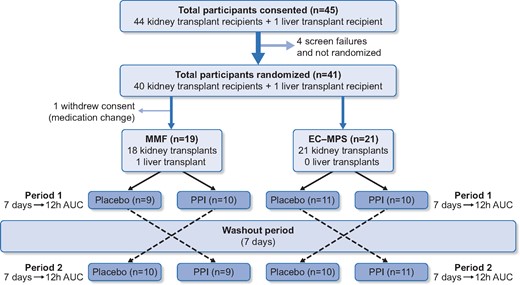
Table 2 shows the geometric means and 95% CI of MPA and MPA-G concentrations for recipients maintained on MMF and EC-MPS, co-administered with placebo compared with pantoprazole. For recipients maintained on MMF, MPA-AUC12 h and Cmax and dose-normalized MPA-AUC12 h and Cmax were significantly lower with pantoprazole compared with placebo. There were no significant changes for Tmax or for all parameters for MPA-G with pantoprazole or placebo in both groups. For recipients maintained on EC-MPS, MPA-AUC12 h and dose-normalized MPA-AUC12 h were significantly increased by ≥25% with pantoprazole compared with placebo. There were no significant changes for Cmax, Tmax or for all parameters for MPA-G. The concentration–time profiles for MPA of recipients maintained on MMF or EC-MPS ± pantoprazole/placebo are shown in Figure 2A and B, respectively.
![Plasma MPA concentration–time profiles (geometric means and 95% CI) of recipients maintained on MMF (A) and EC-MPS [Myfortic®, (B)]. Co-administration of pantoprazole significantly reduced MPA exposure in recipients maintained on MMF, whereas the MPA exposure was significantly increased in recipients maintained on EC-MPS.](https://oup.silverchair-cdn.com/oup/backfile/Content_public/Journal/ndt/35/6/10.1093_ndt_gfaa111/2/m_gfaa111f2.jpeg?Expires=1750184178&Signature=wg14ndrgeL0cODA4kNj3qSM6bCtc0wOixj9niT~Ihp4UeSsS8m59ch7qBYtI7vKVCpFMDmav-rBl7Mh0rrMtmXtQXim0MxtF6kKf2~TT9SQ2--szptThdA3PlWljs9mU0exBzNGeLkYEQmO3mKtYFPuahQKw8DwH~AIA~2vpD2sIXce68J0Jg4i1pi0ZkX5sxa~W4dzBt13dMoPP6oLVWjXrFwl8Yqt3DKqIHBGUCO6kgn-uScs0rzzrD8yVCXiUdHRFVfFbEunioG8m1xm9zt~tfiMiz4tAPiXq9uPIM~8RLctsDQKg7nhOFbDbhGchARX53naCq1sS5exyFTKS3w__&Key-Pair-Id=APKAIE5G5CRDK6RD3PGA)
Plasma MPA concentration–time profiles (geometric means and 95% CI) of recipients maintained on MMF (A) and EC-MPS [Myfortic®, (B)]. Co-administration of pantoprazole significantly reduced MPA exposure in recipients maintained on MMF, whereas the MPA exposure was significantly increased in recipients maintained on EC-MPS.
Pharmacokinetic parameters of MPA and MPA-G with concomitant placebo versus pantoprazole in kidney and liver transplant recipients maintained on MMF or EC-MPS
| Pharmacokinetic parameters (MMF and EC-MPS) | Intervention | Geometric means (95% CI) | P-value |
|---|---|---|---|
| MMF: MPA | |||
| AUC12 h, mg*h/L | Placebo | 53.9 (44.0–65.9) | 0.004 |
| Pantoprazole | 43.6 (35.6–53.4) | ||
| Dose-normalized AUC12 h, mg*h/La | Placebo | 76.0 (59.1–97.8) | 0.005 |
| Pantoprazole | 61.6 (47.0–80.7) | ||
| Cmax, mg/L | Placebo | 16.1 (12.6–20.6) | 0.002 |
| Pantoprazole | 10.7 (8.5–13.6) | ||
| Dose-normalized Cmax, mg/La | Placebo | 22.8 (18.3–28.3) | 0.002 |
| Pantoprazole | 15.2 (11.6–19.8) | ||
| Tmax, h | Placebo | 1.0 (0.5–2.7) | 0.422 |
| Pantoprazole | 1.2 (0.8–1.6) | ||
| MMF: MPA-G | |||
| AUC12 h, mg*h/L | Placebo | 845.2 (678.2–1053.2) | 0.856 |
| Pantoprazole | 825.8 (658.4–1035.8) | ||
| Dose-normalized AUC12 h, mg*h/La | Placebo | 1193.9 (955.7–1491.4) | 0.747 |
| Pantoprazole | 1166.5 (920.2–1479.9) | ||
| Cmax, mg/L | Placebo | 99.5 (83.1–119.2) | 0.573 |
| Pantoprazole | 94.4 (77.8–114.6) | ||
| Dose-normalized Cmax, mg/La | Placebo | 140.6 (119.0–166.1) | 0.629 |
| Pantoprazole | 133.4 (108.7–163.7) | ||
| Tmax, h | Placebo | 2.2 (1.4–3.3) | 0.639 |
| Pantoprazole | 2.3 (1.6–3.3) | ||
| EC-MPS: MPA | |||
| AUC12 h, mg*h/L | Placebo | 36.1 (26.5–49.2) | 0.016 |
| Pantoprazole | 45.9 (35.5–59.3) | ||
| Dose-normalized AUC12 h (mg*h/L)b | Placebo | 41.3 (29.7–57.5) | 0.023 |
| Pantoprazole | 52.6 (39.9–69.3) | ||
| Cmax, mg/L | Placebo | 8.5 (5.5–13.2) | 0.211 |
| Pantoprazole | 11.9 (8.4–16.9) | ||
| Dose-normalized Cmax, mg/Lb | Placebo | 9.8 (6.2–15.4) | 0.217 |
| Pantoprazole | 13.7 (9.5–19.6) | ||
| Tmax, h | Placebo | 3.1 (2.4–4.1) | 0.577 |
| Pantoprazole | 3.9 (2.7–5.4) | ||
| EC-MPS: MPA-G | |||
| AUC12 h, mg*h/L | Placebo | 714.2 (559.2–912.1) | 0.274 |
| Pantoprazole | 744.6 (571.4–970.4) | ||
| Dose-normalized AUC12 h, mg*h/Lb | Placebo | 818.0 (630.1–1062.0) | 0.339 |
| Pantoprazole | 852.9 (655.8–1109.3) | ||
| Cmax, mg/L | Placebo | 84.5 (68.6–104.3) | 0.159 |
| Pantoprazole | 87.6 (68.8–111.7) | ||
| Dose-normalized Cmax, mg/Lb | Placebo | 96.8 (76.8–121.9) | 0.192 |
| Pantoprazole | 100.4 (78.6–128.2) | ||
| Tmax, h | Placebo | 2.6 (1.8–3.7) | 0.180 |
| Pantoprazole | 4.3 (3.3–5.7) | ||
Data are expressed as geometric means and 95% CIs, with Wilcoxon signed-rank test used to test the difference between placebo versus pantoprazole for each pharmacokinetic parameter. AUC12 h, AUC >12 h, Cmax, peak concentration; Tmax, time to peak concentration.
Dose-normalized to 2 g daily (in two equally divided doses) of MMF.
Dose-normalized to 1440 mg daily (in two equally divided doses) of EC-MPA.
Table 3 shows the proportion of recipients maintained on MMF or EC-MPS with MPA-AUC12 h of pre-specified thresholds. Almost 90% of recipients maintained on MMF had MPA-AUC12 h of >30 mg*h/L, reducing to 68% with pantoprazole. For recipients maintained on EC-MPS, 76% had MPA-AUC12 h of >30 mg*h/L, increasing to 81% with pantoprazole.
MPA-AUC thresholds in kidney and liver transplant recipients maintained on mycophenolate or EC-MPS with and without pantoprazole
| MPA-AUC12 h thresholds, mg*h/L | MMF (n = 19) | MMF + pantoprazole (n = 19) | EC-MPS (n = 21) | EC-MPS + pantoprazole (n = 21) |
|---|---|---|---|---|
| >30 | 17 (89.5) | 13 (68.4) | 16 (76.2) | 17 (81.0) |
| >40 | 15 (78.9) | 10 (52.6) | 10 (47.6) | 14 (66.7) |
| >50 | 11 (57.9) | 8 (42.1) | 5 (23.8) | 10 (47.6) |
| >60 | 10 (52.6) | 7 (36.8) | 4 (19.0) | 9 (42.9) |
Data are expressed as n (%).
Cyclosporin and tacrolimus: pharmacokinetics of MPA and MPA-G
Table 4 shows the geometric means and 95% CI of MPA-AUC12 h and Cmax concentrations for recipients maintained on MMF and EC-MPS ± placebo/pantoprazole and stratified by CNI type. For recipients maintained on MMF and cyclosporin, MPA-AUC12 h and Cmax and dose-normalized MPA-AUC12 h and Cmax were reduced by at least 20 and 30%, respectively, with pantoprazole compared with placebo. For recipients maintained on MMF and tacrolimus, MPA-AUC12 h and Cmax and dose-normalized MPA-AUC12 h and Cmax were significantly reduced by at least 15 and 30%, respectively, with pantoprazole. For recipients maintained on EC-MPS and either cyclosporin or tacrolimus, there were no significant changes in MPA-AUC12 h and Cmax with and without pantoprazole. There were no significant differences in MPA-G12 h for recipients maintained on MMF or EC-MPS and either tacrolimus or cyclosporin ± pantoprazole. Figure 3A and B shows the respective boxplots of MPA-AUC12 h and Cmax of recipients maintained on MMF and EC-MPS, with placebo or pantoprazole and stratified by CNI type.
![Boxplots [showing the median, IQR, minimum and maximum and outliers (represented by solid circle)] of MPA AUC >12 h [MPA-AUC12 h; (A)] and Cmax (B) for recipients maintained on either MMF or EC-MPS (Myfortic®), stratified by CNI types (cyclosporin and tacrolimus), with co-administration with placebo (blue bars) or pantoprazole (red bars).](https://oup.silverchair-cdn.com/oup/backfile/Content_public/Journal/ndt/35/6/10.1093_ndt_gfaa111/2/m_gfaa111f3.jpeg?Expires=1750184178&Signature=UHZb-MOP-gtfKV4isDsbBgBWgjATc2yCmwXK9hYMNj6H4mTS4TpuDVNrQ42rdPbxhVUWgIeP0WSE53sM4vLu6gPINFDcQIvQUaunumjekrJp8KwOiHGbYJbUZ7NxnSVA3ScQmpONgct8jzMWZgXY5GkM3DfSMDkselIDnP~SlWWdcrZy-niFJkXF8OR6cPxj45l2ecBkXE2nCRjmN5kehne6pjyJ0PbN5ZAX6ziNGmRdki2MADwGZKEMfkGgTw9io2m3z0Thj04dHV0JMU4eK-e9RN62SFJCnzK~0tOZMECZU0PuChlf3KY~TazXAYR3xafTOg9CoWE9y6dybs7imQ__&Key-Pair-Id=APKAIE5G5CRDK6RD3PGA)
Boxplots [showing the median, IQR, minimum and maximum and outliers (represented by solid circle)] of MPA AUC >12 h [MPA-AUC12 h; (A)] and Cmax (B) for recipients maintained on either MMF or EC-MPS (Myfortic®), stratified by CNI types (cyclosporin and tacrolimus), with co-administration with placebo (blue bars) or pantoprazole (red bars).
Pharmacokinetic parameters of MPA with concomitant placebo versus pantoprazole in kidney and liver transplant recipients maintained on MMF or EC-MPS, stratified by calcineurin-inhibitor type (cyclosporin and tacrolimus)
| Pharmacokinetic parameters (MMF and EC-MPS) | Intervention | Geometric means (95% CI) | |
|---|---|---|---|
| Cyclosporin | Tacrolimus | ||
| MMF: MPA | |||
| AUC12 h, mg*h/L | Placebo | 48.1 (34.8–66.5) | 58.5 (43.5–78.6) |
| Pantoprazole | 36.9 (26.0–52.4) | 49.2 (37.6–64.3)* | |
| Dose-normalized AUC12 h, mg*h/La | Placebo | 59.3 (41.2–85.3) | 91.1 (64.2–129.4) |
| Pantoprazole | 45.5 (28.1–73.7) | 76.7 (56.5–104.3) * | |
| Cmax, mg/L | Placebo | 16.5 (11.5–23.7) | 15.9 (10.7–23.4) |
| Pantoprazole | 11.1 (6.8–17.9) | 10.5 (7.8–14.2)** | |
| Dose-normalized Cmax, mg/La | Placebo | 20.4 (14.1–29.5) | 24.7 (18.2–33.6) |
| Pantoprazole | 13.6 (7.2–25.9) | 16.4 (13.1–20.5)** | |
| EC-MPS: MPA | |||
| AUC12 h, mg*h/L | Placebo | 19.5 (11.3–33.8) | 46.2 (33.5–63.6) |
| Pantoprazole | 30.9 (18.6–51.4) | 53.8 (40.2–71.8) | |
| Dose-normalized AUC12 h, mg*h/Lb | Placebo | 20.5 (11.5–36.3) | 54.8 (39.5–75.9) |
| Pantoprazole | 32.4 (17.8–58.9) | 63.8 (47.8–85.1) | |
| Cmax, mg/L | Placebo | 3.5 (1.4–8.7) | 12.2 (8.0–18.5) |
| Pantoprazole | 9.0 (4.2–19.3) | 13.4 (8.7–20.5) | |
| Dose-normalized Cmax, mg/Lb | Placebo | 3.7 (1.5–9.1) | 14.4 (9.4–22.2) |
| Pantoprazole | 9.4 (4.2–21.2) | 15.9 (10.4–24.3) | |
Data are expressed as geometric means and 95% CIs, with Wilcoxon signed-rank test used to test the difference between placebo versus pantoprazole for each pharmacokinetic parameter.
Dose-normalized to 2 g daily (in two equally divided doses) of MMF.
Dose-normalized to 1440 mg daily (in two equally divided doses) of EC-MPA.
P < 0.05,
P < 0.01.
Adverse events
There were no serious adverse events during the study period, with no acute rejection, study drug discontinuation or modification of the immunosuppressive medications. A greater proportion of recipients maintained on MMF experienced adverse events (with placebo and pantoprazole) compared with those maintained on EC-MPS, and the majority of adverse events were mild non-specific symptoms (headache and/or mild gastro-intestinal symptoms). The proportion of recipients who had experienced reflux symptoms was similar for recipients maintained on placebo and pantoprazole, regardless of whether they were maintained on MMF or EC-MPS. There were no significant differences in serum haemoglobin, albumin or creatinine (and eGFR) between the two pharmacokinetic timepoints in either group of recipients maintained on MMF or EC-MPS. Table 5 shows the adverse events for recipients maintained on MMF and EC-MPS, stratified by placebo and pantoprazole.
Adverse events of the study population
| Adverse events of study cohort | MMF (n = 19) | EC-MPS (n = 21) | ||
|---|---|---|---|---|
| Adverse events | Placebo | Pantoprazole | Placebo | Pantoprazole |
| Any adverse events | 8 (42.1) | 7 (36.8) | 4 (19.0) | 2 (9.5) |
| Gastrointestinal | 4 (21.1) | 3 (15.6) | 2 (9.5) | 1 (4.8) |
| Reflux | 2 (10.5) | 2 (10.5) | 1 (4.8) | 1 (4.8) |
| Diarrhoea | 1 (5.3) | 1 (5.3) | 0 (0.0) | 0 (0.0) |
| Abdominal pain | 1 (5.3) | 1 (5.3) | 0 (0.0) | 1 (4.8) |
| Nausea/vomiting | 1 (5.3) | 1 (5.3) | 1 (4.8) | 0 (0.0) |
| Infection | 2 (10.5) | 3 (15.6) | 0 (0.0) | 0 (0.0) |
| Respiratory | 1 | 0 | 0 | 0 |
| Urinary tract | 0 | 2 | 0 | 0 |
| Others | 1 | 0 | 0 | 0 |
| Hospitalization | 0 (0.0) | 1 (5.3)b | 0 (0.0) | 0 (0.0) |
| Miscellaneous | 2 (10.5) | 1 (5.3) | 3 (14.3) | 0 (0.0) |
| Headache | 1 | 1 | 1 | 0 |
| Skin rash | 1 | 0 | 0 | 0 |
| Others | 0 | 0 | 2 | 0 |
| Haematology/biochemistrya | ||||
| Creatinine, μmol/L | 129 (80–154) | 127 (80–161) | 121 (91–138) | 114 (85–149) |
| eGFR, mL/min/1.73 m2 | 50 (38–85) | 49 (35–71) | 56 (47–75) | 54 (46–87) |
| White cell count (×109/L) | 6 (6–8) | 4 (4–7) | 7 (6–8) | 7 (6–9) |
| Haemoglobin, g/L | 130 (112–140) | 128 (115–141) | 138 (126–152) | 137 (123–152) |
| Albumin, g/L | 39 (38–42) | 40 (38–42) | 40 (38–43) | 41 (38–42) |
| Allograft outcomes | Placebo | Pantoprazole | Placebo | Pantoprazole |
| Acute rejection | 0 (0.0) | 0 (0.0) | 0 (0.0) | 0 (0.0) |
| Allograft failure | 0 (0.0) | 0 (0.0) | 0 (0.0) | 0 (0.0) |
| Death | 0 (0.0) | 0 (0.0) | 0 (0.0) | 0 (0.0) |
Data are expressed as n (%).
Expressed as median (IQR).
Hospitalization secondary to urinary tract infection and dehydration.
Sensitivity analysis
In the sensitivity analysis excluding the one liver transplant recipient (of recipients maintained on MMF), the geometric means (95% CI) of each pharmacokinetic parameter in the presence of placebo and pantoprazole had remained similar (Supplementary data, Table S1). When the study population was stratified according to eGFR thresholds of ≤60 and >60 mL/min/1.73 m2, the estimates for actual and dose-normalized MPA and MPA-G AUC12 h and Cmax were similar to the estimates from the main analysis for recipients maintained on MMF and EC-MPS, although statistically significant difference in the change between MPA-AUC12 h and/or Cmax in the presence of placebo versus pantoprazole was evident only for recipients with eGFR of ≤60 mL/min/1.73 m2. In recipients with eGFR of >60 mL/min/1.73 m2, the proportional change in MPA-AUC12 h and Cmax was not statistically significant but was similar to recipients with eGFR of ≤60 mL/min/1.73 m2 (Supplementary data, Table S2).
DISCUSSION
This randomized, double-blind placebo-controlled cross-over study showed an important interaction between pantoprazole and MPA formulations in stable kidney and liver transplant recipients maintained on CNI-based immunosuppression. Consistent with the known increase in gastric pH with the use of PPI, co-administration of pantoprazole reduced the bioavailability of MPA in patients maintained on MMF but had an enhanced effect on the MPA bioavailability in those maintained on EC-MPS.
The pharmacokinetic profiles of the two MPA formulations of MMF and EC-MPS are dissimilar, with the absorption requiring an acidic and neutral pH environment, respectively, before making active MPA available. As such, MPA concentrations peak relatively earlier, within 1–2 h, following MMF administration. In contrast, peak MPA concentrations occur between 2 and 4 h after EC-MPS [15–17]. Consequently, it has been shown that PPI, by suppressing gastric acid secretion will interfere with the absorption and reduce the total MPA exposure following MMF but not EC-MPS. In two randomized cross-over studies (not placebo-controlled) of healthy volunteers, concomitant PPI treatment (n = 12 omeprazole 20 mg twice daily and n = 12 pantoprazole 40 mg twice daily) significantly reduced the MPA and MPA-G AUC12 h and Cmax with MMF but not with EC-MPS [10, 18]. In both studies, the volunteers were exposed only to a single daily dose of MMF (1 g) and EC-MPS (720 mg). In a randomized 4 × 4 cross-over single-centre German study (2-week periods each of MMF, EC-MPS, EC-MPS/pantoprazole and MMF/pantoprazole) of 18 kidney transplant recipients maintained on cyclosporin-based regimen, there was at least a respective 10 and 20% reduction in MPA-AUC12 h and Cmax when MMF was co-administered with pantoprazole, but this was not statistically significant. Pantoprazole resulted in a significant earlier Tmax when co-administered with EC-MPS, but there was no effect on MPA-AUC12 h or Cmax [19]. Given the small number of recipients and the large inter-individual pharmacokinetic variability, the true effect of PPI on MPA exposure remains uncertain. Similarly, PPI-induced reduction in MPA exposure in 22 heart transplant recipients maintained on MMF has been reported [8], but a similar effect was not observed for heart or lung recipients maintained on EC-MPS (n = 21) [9]. Similarly, in a retrospective study of 61 kidney transplant recipients, lansoprazole reduced the MPA exposure in recipients maintained on MMF and tacrolimus, but this work left open the possibility that the drug–drug interaction may be dependent on the PPI type and cytochrome P450 and efflux transporter genetic polymorphisms (e.g. CYP2C19 and ABCB1 polymorphisms) [20]. Nevertheless, these studies were not randomized controlled trials and therefore the clinical significance of the study findings must be interpreted with caution. In our study, co-administration of pantoprazole with MMF significantly reduced the total MPA exposure (MPA-AUC12 h and Cmax), which was not observed in recipients maintained on EC-MPS. However, pantoprazole had no effect on MPA Tmax or the pharmacokinetic profile of MPA-G (which should reflect the total amount of absorbed MPA) in recipients maintained on MMF or EC-MPS, which may reflect the large inter-patient variability, potential differences polymorphisms of uridine 5′-diphospho-glucuronosyltransferase genes (enzymes involved in the metabolism of MPA), the pre-specified sampling points to calculate the pharmacokinetic profile may have missed the true Cmax, and the potential variability in the renal excretion and the entero-hepatic recycling of MPA-G [21, 22]. The finding that pantoprazole significantly increased the MPA-AUC12 h and dose-normalized AUC12 h following EC-MPS administration suggests that absorption of EC-MPS occurred earlier in the presence of pantoprazole even though the Cmax attained was not dissimilar to the absence of pantoprazole. Nevertheless, it has been shown that the MPA pharmacokinetic profile for EC-MPS exhibits a greater intra-patient variability when compared with MMF formulation, which may have contributed to differences between our study and previous reports [23]. Differences in the study design, sample size, population characteristics and concomitant CNI maintenance may also have contributed to the dissimilar findings between our study and the cross-over study from Germany [19].
The systemic exposure of MMF and EC-MPS has been shown to be generally equivalent after equimolar dosing (i.e. MPA-AUC0–∞ following 720 mg EC-MPS is equivalent to 1 g of MMF: 66.5 μg*h/mL versus 63.7 μg*h/mL, respectively) [16, 21]. Several randomized controlled trials and cohort studies have shown that higher MPA exposure (MMF formulation) may be associated with a lower risk of acute rejection, particularly achieving MPA-AUC >30 mg*h/L in the first week post-transplant, but this association was no longer apparent beyond this timepoint [4, 5, 24–27]. The clinical relevance of MPA concentration in the outcome of other solid organ transplants (including liver and heart transplant recipients) remains unclear, with most studies evaluating MPA trough levels rather than extended MPA profiles [28–32]. There have been no clinical studies that have examined the association between MPA exposure and allograft outcome in kidney transplant recipients maintained on EC-MPS. In our study, a greater proportion of recipients maintained on MMF had achieved higher mean MPA-AUC12 h, despite a smaller proportion being maintained on the ‘maximal bio-equivalent dose’ of MMF (2 g/day, 32%) compared with EC-MPS (1440 mg/day, 52%). In the presence of pantoprazole, the proportion of recipients maintained on MMF with MPA-AUC12 h >30 mg*h/L was reduced by 22% compared with placebo, which may have potential clinical relevance in the early post-transplant period. For recipients maintained on EC-MPS, pantoprazole substantially increased the proportion of recipients achieving higher MPA-AUC12 h thresholds, particularly >40 mg*h/L.
Co-administration of different CNI types has been shown to influence MPA exposure with the use of cyclosporin being associated with up to 50% reduction in MPA exposure compared with tacrolimus. This has been attributed to the differential effect of the different CNIs on enterohepatic recycling [21, 33, 34]. In our study, the MPA-AUC12 h and dose-normalized AUC12 h were higher for tacrolimus-treated patients compared with cyclosporin-treated patients, despite a higher median dose of MMF and EC-MPS being prescribed for cyclosporin-treated patients. The co-administration of pantoprazole reduced the MPA-AUC12 h and Cmax for tacrolimus- and cyclosporin-treated patients, but this was not statistically significant (with wide CIs) in the latter group, likely reflecting the small number of patients maintained on cyclosporin. Similarly, when stratified by eGFR of thresholds of ≤60 and >60 mL/min/1.73 m2, the results were similar although the proportional change in MPA-AUC12 h and Cmax was not statistically significant for recipients with entry eGFR of >60 mL/min/1.73 m2, likely to reflect the smaller sample size.
There are a few limitations in this study. Our sample size calculation was based on an effect size of ≥25% in AUC12 h, and when combined with the variability in MPA pharmacokinetic profiles may suggest that our study was not sufficiently powered for certain pharmacokinetic parameters, particularly when stratified by CNI types. Nevertheless, this study remains the largest randomized cross-over trial conducted in stable kidney and liver transplant recipients. It is possible that the 1 week washout period for pantoprazole was inadequate, but given the plasma half-life of pantoprazole is around 1 h [35], it is unlikely that there was any residual carry-over effect of pantoprazole during the wash-out period. In addition, the dose of 40 mg daily of pantoprazole was chosen as the intervention to reflect regimens most commonly used in clinical transplant practice in Australia, but the study findings may not be able to extrapolate to other PPIs, which may have dissimilar half-lives and inhibitory effects on gastric acid secretion [36]. Given, we had only recruited one liver transplant recipient, our findings cannot be extrapolated to this population. Furthermore, our study findings may not be readily generalizable across kidney transplant recipients with poorer allograft function or in recipients with long-term exposure to PPI.
Despite the pharmacokinetic variability of MPA, the concurrent administration of PPI substantially reduced the MPA concentrations by almost 20%, but the longer term clinical effect of this interaction remains unknown. Even though the clinical significance of MPA TDM in chronic kidney and liver transplant recipients remains uncertain, clinicians should still be cognizant of this important drug interaction when prescribing PPI with MMF or EC-MPS in the early post-transplant period. Future studies designed to evaluate the allograft outcome of recipients maintained on different MPA formulation with and without PPI are needed to ascertain the long-term clinical relevance of this drug interaction.
ACKNOWLEDGEMENTS
The authors are grateful for the unrestricted educational grant provided by Novartis® for the completion of this trial; however, the study design, conduct of the trial, interpretation of the data, analysis, writing of the paper and decision to submit the manuscript for publication were undertaken only by the authors, without involvement by Novartis®.
FUNDING
W.H.L. is supported by a Clinical Research Fellowship from the Raine Foundation (University of Western Australia and Health Department of Western Australia) and Jacquot Research Foundation (Royal Australasian College of Physicians). G.W. is supported by a National Health and Medical Research Council Career Development Fellowship. E.O. is supported by a National Heart Foundation Future Leader Fellowship (Award ID: 102538).
AUTHORS’ CONTRIBUTIONS
W.H.L. and G.R. designed the study and recruited the participants. W.H.L. has full access to the trial data. W.H.L. and E.O. participated in the analysis of the data. All authors participated in the interpretation of the data and writing of the article.
CONFLICT OF INTEREST STATEMENT
N.B. has received speaking honoraria from Baxter, travel grants from Amgen and Roche, and unrestricted educational grants from Amgen, Roche and Baxter. W.H.L. has received speaking honoraria from Alexion, Astellas and Novartis, and unrestricted educational grants from Astellas and Novartis.


Comments