


Abstract
High glomerular filtration rate (GFR) is often used as a surrogate for single-nephron hyperfiltration. Our objective was to determine the definition for high GFR that best reflects clinical and structural characteristics of hyperfiltration.
We studied living kidney donors at the Mayo Clinic and Cleveland Clinic. Potential donors underwent evaluations that included measured GFR (mGFR) by iothalamate clearance and estimated GFR (eGFR) by the serum creatinine–based Chronic Kidney Disease-Epidemiology collaboration (CKD-EPI) equation. High GFR was defined by the 95th percentile for each method (mGFR or eGFR) using either overall or age-specific thresholds. High mGFR was defined as both corrected and uncorrected for body surface area. The association of high GFR by each definition with clinical characteristics and radiologic findings (kidney volume) was assessed. In the subset that donated, the association of high GFR with kidney biopsy findings (nephron number and glomerular volume) and single-nephron GFR was assessed.
We studied 3317 potential donors, including 2125 actual donors. The overall 95th percentile for corrected mGFR was 134 mL/min/1.73 m2 and for eGFR was 118 mL/min/1.73 m2. The age-based threshold for uncorrected mGFR was 198 mL/min − 0.943×Age, for corrected mGFR it was 164 mL/min/1.73 m2 − 0.730×Age and for eGFR it was 146 mL/min/1.73 m2 − 0.813×Age. High age-based uncorrected mGFR had the strongest associations with higher single-nephron GFR, larger glomerular volume, larger kidney volume, male gender, higher body mass index and higher 24-h urine albumin, but also had the strongest association with high nephron number. A high age-height-gender–based uncorrected mGFR definition performed almost as well but had a weaker association with nephron number and did not associate with male gender.
High age-based uncorrected mGFR showed the most consistent associations reflective of hyperfiltration. However, high age-based uncorrected mGFR has limited clinical utility because it does not distinguish between hyperfiltration and high nephron number.
INTRODUCTION
Glomerular hyperfiltration is an increase in single-nephron glomerular filtration rate (GFR) that occurs in both physiological states (pregnancy [1] and dietary protein load [2]) and pathological states (diabetes mellitus, polycystic kidney disease, sickle cell disease, metabolic syndrome, obesity). Glomerular hyperfiltration can precede the development of progressive chronic kidney disease (CKD) and may associate with cardiovascular disease (CVD) and mortality [3–6].
High GFR is often used as a surrogate for single-nephron hyperfiltration since determining single-nephron GFR is impractical in routine clinical care [7]. An increase in GFR over time can also identify hyperfiltration [8] but requires past GFR assessments that may not be available. The 95th or 97.5th percentile for GFR in a healthy reference population is typically used to define high GFR thresholds [9]. However, these high GFR thresholds can differ considerably between studies. Some studies use serum creatinine–based estimated GFR (eGFR) [4–6], whereas others use measured GFR (mGFR) by clearance of an exogenous marker such as iothalamate [3, 10]. Furthermore, both a single overall threshold and age-specific thresholds have been used to define high GFR [11, 12]. Hence the best method to determine high GFR for use as a surrogate marker of hyperfiltration is unclear. Prior studies have reported a poor correlation between eGFR and mGFR [13, 14] and have shown substantial disagreements in the threshold definition for high GFR [15]. Is an eGFR or mGFR threshold better to define hyperfiltration in a healthy population? Does it matter if the threshold is age based or a single overall threshold? Although associations of CKD risk factors with low eGFR are relatively similar to those with low mGFR [16–18], it is unclear if this is also true for high GFR.
To address these questions, we used data obtained in relatively healthy adults (living kidney donors) to define overall and age-based 95th percentile thresholds for high mGFR and high eGFR. Kidney donors are often excluded from pre-donation evaluation and donation if their GFR is ‘too low’ but typically not if their GFR is ‘too high’. Kidney donors also provide unique access to kidney structural measures. We compared high GFR obtained by four commonly used definitions: mGFR in mL/min/1.73 m2 (overall and age based) and eGFR by Chronic Kidney Disease Epidemiology Collaboration (CKD-EPI) equation (overall and age based), as well as three alternative definitions [age-based mGFR in mL/min, age-gender-height–based mGFR in mL/min and age-based eGFR by the full age spectrum (FAS) equation] to determine which was most reflective of hyperfiltration.
MATERIALS AND METHODS
Study population
After obtaining institutional review board approval, we identified potential kidney donors from the Mayo Clinic Rochester and Cleveland Clinic between 2000 and 2012. This allowed us to measure GFR in a large number of presumed relatively healthy individuals undergoing a thorough evaluation without any clinical indication other than the desire to donate a kidney. All potential donor evaluations included a clinical examination, mGFR, other laboratory tests and a computed tomography (CT) scan of the kidneys. Each potential donor was then discussed by a multidisciplinary team to ascertain whether donation was reasonably safe or whether there was concern for a risk of developing kidney disease or other morbidity that precluded donation. Only the subset of actual donors that went on to donate a kidney had an intraoperative kidney biopsy.
Clinical and laboratory evaluation
The clinical examination included height, weight and blood pressure (BP) measurement. Hypertension was defined by use of antihypertensive medications or BP >140/90 mmHg. A family history of end-stage renal disease (ESRD) was defined by being a living-related donor. Laboratory tests included serum creatinine (for eGFR), fasting blood glucose, lipid profile and serum uric acid. Proteinuria was assessed by 24-h urine albumin and total protein excretion (Mayo Clinic only) and mGFR was assessed by the urinary clearance of iothalamate (UV/P) using site-specific protocols [19, 20]. Potential donors are pre-screened for known CKD or important CKD risk factors (e.g. diabetes and CVD). Actual donors are even healthier because they were confirmed to not have CKD or significant risk factors for CKD after a thorough predonation evaluation. Acceptable criteria for donation varied by site and era, but in general included 24-h urine albumin excretion <30 mg and an mGFR normal for the person’s age. Mild hypertension in older donors and moderate obesity [body mass index (BMI) <35 kg/m2] was allowed. Individuals with diabetes or evident CVD were not accepted as donors.
Serum creatinine was measured using a standardized assay or, if pre-standardization, was corrected to standardized levels. eGFR was calculated using the CKD-EPI serum creatinine-based equation that was derived to estimate a GFR determined by iothalamate clearance [21]. Alternatively, the serum creatinine–based FAS eGFR was used [22]. mGFR was assessed as both corrected (mL/min/1.73 m2) and uncorrected (mL/min) for body surface area. The day-to-day mean coefficient of variation (CV) of mGFR was 8.2% and that of CKD-EPI eGFR was 6.4% [23].
Kidney macrostructure
Potential kidney donors underwent a contrast CT scan that generated angiogram/cortical phase images. These images were downloaded into a workstation to segment the total cortical parenchymal volume and medullary parenchymal volumes in each kidney [24, 25]. These were summed for the total kidney parenchymal volume. If there was poor cortical–medullary differentiation, then the total kidney parenchymal volume was segmented from non-contrast phase images and the cortical and medullary volumes were estimated from the total kidney parenchymal volume [24, 25].
Kidney microstructure
Among actual kidney donors, a needle core renal biopsy was performed during the transplantation surgery. The tissue specimen was fixed in formalin and embedded in paraffin. A 2- to 3-μm-thick periodic acid–Schiff-stained section was scanned into a high-resolution digital image (Aperio XT system scanner; Leica Biosystems, Buffalo Grove, IL, USA) and magnified onto a tablet to manually outline the cortex and individual glomeruli. The mean non-sclerotic glomerular volume and density were calculated using the Weibel and Gomez stereologic method [26]. The mean profile (cross-sectional) tubular area was also estimated by counting the tubular profiles in 1 mm2 of cortex, as previously described [27]. The percentage of glomeruli that were globally sclerotic and the presence of interstitial fibrosis with tubular atrophy involving >1% of the cortex was also identified on these biopsy sections [25]. The nephron number (number of non-sclerotic glomeruli) was estimated from the total cortical volume times the glomerular density, with correction factors for loss of perfusion pressure and tissue shrinkage with fixation that inflate glomerular density [28]. Single-nephron GFR (nL/min) was calculated from the uncorrected mGFR divided by the nephron number [7]. The repeat-test CV of nephron number and single-nephron GFR was 33% and 41%, respectively [7, 28].
Statistical analysis
Commonly used definitions for high GFR were all corrected (mL/min/1.73 m2). Overall 95th percentile thresholds were defined separately for mGFR and CKD-EPI eGFR. Linear age-specific 95th percentile thresholds for mGFR and CKD-EPI eGFR were calculated using quantile regression. Alternative definitions for high GFR included uncorrected mGFR 95th percentile thresholds estimated from age alone and estimated from age, height and gender with quantile regression. An age-based 95th percentile thresholds for FAS eGFR was also considered as an alternative definition. Non-linear age-specific 95th percentile thresholds for mGFR and for eGFR were also calculated using a quadratic term for age (age2) in the quantile regression model. These age2-specific thresholds were not reported since associations with age2-specific thresholds did not substantively differ from associations with linear age-specific thresholds. The prevalence of high GFR by each of the definitions was compared across age groups (18–29, 30–39, 40–49, 50–59, 60–69 and 70–75 years) and agreement was assessed with a chi-square test. The agreement between overall and age-based high mGFR and eGFR was assessed with a kappa statistic.
Clinical characteristics, kidney volumes and kidney biopsy findings were compared between high GFR and normal GFR by each of the definitions. Multivariable analysis assessed the independent contribution of the two structural determinants of GFR (glomerular volume and nephron number) to high mGFR and high eGFR. Multivariable analysis was performed to determine the interdependence between clinical characteristics and structural findings with high GFR (using the definition found to be most consistent with hyperfiltration). Analyses were performed using SAS 9.4 (SAS Institute, Cary, NC, USA), Stata 13 (StataCorp, College Station, TX, USA) and JMP version 13.0 (SAS Institute, Cary, NC, USA). Tests with P-values <0.05 were considered statistically significant.
RESULTS
Study sample
We identified 3317 potential kidney donors (2733 from the Mayo Clinic Rochester and 584 from the Cleveland Clinic) between 2000 and 2012. The 24-h urine protein and albumin studies were available in 2550 (77%) of the potential donors. Baseline demographics, clinical and CT characteristics of all potential kidney donors and biopsy characteristics of those who donated are presented in Table 1.
Baseline characteristics of kidney donors at the Mayo Clinic and Cleveland Clinic
| Characteristics | Potential kidney donors (n = 3317) | Actual kidney donors (n = 2125) |
|---|---|---|
| Demographics | ||
| Age (years) | 43.9 (11.8) | 43.2 (11.2) |
| Male, n (%) | 1402 (42.3) | 906 (42.6) |
| Race, n (%) | ||
| White or unknown | 3050 (92.0) | 1954 (92.0) |
| Black | 119 (3.6) | 80 (3.8) |
| American Indian/Alaska Native | 33 (1.0) | 15 (0.7) |
| Asian | 39 (1.1) | 26 (1.2) |
| Other | 76 (2.3) | 50 (2.4) |
| Risk factors | ||
| Family history of ESRD, n (%) | 1275 (55.5) | 1193 (56.2) |
| Hypertension, n (%) | 632 (19.1) | 335 (15.8) |
| BMI (kg/m2) | 28.0 (5.1) | 27.7 (4.8) |
| Body surface area (m2) | 1.94 (0.23) | 1.92 (0.22) |
| Uric acid (mg/dL) | 5.3 (1.4) | 5.2 (1.4) |
| Glucose (mg/dL) | 93.8 (11.2) | 92.7 (10.1) |
| Kidney function | ||
| Uncorrected mGFR (mL/min) | 113.4 (25.3) | 114.7 (23.2) |
| Corrected mGFR (mL/min/1.73 m2) | 101.3 (19.0) | 103.0 (17.3) |
| CKD-EPI eGFR (mL/min/1.73 m2) | 91.0 (15.6) | 91.3 (15.1) |
| FAS eGFR (mL/min/1.73 m2) | 89.2 (15.7) | 89.7 (14.8) |
| 24-h urine albumin (mg) | 6.9 (16.6) | 5.6 (9.8) |
| 24-h urine protein (mg) | 48.2 (38.4) | 46.5 (34.8) |
| Kidney CT scan measures | ||
| Kidney volume (mm3), left + right | 294 706 (58 098) | 293 479 (54 439) |
| Cortical volume (mm3), left + right | 208 691 (43 275) | 207 048 (40 196) |
| Medullary volume (mm3), left + right | 82 203 (21 022) | 82 307 (20 412) |
| Renal biopsy measures | ||
| Non-sclerotic glomerular volume (μm3 ×106) | 2.72 (1.06) | |
| Glomerular density (per mm3) | 15.7 (7.5) | |
| Mean profile tubular area (μm2) | 4697 (1521) | |
| Nephron number per kidney (×106) | 0.87 (0.39) | |
| Glomerulosclerosis, n (%) | 3.4 (7.7) | |
| Interstitial fibrosis >1%, n (%) | 214 (14.3) | |
Values presented as mean (SD) unless stated otherwise.
The 95th percentile for high GFR
The 95th percentile thresholds for corrected mGFR overall, corrected mGFR age based, CKD-EPI eGFR overall and CKD-EPI eGFR age based are shown in Figure 1. The thresholds used to define high GFR are shown in Table 2. The overall 95th percentile was higher for corrected mGFR at 134 [95% confidence interval (CI) 132–136] mL/min/1.73 m2 than for CKD-EPI eGFR at 118 (95% CI 116–119) mL/min/1.73 m2. The prevalence of high GFR using an overall threshold was highest in the youngest donors and decreased to 0% in the oldest donors (Table 2). The prevalence of high GFR using age-based thresholds was closer to 5% across age groups (Table 2), although there was evidence of some differences across age groups with CKD-EPI eGFR (P = 0.004). Among the alternative high GFR definitions, we found differences across age groups with high FAS eGFR, whereas the prevalence of high uncorrected GFR (age based) was closer to 5% in each age group (Table 2). The prevalence of a high GFR did not differ between Mayo Clinic donors and Cleveland Clinic donors for any of the four commonly used high GFR definitions (P > 0.05 for all). There was better agreement between overall and age-based high corrected mGFR (κ = 0.71) than between overall and age-based high CKD-EPI eGFR (κ = 0.38). The agreement between overall high corrected mGFR and overall high CKD-EPI eGFR (κ = 0.19) and between age-based high corrected mGFR and age-based high CKD-EPI eGFR (κ = 0.16) was fairly modest. The agreement between the age-based high uncorrected mGFR and age-based high corrected mGFR was moderate (κ = 0.50), as was the agreement between age-based high CKD-EPI eGFR and age-based high FAS eGFR (κ = 0.58).
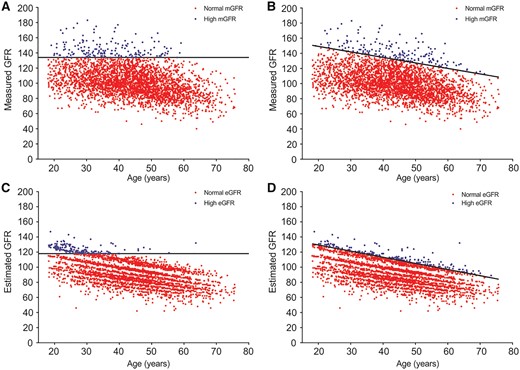
Scatter plots of corrected GFR (mL/min/1.73 m2) by age for 3317 potential kidney donors. Black line represents 95th percentile. Blue dots represent high GFR and red dots represent normal or low GFR for (A) overall corrected mGFR, (B) age-based corrected mGFR, (C) overall eGFR and (D) age-based eGFR.
Thresholds and prevalence of high GFR by different definitions across age groups
| Commonly used high GFR definitions | Age group (years) | ||||||
|---|---|---|---|---|---|---|---|
| 18–29 (n = 459) | 30–39 (n = 790) | 40–49 (n = 1046) | 50–59 (n = 721) | 60–69 (n = 272) | 70–75 (n = 29) | P-value* | |
| Corrected mGFR, overall threshold (>134 mL/min/1.73 m2) | |||||||
| >95th percentile (mL/min/1.73 m2) | >134 | >134 | >134 | >134 | >134 | >134 | |
| High GFR (%) | 10.7 | 8.0 | 3.4 | 2.8 | 0.0 | 0.0 | <0.001 |
| CKD-EPI eGFR overall threshold (>118 mL/min/1.73 m2) | |||||||
| >95th percentile (mL/min/1.73 m2) | >118 | >118 | >118 | >118 | >118 | >118 | |
| High GFR (%) | 27.2 | 4.3 | 0.57 | 0.14 | 0.37 | 0.0 | <0.001 |
| Corrected mGFR, age-based threshold (>164 mL/min/1.73 m2 – 0.730 × age) | |||||||
| >95th percentile (mL/min/1.73 m2) | >151–143 | >142–136 | >135–128 | >127–121 | >120–114 | 113–109 | |
| High GFR (%) | 5.0 | 5.3 | 4.7 | 5.8 | 3.3 | 3.4 | 0.67 |
| CKD-EPI eGFR age-based threshold (>146 mL/min/1.73 m2 – 0.813 × age) | |||||||
| >95th percentile (mL/min/1.73 m2) | >131–122 | >121–114 | >113–106 | >105–98 | >97–90 | >89–85 | |
| High GFR (%) | 7.4 | 4.3 | 4.0 | 4.0 | 8.5 | 6.9 | 0.004 |
| Alternative high GFR definitions | |||||||
| FAS eGFR age-based threshold (>149 mL/min/1.73 m2 – 0.843 × age) | |||||||
| >95th percentile (mL/min/1.73 m2) | >134–125 | >124–116 | >115–108 | >107–99 | >98–91 | >90–86 | |
| High GFR (%) | 2.2 | 6.1 | 7.0 | 4.2 | 2.6 | 0.0 | <0.001 |
| Uncorrected mGFR age-based threshold (>198 mL/min/1.73 m2 – 0.943 × age) | |||||||
| >95th percentile (mL/min) | >181–171 | >170–161 | >160–152 | >151–142 | >141–133 | >132–127 | |
| High GFR (%) | 4.4 | 4.9 | 5.6 | 6.0 | 3.3 | 3.4 | 0.48 |
| Uncorrected mGFR age-height-gender–based threshold | |||||||
| >95th percentile (mL/min) | –a | –a | –a | –a | –a | –a | |
| High GFR (%) | 4.4 | 5.4 | 4.9 | 7.1 | 2.9 | 0.0 | 0.03 |
Chi-square test.
95th percentile (mL/min) = 14.297 – 0.881 × age (in years) + 1.173 × height (in cm) + 8.062 (if male).
Unadjusted associations with high GFR
We compared the association of clinical characteristics with overall high GFR by both corrected mGFR and CKD-EPI eGFR (Table 3). Clinical characteristics that associated with an overall high corrected mGFR were younger age, less hypertension, lower uric acid, larger kidney volume and greater nephron number. Overall, high CKD-EPI eGFR had similar associations, except it was also associated with black race, family history of ESRD, lower BP, lower fasting glucose and higher urine albumin. We next compared the association of clinical characteristics with age-based GFR thresholds (Table 4). An age-based high corrected mGFR was associated with non-white race, higher BMI, lower uric acid, higher fasting glucose, larger kidney volume, higher 24-h urine protein and albumin excretions, higher glomerular density and greater nephron number. An age-based high CKD-EPI eGFR differed from an age-based high corrected mGFR in which it was associated with women and black race and not with higher BMI, higher fasting glucose, higher 24-h urine protein, higher glomerular density or greater nephron number.
Characteristics of potential and actual kidney donors stratified by overall high GFR
| Characteristics | Overall mGFR (mL/min/1.73 m2) | Overall eGFR (mL/min/1.73 m2) | ||||||||||
|---|---|---|---|---|---|---|---|---|---|---|---|---|
| Potential donors (n = 3317) | Actual donors (n = 2125) | Potential donors (n = 3317) | Actual donors (n = 2125) | |||||||||
| High GFR (n = 168) | Normal GFR (n = 3149) | P-value | High GFR (n = 110) | Normal GFR (n = 2015) | P-value | High GFR (n = 167) | Normal GFR (n = 3150) | P-value | High GFR (n = 102) | Normal GFR (n = 2023) | P-value | |
| Demographics | ||||||||||||
| Mean age (years) | 36 | 44 | <0.0001 | 37 | 44 | <0.0001 | 28 | 45 | <0.0001 | 27 | 44 | <0.0001 |
| Male, % | 45 | 42 | 0.42 | 43 | 43 | 0.98 | 44 | 42 | 0.58 | 41 | 43 | 0.76 |
| Race, % | ||||||||||||
| White or unknown | 86 | 92 | 0.006 | 85 | 92 | 0.003 | 73 | 93 | <0.0001 | 68 | 93 | <0.0001 |
| Black | 4.8 | 3.5 | 0.40 | 6.4 | 3.6 | 0.14 | 16 | 2.9 | <0.0001 | 21 | 2.9 | <0.0001 |
| Other | 8.9 | 4.2 | 0.004 | 9.1 | 4.0 | 0.01 | 11 | 4.1 | <0.0001 | 12 | 3.9 | 0.0001 |
| Risk factors | ||||||||||||
| Family history of ESRD, % | 62 | 55 | 0.14 | 61 | 56 | 0.30 | 67 | 55 | 0.02 | 67 | 56 | 0.03 |
| Hypertension, % | 12 | 19 | 0.02 | 7 | 16 | 0.01 | 11 | 19 | 0.005 | 6 | 16 | 0.005 |
| Systolic BP (mmHg) | 120 | 122 | 0.12 | 117 | 121 | 0.02 | 117 | 122 | 0.0006 | 115 | 121 | 0.0001 |
| Diastolic BP (mmHg) | 73 | 74 | 0.12 | 71 | 73 | 0.06 | 71 | 74 | <0.0001 | 70 | 73 | 0.0001 |
| BMI (kg/m2) | 29 | 28 | 0.12 | 28 | 28 | 0.20 | 27 | 28 | 0.17 | 27 | 28 | 0.13 |
| Body surface area (m2) | 1.95 | 1.94 | 0.36 | 1.95 | 1.93 | 0.26 | 1.90 | 1.94 | 0.06 | 1.87 | 1.93 | 0.009 |
| Uric acid (mg/dL) | 5.0 | 5.3 | 0.002 | 4.9 | 5.2 | 0.007 | 5.1 | 5.3 | 0.09 | 5.0 | 5.2 | 0.15 |
| Fasting glucose (mg/dL) | 93 | 94 | 0.34 | 92 | 93 | 0.62 | 90 | 94 | <0.0001 | 89 | 93 | <0.0001 |
| CT scan measures | ||||||||||||
| Total kidney volume (cm3) left + right | 353 | 291 | <0.0001 | 347 | 291 | <0.0001 | 327 | 293 | <0.0001 | 316 | 292 | 0.0003 |
| Total cortex volume (cm3) left + right | 251 | 206 | <0.0001 | 245 | 205 | <0.0001 | 241 | 207 | <0.0001 | 231 | 206 | <0.0001 |
| Total medulla volume (cm3) left + right | 95 | 81 | <0.0001 | 97 | 82 | <0.0001 | 82 | 82 | 0.92 | 79 | 83 | 0.18 |
| Kidney function | ||||||||||||
| 24-h urine protein (mg) | 52 | 48 | 0.25 | 50 | 46 | 0.32 | 48 | 48 | 0.99 | 42 | 47 | 0.27 |
| 24-h urine albumin (mg) | 7.4 | 6.9 | 0.72 | 6.2 | 5.6 | 0.60 | 10 | 6.7 | 0.03 | 5.6 | 5.6 | 0.96 |
| Biopsy measures | ||||||||||||
| Glomerular volume (mm3) | – | – | – | 0.0028 | 0.0027 | 0.69 | – | – | – | 0.0026 | 0.0027 | 0.52 |
| Glomerular density (per mm3) | – | – | – | 16.5 | 15.6 | 0.30 | – | – | – | 17.2 | 15.6 | 0.08 |
| Mean profile tubular area (μm2) | – | – | – | 4691 | 4697 | 0.97 | – | – | – | 4599 | 4702 | 0.58 |
| Nephron number per kidney (×106) | – | – | – | 1.10 | 0.86 | <0.0001 | – | – | – | 1.05 | 0.86 | <0.0001 |
| Glomerulosclerosis, % | – | – | – | 3.0 | 3.4 | 0.60 | – | – | – | 1.9 | 3.5 | 0.09 |
| Cortical fibrosis >1%, % | – | – | – | 9.5 | 14.6 | 0.20 | – | – | – | 6.9 | 14.7 | 0.06 |
Characteristics of potential and actual kidney donors stratified by age-based high GFR
| Characteristics | Age-based mGFR (mL/min/1.73 m2) | Age-based eGFR (mL/min/1.73 m2) | ||||||||||
|---|---|---|---|---|---|---|---|---|---|---|---|---|
| Potential donors (n = 3317) | Actual donors (n = 2125) | Potential donors (n = 3317) | Actual donors (n = 2125) | |||||||||
| High GFR (n = 166) | Normal GFR (n = 3151) | P-value | High GFR (n = 99) | Normal GFR (n = 2026) | P-value | High GFR (n = 164) | Normal GFR (n = 3153) | P-value | High GFR (n = 95) | Normal GFR (n = 2030) | P-value | |
| Demographic | ||||||||||||
| Mean age (years) | 44 | 44 | 0.98 | 43 | 43 | 0.62 | 44 | 44 | 0.81 | 43 | 43 | 0.70 |
| Male, % | 43 | 42 | 0.89 | 39 | 43 | 0.50 | 33 | 43 | 0.01 | 31 | 43 | 0.01 |
| Race, % | ||||||||||||
| White or unknown | 86 | 92 | 0.005 | 85 | 92 | 0.008 | 70 | 93 | <0.0001 | 62 | 93 | <0.0001 |
| Black | 6.0 | 3.5 | 0.08 | 7.1 | 3.6 | 0.08 | 23 | 2.6 | <0.0001 | 30 | 2.6 | <0.0001 |
| Other | 7.8 | 4.3 | 0.03 | 8.1 | 4.1 | 0.06 | 7.3 | 4.3 | 0.07 | 8.4 | 4.1 | 0.04 |
| Risk factors | ||||||||||||
| Family history of ESRD, % | 58 | 55 | 0.58 | 58 | 56 | 0.77 | 57 | 55 | 0.71 | 57 | 56 | 0.89 |
| Hypertension, % | 20 | 19 | 0.78 | 12 | 16 | 0.31 | 20 | 19 | 0.88 | 13 | 16 | 0.39 |
| Systolic blood pressure (mmHg) | 122 | 122 | 0.52 | 118 | 121 | 0.14 | 123 | 121 | 0.21 | 121 | 120 | 0.77 |
| Diastolic blood pressure (mmHg) | 74 | 74 | 0.47 | 73 | 73 | 0.56 | 74 | 74 | 0.72 | 73 | 73 | 0.80 |
| BMI (kg/m2) | 29 | 28 | 0.02 | 28 | 28 | 0.21 | 28 | 28 | 0.79 | 28 | 28 | 0.88 |
| Body surface area (m2) | 1.95 | 1.94 | 0.39 | 1.95 | 1.93 | 0.26 | 1.89 | 1.94 | 0.003 | 1.87 | 1.93 | 0.009 |
| Uric acid (mg/dL) | 5.0 | 5.3 | 0.006 | 4.9 | 5.2 | 0.008 | 4.9 | 5.3 | <0.0001 | 4.7 | 5.2 | 0.0002 |
| Fasting glucose (mg/dL) | 96 | 94 | 0.01 | 94 | 93 | 0.30 | 93 | 94 | 0.49 | 92 | 93 | 0.29 |
| CT scan measures | ||||||||||||
| Total kidney volume (cm3) left + right | 354 | 291 | <0.0001 | 348 | 291 | <0.0001 | 330 | 293 | <0.0001 | 324 | 292 | <0.0001 |
| Total cortex volume (cm3) left + right | 249 | 207 | <0.0001 | 245 | 205 | <0.0001 | 235 | 207 | <0.0001 | 227 | 206 | 0.0001 |
| Total medulla volume (cm3) left + right | 98 | 81 | <0.0001 | 100 | 81 | <0.0001 | 88 | 82 | <0.0001 | 89 | 82 | 0.01 |
| Kidney function | ||||||||||||
| 24-h urine protein (mg) | 60 | 48 | 0.0005 | 53 | 46 | 0.09 | 51 | 48 | 0.39 | 45 | 47 | 0.68 |
| 24-h urine albumin (mg) | 11 | 6.7 | 0.002 | 6.5 | 5.6 | 0.41 | 9.8 | 6.7 | 0.05 | 3.6 | 5.7 | 0.09 |
| Biopsy measures | ||||||||||||
| Glomerular volume (mm3) | – | – | – | 0.0027 | 0.0027 | 0.97 | – | – | – | 0.0028 | 0.0027 | 0.65 |
| Glomerular density (per mm3) | – | – | – | 18.1 | 15.5 | 0.005 | – | – | – | 15.5 | 15.7 | 0.82 |
| Mean profile tubular area (μm2) | – | – | – | 4599 | 4702 | 0.57 | – | – | – | 4719 | 4696 | 0.91 |
| Nephron number per kidney (×106) | – | – | – | 1.11 | 0.86 | <0.0001 | – | – | – | 0.95 | 0.87 | 0.10 |
| Glomerulosclerosis, % | – | – | – | 3.4 | 3.4 | 0.99 | – | – | – | 3.9 | 3.4 | 0.66 |
| Cortical fibrosis >1%, % | – | – | – | 14.9 | 14.3 | 0.89 | – | – | – | 13.1 | 14.4 | 0.78 |
We then assessed these same clinical characteristics for their association with high uncorrected mGFR (Table 5). Age-based high uncorrected mGFR showed stronger associations with being male, hypertension, higher blood pressure, higher BMI, larger kidney volume, higher 24-h urine protein and albumin, larger glomerular volume and larger tubules compared with age-based high corrected mGFR. Age-based high uncorrected mGFR also had a weaker association with nephron number and associated with higher rather than lower uric acid levels compared with age-based high corrected mGFR. Age-height-gender–based high uncorrected mGFR did not associate with male gender, larger glomerular volume or larger tubules and generally showed slightly weaker associations to those seen with age-based high uncorrected mGFR except for BMI.
Characteristics of potential and actual kidney donors stratified by age-based and age-height-gender–based high uncorrected mGFR (mL/min)
| Characteristics | Age-based mGFR (mL/min) | Age–height–gender-based mGFR (mL/min) | ||||||||||
|---|---|---|---|---|---|---|---|---|---|---|---|---|
| Potential donors (n = 3317) | Actual donors (n = 2125) | Potential donors (n = 3317) | Actual donors (n = 2125) | |||||||||
| High GFR (n = 166) | Normal GFR (n = 3151) | P-value | High GFR (n = 99) | Normal GFR (n = 2026) | P-value | High GFR (n = 164) | Normal GFR (n = 3153) | P-value | High GFR (n = 95) | Normal GFR (n = 2030) | P-value | |
| Demographics | ||||||||||||
| Mean age (years) | 44 | 44 | 0.89 | 43 | 43 | 0.95 | 44 | 44 | 0.94 | 43 | 43 | 0.90 |
| Male, % | 78 | 40 | <0.0001 | 76 | 41 | <0.0001 | 42 | 42 | 0.99 | 36 | 43 | 0.20 |
| Race, % | ||||||||||||
| White or unknown | 87 | 92 | 0.008 | 87 | 92 | 0.09 | 84 | 92 | 0.0002 | 84 | 92 | 0.002 |
| Black | 5.9 | 3.5 | 0.10 | 5.3 | 3.7 | 0.43 | 6.9 | 3.4 | 0.02 | 7.1 | 3.6 | 0.08 |
| Other | 7.6 | 4.3 | 0.04 | 7.4 | 4.1 | 0.13 | 8.7 | 4.2 | 0.006 | 9.1 | 4.1 | 0.02 |
| Risk factors | ||||||||||||
| Family history of ESRD, % | 59 | 55 | 0.44 | 60 | 56 | 0.44 | 56 | 56 | 0.93 | 57 | 56 | 0.93 |
| Hypertension, % | 33 | 18 | <0.0001 | 16 | 20 | 0.25 | 31 | 18 | <0.0001 | 16 | 19 | 0.34 |
| Systolic blood pressure (mmHg) | 128 | 121 | <0.0001 | 123 | 120 | 0.15 | 127 | 121 | <0.0001 | 122 | 120 | 0.22 |
| Diastolic blood pressure (mmHg) | 77 | 74 | <0.0001 | 75 | 73 | 0.02 | 77 | 74 | <0.0001 | 75 | 73 | 0.02 |
| BMI (kg/m2) | 33 | 28 | <0.0001 | 32 | 28 | <0.0001 | 34 | 28 | <0.0001 | 33 | 28 | <0.0001 |
| Body surface area (m2) | 2.25 | 1.92 | <0.0001 | 2.22 | 1.91 | <0.0001 | 2.10 | 1.93 | <0.0001 | 2.06 | 1.92 | <0.0001 |
| Uric acid (mg/dL) | 5.9 | 5.2 | <0.0001 | 5.7 | 5.2 | 0.0002 | 5.4 | 5.3 | 0.18 | 5.1 | 5.2 | 0.51 |
| Fasting glucose (mg/dL) | 99 | 94 | <0.0001 | 97 | 93 | 0.0002 | 98 | 94 | <0.0001 | 96 | 93 | 0.005 |
| CT scan measures | ||||||||||||
| Total kidney volume (cm3), left + right | 396 | 289 | <0.0001 | 393 | 289 | <0.0001 | 363 | 291 | <0.0001 | 358 | 290 | <0.0001 |
| Total cortex volume (cm3), left + right | 279 | 205 | <0.0001 | 274 | 204 | <0.0001 | 255 | 206 | <0.0001 | 247 | 205 | <0.0001 |
| Total medulla volume (cm3), left + right | 107 | 81 | <0.0001 | 107 | 81 | <0.0001 | 99 | 81 | <0.0001 | 101 | 81 | <0.0001 |
| Kidney function | ||||||||||||
| 24-h urine protein (mg) | 67 | 47 | <0.0001 | 60 | 46 | 0.0007 | 65 | 47 | <0.0001 | 55 | 46 | 0.03 |
| 24-h urine albumin (mg) | 16 | 6.4 | <0.0001 | 9.6 | 5.4 | 0.0004 | 15 | 6.4 | <0.0001 | 7.8 | 5.5 | 0.05 |
| Biopsy measures | ||||||||||||
| Glomerular volume (mm3) | – | – | – | 0.0032 | 0.0027 | 0.0009 | – | – | – | 0.0029 | 0.0027 | 0.14 |
| Glomerular density (per mm3) | – | – | – | 14.0 | 15.7 | 0.07 | – | – | – | 15.8 | 15.7 | 0.92 |
| Mean profile tubular area (μm2) | – | – | – | 5239 | 4673 | 0.004 | – | – | – | 4799 | 4692 | 0.57 |
| Nephron number per kidney (×106) | – | – | – | 1.05 | 0.86 | 0.0002 | – | – | – | 1.06 | 0.86 | <0.0001 |
| Glomerulosclerosis, % | – | – | – | 3.6 | 3.4 | 0.88 | – | – | – | 3.4 | 3.4 | 0.99 |
| Cortical fibrosis >1%, % | – | – | – | 13.9 | 14.4 | 0.91 | – | – | – | 14.1 | 14.4 | 0.95 |
Glomerular size and function by different definitions of high GFR
After adjusting for nephron number, high mGFR definitions had stronger associations with larger glomerular volume than did high eGFR definitions (Table 6). High age-based uncorrected mGFR had the strongest associations with both larger glomerular volume and higher nephron number. Among mGFR definitions, high age-height-gender–based mGFR had the weakest association with nephron number and second strongest association with glomerular volume. Similarly, single-nephron GFR was higher for high mGFR definitions than for high eGFR definitions (Table 7). High age-based uncorrected mGFR was the definition associated with the highest single-nephron GFR.
Association of high GFR by different definitions with glomerular volume and nephron number in actual donors
| High GFR definitions | Glomerular volume, per SD | Nephron number, per SD | ||
|---|---|---|---|---|
| ORa | P-value | ORa | P-value | |
| Commonly used high GFR definitions | ||||
| High corrected mGFR (overall) | 1.55 (1.20–1.99) | 0.0007 | 2.02 (1.61–2.54) | <0.0001 |
| High eGFR (overall) | 1.15 (0.87–1.52) | 0.32 | 1.60 (1.27–2.01) | <0.0001 |
| High corrected mGFR (age based) | 1.59 (1.21–2.08) | 0.0008 | 2.06 (1.62–2.64) | <0.0001 |
| High eGFR (age based) | 1.15 (0.86–1.55) | 0.35 | 1.30 (0.99–1.70) | 0.06 |
| Alternative high GFR definitions | ||||
| High eGFR-FAS (age based) | 1.05 (0.75–1.47) | 0.79 | 1.26 (0.94–1.69) | 0.13 |
| High uncorrected mGFR (age based) | 2.10 (1.63–2.71) | <0.0001 | 2.13 (1.65–2.75) | <0.0001 |
| High uncorrected mGFR (age-height-gender–based) | 1.61 (1.23–2.09) | 0.0005 | 1.89 (1.47–2.41) | <0.0001 |
Adjusted for each other variable. OR, odds ratio.
Median single-nephron GFR (snGFR) among actual donors with and without high GFR
| High GFR definitions | snGFR of those with high GFR (nL/min), median | snGFR of those without high GFR (nL/min), median | P-valuea |
|---|---|---|---|
| Commonly used High GFR definitions | |||
| High corrected mGFR (overall) | 81 | 69 | 0.03 |
| High eGFR (overall) | 64 | 69 | 0.23 |
| High corrected mGFR (age based) | 81 | 69 | 0.08 |
| High eGFR (age based) | 66 | 69 | 0.72 |
| Alternative High GFR definitions | |||
| High eGFR-FAS (age based) | 66 | 69 | 0.67 |
| High uncorrected mGFR (age based) | 89 | 69 | 0.0007 |
| High uncorrected mGFR (age-height-gender–based) | 86 | 69 | 0.004 |
Wilcoxon rank sums test.
Interdependence of clinical characteristics and kidney structure with high GFR
Multivariable analysis in potential kidney donors was performed to determine if clinical characteristics associated with high age-based uncorrected mGFR via larger kidney volume (Supplementary data, Table S1). Independent clinical characteristics that associated with high age-based uncorrected mGFR were non-white race, male, high BMI and high urine albumin. After further adjusting for kidney volume, male and BMI were attenuated but remained independently associated with high age-based uncorrected mGFR. After this adjustment, urine albumin was no longer associated with high age-based uncorrected mGFR.
Multivariable analysis in actual kidney donors with a kidney biopsy was performed to determine if clinical characteristics associated with high age-based uncorrected mGFR via larger glomeruli or more nephrons (Supplementary data, Table S2). Independent clinical characteristics that associated with high age-based uncorrected mGFR were male, high BMI and high urine albumin. After further adjusting for glomerular volume and nephron number, the associations with male and BMI were attenuated, but the association with urine albumin did not change.
DISCUSSION
This study found high corrected mGFR to be superior to high CKD-EPI eGFR for the purpose of identifying hyperfiltration. High corrected mGFR but not high CKD-EPI eGFR associated with a higher single-nephron GFR and larger glomerular volume (after adjusting for nephron number). Compared with high age-based mGFR, high age-based CKD-EPI eGFR had a weaker association with larger kidney volume and failed to detect associations with obesity, higher glucose or proteinuria. High age-based corrected mGFR was a modest improvement over high overall corrected mGFR, because it does not associate with younger age, but associated with obesity, higher fasting glucose and proteinuria. High age-based uncorrected mGFR was superior to high age-based corrected mGFR, as it associated more strongly with risk factors (hypertension, higher glucose and obesity), proteinuria, larger kidney volume, larger glomerular size and higher single-nephron GFR. High age-height-gender–based uncorrected mGFR had some advantages over high age-based uncorrected mGFR by not being predominantly male and by being less associated with high nephron number.
The 95th percentile thresholds for CKD-EPI eGFR (and the FAS eGFR) were considerably lower than that for mGFR. This is not unexpected, as the CKD-EPI equation is known to underestimate GFR in healthier populations [29] since the equation was derived using a majority of CKD patients [30, 31]. Serum creatinine–based eGFR also has less measurement error than mGFR by urinary iothalamate clearance [16] and this may also contribute to a lower 95th percentile eGFR threshold than mGFR threshold. For these reasons, thresholds for high GFR derived with mGFR should not be used for eGFR and vice versa.
Demographics are an important consideration when interpreting a high GFR. There is a physiologic decrease in GFR with healthy ageing related to nephron loss without a compensatory increase in single-nephron GFR [7, 28]. An age-based threshold for high GFR helps to avoid labeling younger adults with hyperfiltration. We did not find a gender difference in high age-based mGFR and the race differences were modest. Race differences in nephron number have been reported in autopsy kidneys [32]. High age-based eGFR associated with women and black race. Gender and black race are coefficients in the equation used for eGFR, but these coefficients are inaccurate in populations with a higher GFR (such as kidney donors) [31, 33]. Since men have more nephrons but similar single-nephron GFR compared with women [7], high uncorrected mGFR will inherently label more men as having hyperfiltration compared with women unless gender is considered in the threshold definition. The gender difference is also eliminated with high corrected mGFR, because body surface area (BSA) accounts for the larger size (and more nephrons) in men compared with women.
We found higher BMI and fasting glucose to be associated with high age-based mGFR. This is similar to other studies that have demonstrated higher mGFR but not higher creatinine- or cystatin C–based eGFR in people with impaired fasting glucose [34]. Other studies have linked higher BMI, higher waist:hip ratio, insulin resistance, diabetes and metabolic syndrome to high GFR [35–41]. We extended this finding by showing that the association of obesity with high GFR is part of the same pathway as larger kidneys and larger glomeruli. Specifically, higher BMI was less strongly associated with high age-based uncorrected mGFR after adjustment for kidney volume in potential donors or after adjustment for glomerular volume in actual donors. Body surface area is itself a marker of obesity. Thus ‘correcting’ mGFR to ‘per 1.73 m2’ adjusts for the effect of obesity on hyperfiltration, effectively weakening high mGFR as a marker of hyperfiltration.
Urine albumin also associated with high age-based uncorrected mGFR. An increase in mGFR detects the onset of hyperfiltration and associates with albuminuria [8]. Hyperfiltration likely causes albuminuria via the disorganized glomerular structure with glomerular hypertrophy [42]. We also found high age-based uncorrected mGFR to be associated with higher urine albumin, but after adjusting for kidney volume, this association was no longer evident. Interestingly, in actual donors, high age-based uncorrected mGFR associated with higher urine albumin even after adjusting for glomerular volume and nephron number. The reason for this is not entirely clear but may reflect reduced tubular reabsorptive capacity rather than glomerulomegaly as the primary mechanism for hyperfiltration causing albuminuria in a relatively healthy population.
Limitations of this study include the selection on health implicit with the study of living kidney donors. Because of this, important comorbidities known to associate with hyperfiltration (specifically, diabetes and CVD) could not be studied. However, kidney donors are excluded for low, not high, GFR levels and represent a unique setting where glomerular volume, nephron number and single-nephron GFR can be measured. The kidney donors were predominantly white (92%), although we were able to evaluate some race differences with the large sample size.
In summary, we found high mGFR thresholds were much better markers of single-nephron hyperfiltration than high eGFR thresholds. High age-based uncorrected mGFR thresholds were the best approach for detecting hyperfiltration with mGFR, though high age-height-gender–based thresholds were only slightly inferior and avoided labeling mostly men with hyperfiltration. Since high mGFR is both a marker of early subclinical kidney disease (larger glomeruli) and very good kidney health (increased nephron number), it should be interpreted with caution.
FUNDING
This study was supported with funding from the National Institutes of Health, National Institute of Diabetes and Digestive and Kidney Diseases (R01 DK090358).
CONFLICT OF INTEREST STATEMENT
None declared.


Comments