


Abstract
Glomerular filtration rate (GFR) is commonly used to monitor chronic kidney disease (CKD) progression, but its validity for evaluating kidney function changes over time has not been comprehensively evaluated. We assessed the performance of creatinine-based equations for estimating GFR slope according to patient characteristics and specific CKD diagnosis.
In the NephroTest cohort study, we measured GFR 5324 times by chromium 51–labeled ethylenediamine tetraacetic acid renal clearance in 1955 adult patients with CKD Stages 1–4 referred to nephrologists (Stages 1–2, 19%) and simultaneously estimated GFR with both the Chronic Kidney Disease Epidemiology Collaboration (CKD-EPI) and Modification of Diet in Renal Disease (MDRD) equations for isotope dilution mass spectrometry traceable creatinine; absolute and relative GFR slopes were calculated using a linear mixed model.
Over a median follow-up of 3.4 [interquartile range (IQR) 2.0–5.6] years, the decline in mean absolute and relative measured GFR (mGFR) and CKD-EPI and MDRD estimated GFR (eGFR) was 1.6 ± 1.2, 1.5 ± 1.4 and 1.3 ± 1.3 mL/min/1.73 m2/year and 5.9 ± 5.3, 5.3 ± 5.3 and 4.8 ± 5.2%/year, respectively; 52% and 55% of the patients had MDRD and CKD-EPI eGFR slopes within 30% of mGFR slopes. Both equations tended to overestimate the GFR slope in the youngest patients and underestimate it in the oldest, thus producing inverse associations between age and mGFR versus eGFR slope. Other patient characteristics and specific CKD diagnoses had little effect on the performance of the equations in estimating associations.
This study shows little bias, but poor precision in GFR slope estimation for both MDRD and CKD-EPI equations. Importantly, bias strongly varied with age, possibly due to variations in muscle mass over time, with implications for clinical care and research.
INTRODUCTION
Chronic kidney disease (CKD) is common (13.4% worldwide) and its prognosis varies substantially from one individual to another [1, 2]. Evaluating its progression is therefore critical for identifying patients at high risk for end-stage renal disease (ESRD), for both clinical and research purposes. The glomerular filtration rate (GFR) is considered the best overall measure of kidney function and has been shown to be a valid surrogate endpoint for ESRD in observational and interventional studies [3, 4], but measuring GFR with current reference methods is cumbersome and expensive. Over the past 20 years, several GFR estimation equations have been developed, with the Modification of Diet in Renal Disease (MDRD) and the Chronic Kidney Disease Epidemiology Collaboration (CKD-EPI) equations used most widely [1, 5, 6]. Although cross-sectional studies, including the NephroTest cohort, have extensively examined the performance of these equations [7–10], little is known about their validity for evaluating kidney function changes over time [11–19].
Three studies have assessed the longitudinal performance of the MDRD and CKD-EPI GFR estimation equations within the same data sets used to develop these equations [12–14]. Such internal validation, however, is likely to overestimate performance. External validation studies are scarce, often use inappropriate statistical methods and are based on small samples or specific patient populations with diabetes or polycystic kidney disease (PKD) [15–19]. No large study has evaluated the longitudinal performance of the MDRD and CKD-EPI equations in CKD patients with various types of kidney disease. In this context, the new full-age spectrum (FAS) equation, developed for estimating GFR with a single equation for any age patient is also worth evaluating [20].
In this study we assessed the longitudinal performance of both these equations, compared with chromium 51–labeled ethylenediamine tetraacetic acid (51Cr-EDTA) renal clearance in estimating absolute and relative GFR slopes among patients with CKD Stages 1–4. We also evaluated the accuracy of these equations according to patient characteristics and specific kidney disease as well as their consistency in estimating associations with well-established risk factors for CKD progression.
MATERIALS AND METHODS
Patients and study design
The NephroTest study is a prospective hospital-based cohort that enrolled 2084 adult patients with CKD (Stages 1–5) [21], neither on dialysis nor living with a kidney transplant, who were referred by nephrologists to three physiology departments for extensive annual workups. After exclusion of 127 patients with baseline measured GFR (mGFR) <15 mL/min/1.73 m2 (Stage 5) and 2 with missing serum creatinine data, the analysis included 1955 patients. The NephroTest study was approved by an ethics committee (CCTINS MG/CP09.503).
Data and measurements
Clinical and laboratory data were recorded in fasting patients during a standardized, 5-h morning visit to the physiology departments at enrolment and during follow-up. They included demographics, primary renal diagnosis, medical history, height and weight, resting blood pressure (BP) and medications. Diabetes was either reported from medical records or defined as fasting glycaemia ≥7 mmol/L or antidiabetic treatment. As previously described, only diabetes patients with biopsy-proven glomerulopathy and those with a history of albuminuria >300 mg/g creatininuria and of other microangiopathy (retinopathy and/or neuropathy) were classified as having diabetic kidney disease (DKD) [22].
Body surface area (BSA) was calculated by the Dubois and Dubois formula. Elevated BP was defined as a systolic BP ≥140 mmHg and/or a diastolic BP ≥90 mmHg. Urinary albumin:creatinine ratio (ACR) was measured in 81% of the patients and estimated from the protein:creatinine ratio in another 17% by stochastic regression imputation [23].
At each visit, GFR was measured by 51Cr-EDTA renal clearance [7]. Briefly, 1.8–3.5 MBq of 51Cr-EDTA (GE Healthcare, Velizy, France) was injected intravenously as a single bolus. After allowing 1 h for distribution of the tracer in the extracellular fluid, the average renal 51Cr-EDTA clearance was determined over five to six consecutive 30-min clearance periods (coefficient of variation 8.4 ± 5.0%). Blood was drawn at the midpoint of each clearance period and up to 300 min after injection. The radioactivity measurements in 1-mL plasma and urine samples were carried out on a Packard Cobra 3-inch crystal-ray well counter (Packard Bioscience, Boston, MA, USA).
When timed urine samples could not be obtained, which occurred for 319 (6%) of 5324 measurements, plasma clearance of 51Cr-EDTA was calculated according to a simplified method described by Brochner-Mortensen [24].
We concurrently measured plasma creatinine by using a modified kinetic Jaffe colorimetric method on a Bayer RA-XT then a Konelab 20 analyser (Thermo Fisher Scientific, Waltham, MA, USA) from the study start to 2008 and an enzymatic assay (KoneLab, Thermo Fisher Scientific) thereafter [25]. Prior to the availability of isotope dilution mass spectrometry (IDMS) standard reference materials (SRMs), a plasma ultrafiltration pre-analytical step was applied discarding most of the plasma protein-associated non-creatinine chromogens to ensure the accuracy of measurements. Linearity of the measurements from the Jaffe assay was verified using spiked plasma samples from normal subjects in which increasing amounts of desiccated creatinine hydrochloride were added. Internal quality controls showed a coefficient of variation of 2.3% during the Jaffe assay period as previously described [7]. Secondarily, we standardized all creatinine values obtained with the Jaffe assay to IDMS-traceable creatinine assay with reference to international SRM NIST-SRM-967 (National Institute of Standards and Technology; http://www.nist.gov/srm) and IRMM-BCR-573, BCR-574, BCR-575 (Institute for Reference Materials and Measurements; http://irmm.jrc.ec.europa.eu/html/homepage.htm) as previously described [26]. Creatinine assay calibration was challenged against SRMs at least twice per year to ensure the stability of the measurement overtime. Absolute accuracy of our IDMS-calibrated enzymatic assay was assessed against gas chromatography–mass spectrometry (GC-MS) determined plasma pools in a national interlaboratory study providing coefficients of variation of 3.9, 2.3, 1.1, 1.5 and 1.3% for 46.3, 76.6, 99.2, 151.4 and 175.2 µM reference value samples, respectively [25]. GFR was then estimated by the CKD-EPI equation, the MDRD equation for IDMS-traceable plasma creatinine and the FAS equation. Over the study period, the 1955 patients included in this analysis underwent a total of 5324 simultaneous mGFR and creatinine measurements, of which 2738 were performed by enzymatic assay.
Statistical analyses
In the literature, both absolute and relative slopes are studied. Thus we estimated both absolute and relative slopes for mGFR and eGFR by using a linear mixed model with random intercept and slope. The advantage of the linear mixed model is that it requires neither the same number of measures per patient nor that these measures are taken regularly or at the same time points for all patients. It also allows accounting for patients with only one GFR measured at baseline to reduce selection bias under the missing-at-random assumption [27]. Indeed, because patients with a single measure had lower baseline GFR values (mean mGFR 38.1 mL/min/1.73 m2) as compared with those with two or more (mean mGFR 46.2 mL/min/1.73 m2) and were more rapidly dialysis dependent after inclusion, excluding them from the analysis may overestimate the mean baseline GFR level. Therefore we used all 1955 patients from the cohort, including 796 with a single GFR measure, as previously published [28]. Relative slopes were estimated with linear mixed models with log-transformed GFRs [29]. The parameter estimate can be interpreted as a relative slope expressed as the percent (%) per year after the following transformation: [exp(estimate)−1]×100. Of note, as equation-based eGFRs were adjusted for BSA, mGFR was also adjusted to baseline BSA in the main analyses.
We then assessed the mean bias, precision, prediction accuracy and agreement of the three GFR estimation equations compared with 51Cr-EDTA renal clearance as the reference. Bias was defined as the difference between the mGFR and eGFR slopes, that is, mGFR slope−eGFR slope, expressed as mL/min/1.73 m2/year for absolute and percent per year for relative slopes. Precision was defined as the standard deviation (SD) of the bias. Prediction accuracy was estimated by the percentage of patients with eGFR slopes within 10% and 30% of their mGFR slopes, and the 95% limits of agreement (LoAs) were calculated as mean bias ± 2 SD around the bias [30]. We also conducted several sensitivity analyses. We removed the correction for BSA from the CKD-EPI and MDRD equations and assessed mGFR and BSA-unadjusted eGFR slopes in mL/min/year. Second, because previous longitudinal studies were restricted to patients with at least two GFR measurements, we repeated our evaluation in the 1157 patients with at least two measurements. Third, we assessed whether patients with an eGFR value >30% of the mGFR value at baseline were at higher risk to have an eGFR slope >30% of the mGFR slope.
To assess the accuracy of equations according to patient characteristics and diagnosis, we calculated GFR slopes according to age (<40, 40–59, 60–74, ≥75 years), gender, ethnicity, baseline GFR (<30, 30–44, 45–59, ≥ 60 mL/min/1.73 m2), high BP, diabetes, body mass index (BMI) (<20, 20–24, 25–29, ≥30 kg/m2), ACR (<3, 3–29, ≥30 mg/mmol) and diagnosis [DKD, hypertension (HT) or vascular nephropathy, glomerulonephritis (GN), PKD, tubulointerstitial nephropathy (TIN) and other or undetermined] by extending the linear mixed model with each of these risk factors as fixed and random factors. Likewise, to assess the consistency of equations in analysing associations with known CKD progression risk factors, we used linear mixed models with fixed and random components to provide adjusted estimates of the mean slope difference according to the above covariates (except CKD diagnosis), separately for mGFR and MDRD and CKD-EPI eGFRs. These multivariable analyses were based on 1869 patients with complete data for all covariates, that is, 96% of the overall sample.
Finally, to explain the differences we observed between mGFR and eGFR slopes by age group, we performed two additional analyses. First, we examined the impact of the factor for age in the CKD-EPI and MDRD equations on eGFR slopes by estimating the decrease in GFR according to age, from 20 to 90 years, for a white man for various serum creatinine values (1.4, 2, and 5 mg/dL; 124, 177, and 443 µmol/L). Second, using linear mixed models, we studied the impact of age on changes in serum creatinine levels over time independent of GFR by assessing serum creatinine slope by age group adjusted for baseline mGFR. All analyses were performed with R (version 3.3.1; www.r-project.org). Linear mixed models were estimated with the lme function and individual slopes were predicted with the fitted function of the nlme, version 3.1–131.1 package.
RESULTS
Patient characteristics
The 1955 participants were mostly white men (Table 1). More than a third had a BP >140/90 mmHg at baseline, 90% had a history of hypertension and about a quarter had a history of diabetes. At baseline, 26, 32, 23 and 19%, respectively, had an mGFR of 15–30, 30–44, 45–60 and >60 mL/min/1.73 m2. Over a median 3.4-year follow-up [interquartile range (IQR) 2.0–5.6], 59% had at least two visits and 25% at least four. In total, 5324 GFR values were simultaneously measured and estimated. The median duration between two consecutive visits was 1.1 (IQR 1.0–1.5) years.
Baseline characteristics of the 1955 NephroTest cohort patients included in the study analysis
| Mean ± SD, median (IQR) or % (n) | Missing (n) | Range | |
|---|---|---|---|
| Age (years) | 58.7 ± 15.2 | 17–88 | |
| Women | 33.1 (647) | ||
| African origin | 13.9 (259) | 94 | |
| Primary kidney disease | |||
| DKD | 10.0 (195) | ||
| GN | 14.1 (275) | ||
| HT | 26.0 (508) | ||
| PKD | 5.7 (111) | ||
| TIN | 9.0 (176) | ||
| Other or undetermined | 35.3 (692) | ||
| Diabetes | 27.5 (535) | 7 | |
| Hypertension | 90.9 (1769) | ||
| BP ≥ 140/90 (mm Hg) | 36.4 (689) | 62 | |
| BSA (m2) | 1.83 ± 0.22 | 0.94–2.60 | |
| BMI (kg/m²) | |||
| <20 | 6.8 (132) | 13–51 | |
| 20–24 | 34.5 (676) | ||
| 25–29 | 37.3 (730) | ||
| ≥30 | 21.4 (419) | ||
| ACR (mg/mmol) | 55 | 0.1–879 | |
| 3–29 | 33.8 (642) | ||
| ≥30 | 30.6 (582) | ||
| mGFR (mL/min/1.73 m2) | 44.0 ± 19.0 | 15–135 | |
| CKD-EPI eGFR (mL/min/1.73 m2) | 46.4 ± 22.2 | 6.9–155 | |
| MDRD eGFR (mL/min/1.73 m2) | 44.5 ± 20.9 | 6.8–212 | |
| Follow-up (years) | 3.4 (2.0–5.6) | 0–13 | |
| Number of visits | 1–13 | ||
| 1 | 40.7 (797) | ||
| 2 | 21.7 (424) | ||
| 3 | 12.7 (248) | ||
| ≥4 | 24.9 (488) |
Overall performance of GFR estimation equations
The mean absolute mGFR decline was 1.6 ± 1.2 mL/min/1.73 m2/year and the relative decline was 5.9 ± 5.3%/year. Bias was smaller, prediction accuracy higher and 95% LoA narrower for the CKD-EPI equation than for the MDRD equation, for both absolute and relative slopes (Table 2 and Supplementary data, Figures 1 and 2). As compared with the CKD-EPI equation, the FAS equation had similar absolute bias but higher relative bias and slightly better prediction accuracy. The sensitivity analyses produced similar results with BSA-unadjusted eGFR and mGFR expressed in mL/min/year and when we restricted the analysis to the 1157 patients with a least two GFR measurements (Supplementary data, Tables S1 and S2). Patients with inaccurate cross-sectional eGFRs did not appear to have a higher risk of inaccurate slopes based on the Bland–Altman plot and LoA was similar in this subgroup (Supplementary data, Figure S3).
Mean GFR slopes and overall performance of estimating equations
| Absolute slope (mL/min/1.73 m2/year) | Mean ± SD | Bias ± SD | 95% LoA | P10 (%) | P30 (%) |
|---|---|---|---|---|---|
| mGFR | −1.6 ± 1.2 | ||||
| CKD-EPI eGFR | −1.5 ± 1.4 | −0.1 ± 1.1 | −2.1–2.0 | 20 | 55 |
| MDRD eGFR | −1.3 ± 1.3 | −0.3 ± 1.0 | −2.3–1.7 | 17 | 52 |
| FAS eGFR | −1.5 ± 1.0 | −0.1 ± 1.0 | −1.9 to −1.8 | 23 | 62 |
| Relative slope (%/per year) | |||||
| mGFR | −5.9 ± 5.3 | ||||
| CKD-EPI eGFR | −5.3 ± 5.3 | −0.5 ± 2.7 | −5.8–4.7 | 22 | 57 |
| MDRD eGFR | −4.8 ± 5.2 | −1.0 ± 2.7 | −6.3–4.2 | 18 | 53 |
| FAS eGFR | −4.9 ± 4.3 | −0.9 ± 2.7 | −6.1–4.3 | 23 | 59 |
P10, percentage of patients with eGFR slopes within 10% of the mGFR slope; P30, percentage of patients with eGFR slopes within 30% of the mGFR slope.
GFR slopes according to patient characteristics
Crude eGFR slopes tended to be steeper in younger and flatter in older patients than their mGFR slopes, resulting in apparently different trends according to age for mGFR and eGFR (Figure 1, Supplementary data, Figure S4). In the multivariable analyses, the absolute mGFR slope was not significantly associated with age, while eGFR slopes strongly were (Table 3). Both mGFR and eGFR absolute slopes were steeper in patients with higher, compared with lower, GFRs at baseline (Figure 1). As expected, the relative slope was steeper for patients with lower baseline GFRs, because a 1-mL/min/1.73 m2/year GFR decrease, for example, results in a higher percentage decline for a patient starting at a GFR of 15 rather than 60 mL/min/1.73 m2. Crude GFR decline did not differ significantly by gender or ethnicity (data not shown) but was stronger at higher ACR ratios, similarly whether measured or estimated (Figure 2). In contrast, while mGFR slope was significantly steeper for patients with high BP or diabetes compared with their counterparts without these conditions, use of either eGFR equation weakened these associations. Neither mGFR or eGFR slope differed significantly according to BMI category, although absolute eGFR slopes tended to be steeper in patients with low BMI and flatter in those with high BMI than absolute mGFR slopes (Figure 2). Nevertheless, in the multivariable analyses, the effect estimates for gender, diabetes, high BP, ACR and baseline GFR on absolute GFR slope were similar in direction and magnitude for both mGFR and eGFR (Table 3).
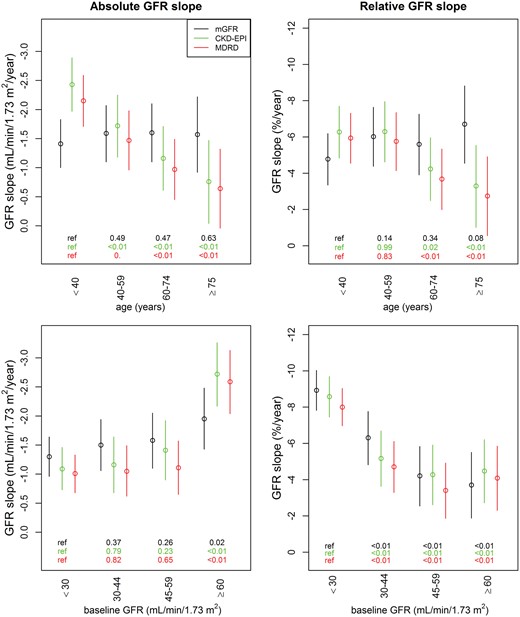
Absolute (left) and relative (right) eGFR and mGFR slopes by baseline age and GFR categories. mGFR slopes are in black, CKD-EPI eGFR slopes in green and MDRD eGFR slopes in red. The P-values of GFR slope differences according to baseline age and GFR categories are shown at the bottom of each figure.
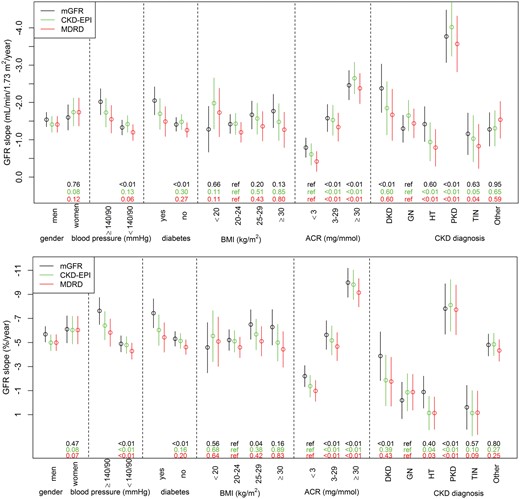
Absolute (upper) and relative (lower) eGFR and mGFR slopes according to baseline patient characteristics. mGFR slopes are in black, CKD-EPI eGFR slopes in green and MDRD eGFR slopes in red. The P-values of GFR slope differences between categories of baseline patient characteristics are shown at the bottom of each figure. Other: other or undetermined diagnosis.
Multivariable analyses of risk factors associated with mGFR or eGFR slopes (in mL/min/1.73 m2/year), linear mixed models
| mGFR | P-value for linear trend | CKD-EPI eGFR | P-value for trend | MDRD eGFR | P-value for trend | |
|---|---|---|---|---|---|---|
| Slopea (mL/min/1.73 m2/year), mean (95% CI) | 0.77 (−0.07–1.50) | 0.34 (−0.41–1.09) | 0.09 (−0.39–0.95) | |||
| Age <40 (years) | ref | 0.49 | ref | <0.01 | ref | <0.01 |
| 40–59 | −0.28 (−0.79–0.22) | 0.30 (−0.24–0.85) | 0.36 (−0.14–0.86) | |||
| 60–74 | −0.57 (−1.12–0.01) | 0.53 (−0.03–1.13) | 0.62 (0.07–1.12) | |||
| ≥75 | −0.73 (−1.12 to −0.01) | 0.73 (−0.05–1.52) | 0.86 (0.15–1.58) | |||
| Women versus men | −0.27 (−0.65 to −0.07) | −0.40 (−0.78 to −0.02) | −0.40 (−0.71–0.0) | |||
| ACR <3 (mg/mmol) | ref | <0.01 | ref | <0.01 | ref | <0.01 |
| 3–29 | −1.06 (−1.46 to −0.66) | −1.61 (−1.59 to −0.73) | −1.12 (−1.52 to −0.73) | |||
| ≥30 | −2.01 (−2.45 to −1.57) | −2.28 (−2.74 to −1.81) | −2.12 (−2.55 to −1.69) | |||
| Baseline GFR <30 (mL/min/1.73 m²) | ref | <0.01 | <0.01 | ref | <0.01 | |
| 30–44 | −0.51 (−0.96 to −0.07) | −0.30 (−0.78–0.19) | −0.33 (−0.76–0.10) | |||
| 45–59 | −0.83 (−1.32 to −0.34) | −0.61 (−1.13 to −0.09) | −0.43 (−0.89–0.03) | |||
| ≥60 | −1.31 (−1.85 to −0.77) | −1.93 (−2.50 to −1.36) | −1.97 (−2.51 to −1.42) | |||
| Diabetes versus no diabetes | −0.34 (−0.75–0.08) | −0.26 (−0.70–0.19) | −0.24 (−0.65–0.17) | |||
| BP ≥140/90 versus <140/90 (mmHg) | −0.30 (−0.67–0.08) | −0.27 (−0.67–0.14) | −0.26 (−0.63–0.11) | |||
| BMI <20 (kg/m²) | −0.11 (−0.74–0.53) | −0.62 (−1.30–0.05) | −0.61 (−1.24 to −0.01) | |||
| 20–24 | ref | 0.35 | ref | 0.64 | ref | 0.78 |
| 25–29 | −0.18 (−0.58–0.21) | −0.44 (−0.87–0.02) | −0.41 (−0.80–0.02) | |||
| ≥30 | −0.01 (−0.50–0.48) | −0.16 (−0.69–0.36) | −0.11 (−0.59–0.38) |
Mean slope estimated for a non-diabetic man <40 years old with baseline GFR <30 mL/min/1.73 m2, ACR <3 mg/mmol, normal BP and BMI 20–24 kg/m2.
ref, reference.
The sensitivity analysis showed similar results with the BSA-unadjusted eGFR and mGFR, particularly regarding the impact of BMI at baseline (Supplementary data, Figure S5). Of note, BMI changes over time were too small to explain differences (0.12 kg/m2/year). The relative slope showed slightly less bias between mGFR and eGFR than the absolute slope did. The adjusted effect estimates on relative mGFR and eGFR slopes showed similar trends except for the associations with baseline GFR (Supplementary data, Table S3).
GFR slopes according to CKD diagnosis
Both relative and absolute eGFR and mGFR slopes were quite similar for each diagnosis considered; the decline was significantly steeper for PKD than for other diagnoses. Other renal diagnoses showed no difference in bias, except for diabetic and vascular nephropathies, which were steeper for mGFR but not eGFR slopes (Figure 2).
Impact of age on serum creatinine evolution
Independent of baseline mGFR, the increase in serum creatinine was significantly less in the older (>75 years) than in the younger (20–40 years) age categories. The estimated average increase was 0.17 mg/dL/year (15.3 µmol/L/year) in the 20–40 age category and 0.04 mg/dL/year (3.8 µmol/L/year) in the > 75 age category for patients with baseline mGFR in the range of 30–44 mL/min/1.73 m2 (Supplementary data, Table S4).
Impact of the factor for age in estimation equations for GFR
The calculation of the impact of the embedded correction factor for age in eGFR equations on annual eGFR decline independent of any other change in provided parameters shows that of age alone is slightly steeper in the younger (20–40 years) than in the older (>75 years) age category, for example, 0.31 versus 0.21 mL/min/1.73 m2/year, respectively, for white men with a serum creatinine level of 2 mg/dL (177 µmol/L) using the CKD-EPI equation. The discrepancy between age classes is slightly more pronounced using the MDRD formula (Supplementary data, Table S5). The magnitude of this age-correction effect alone on the mean annual GFR decline is small, but more pronounced at low than high creatinine levels, for example, 1.4 mg/dL (124 µmol/L) and 5 mg/dL (443 µmol/L) resulted in eGFR decreases of, respectively, 0.47 and 0.10 mL/min/1.73 m2/year with the CKD-EPI equation.
DISCUSSION
In this large cohort of well-phenotyped patients, the MDRD and CKD-EPI equations showed little bias in estimating GFR changes over time across a wide range of kidney disease diagnoses and renal function levels, but their precision was poor, with large differences at the individual level. The three studied equations tended to underestimate absolute and relative mGFR slopes slightly at low baseline mGFRs (<60 mL/min/1.73 m2), the MDRD equation more so than the CKD-EPI and FAS equations, and to overestimate the absolute mGFR slope at high baseline mGFRs (>60 mL/min/1.73 m2). The most important and novel finding is that bias in slope estimation varied strongly with age for all equations. In younger patients, eGFR slope tended to be steeper than mGFR slope, whereas the opposite was true in older patients. These findings have important implications for clinical practice and research.
Although it is difficult to compare our findings with those of others, because of differences in population characteristics, baseline mGFR levels, the tracer used to measure GFR or the method used to estimate slope, the overall accuracy of the MDRD and CKD-EPI equations over time observed in the NephroTest cohort is consistent with that from most, but not all, previous internal and external validation studies [27]. First, the longitudinal assessment of the CKD-EPI equation in 3531 participants from the four datasets used to develop it found no statistically significant difference between average eGFR and mGFR decline in the overall sample (with GFR measured by urinary clearance of 125I-iothalamate), 2.22 versus 2.25 mL/min/1.73 m2/year, respectively [14]. Nevertheless, this difference was slightly greater for some of the individual datasets contributing data to the CKD-EPI; notably it was statistically significant in theAfrican American study of Kidney Disease and Hypertension (AASK) study. Their baseline mGFR range was 20–65 mL/min/1.73 m2 and the mGFR decline was 1.89 versus 2.19 mL/min/1.73 m2/year for eGFR (P < 0.001). Second, using data from the chronic phase of the MDRD Study A, which enrolled 542 patients with non-diabetic CKD (baseline GFR 25–55 mL/min/1.73 m2), the MDRD eGFR decline underestimated the mGFR decline by 28% (2.8 ± 7.1 versus 3.9 ± 7.2 mL/min/1.73 m2/year, respectively) [13]. This difference was greater than for the CKD-EPI equation [14] and thus was consistent with our observation of lower overall bias for the CKD-EPI than the MDRD equation.
The greater accuracy of the CKD-EPI equation has also been shown in a small study of non-diabetic patients, with mean GFR declines very similar to those in our study: 1.5 ± 2.0 mL/min/1.73 m2/year for mGFR, 1.4 ± 1.8 for CKD-EPI eGFR and 1.1 ± 1.7 for MDRD eGFR [15]. In contrast to these studies and our study, Gaspari et al. [11] reported a large difference between eGFR and mGFR slopes in 449 diabetic patients. In the Chronic Renal Insufficiency Cohort study, the mean eGFR and mGFR decline were similar (−3.5 mL/min/1.73 m2/year) [31]. Finally, Rule et al. [16] studied the relative GFR decline in young patients with autosomal dominant PKD. Their mean mGFR decline was 1.5 ±9.3%/year, whereas their eGFR decline was 3.0 ± 7.0%/year. In our study, patients with PKD had simultaneously steeper and similar eGFR and mGFR slopes.
This is the first study to compare the decline assessed by eGFR and mGFR between kidney disease types. The performance of eGFR and mGFR was similar in assessing the decline for most diagnoses, except for diabetic and vascular nephropathies, both of which declined more steeply with mGFR than eGFR slope. We accordingly confirm the steeper mGFR slope found in diabetic patients [11, 17]. As expected, high BP, diabetes and albuminuria were identified as significant risk factors for faster progression of both mGFR and eGFR decline. These results confirm the predictors identified for faster progression in young patients with type 1 diabetes or PKD [16, 17, 32, 33]. To our knowledge, however, no study has estimated CKD-EPI or MDRD eGFR slopes or mGFR slopes according to multiple risk factors. However, Padala et al. [14] estimated the difference between eGFR and mGFR decline with mixed models and showed in two populations that age, gender and ethnicity were associated with the difference between eGFR and mGFR slope and Caplin et al. [34]showed that an increase in urinary protein excretion (g/24 h/year) resulted in a steeper eGFR decline. It might be expected that the difference we found in the performance of slope by age groups is due to the age term in the MDRD and CKD-EPI equations. However, calculating the distinct impact of age in these two equations showed that the difference in eGFR decline due only to the effect of age is very small and similar for younger and older patients and thus suggests that age in the equation does not explain the reverse effect of age on mGFR and eGFR slopes. We therefore hypothesized that the increase over time in serum creatinine differs in younger and older patients. The serum creatinine slope according to age group, adjusted for baseline GFR, supports this hypothesis; serum creatinine, adjusted for baseline mGFR, rose four times higher in younger than older patients. Potential explanations may be that the extrarenal determinants of serum creatinine level, including the decrease of muscle mass with aging, provide the most likely hypothesis. Such a decrease in urinary creatinine excretion with age was previously observed in the NephroTest cohort [35]. It is worth noting that the FAS equation did not reduce bias with age in estimating GFR slope in this cohort.
The first major strength of our study is its large sample size and long follow-up with >5000 GFR measurements in participants with a wide range of kidney diseases and renal function levels, which makes the results generalizable to a large CKD population and made subgroup analyses possible. Second, GFR was measured by renal clearance of 51Cr-EDTA, a gold standard method [36, 37], and IDMS-traceable or corrected creatinine was concurrently measured in serum at each visit. Therefore our estimates of the difference between creatinine-based eGFR and ‘true’ GFR should be very reliable. Third, we used mixed models, techniques that are more robust than ordinary linear regression models, to determine slopes and assess changes over time in participants with varying numbers of measurements and durations of follow-up [27]. Finally, we studied both absolute and relative slopes and conducted several sensitivity analyses, including BSA-adjusted and BSA-unadjusted GFR, and a simulation study to elucidate the potential effect of the age term on eGFR slope.
We acknowledge some limitations in our study. First, a significant proportion of the patients had only one measurement. Nevertheless, as explained in the methods, including these patients in the analyses by using a linear mixed model reduces selection bias. In addition, the analysis restricted to the 1157 patients with a least two GFR values produced similar results [27]. Second, we used a linear mixed model, although we know that some patients may not have a linear slope. However, because mGFR and eGFR slopes were estimated with the same models, this flaw should not have affected our assessment of equation performance. Moreover, previous work has shown that slopes tend to be linear for most patients in this cohort [28]. Third, serum cystatin C was not available, and it is hypothesized that mixed equations based on creatinine and cystatin C may perform better by minimizing the internal variability of the estimate [38]. The assay to measure creatinine was also changed from Jaffe to enzymatic IDMS traceable over the course of the study, which may have introduced a slight bias (drift) over time. However, this bias was limited by our careful IDMS standardization of all creatinine values over time. Finally, the NephroTest study included a referred patient population that may affect generalizability to the general population.
The results of this study have important implications for research and clinical use. The overall performance of equations is similar to that of the mGFR slope. However, depending on the patient’s age, the eGFR slope may provide inaccurate estimates and inverse associations. In clinical practice, physicians should be aware that the eGFR slope may be overestimated in young patients and patients with low BMI and underestimated in older patients and those with high BMI, high BP or diabetes. Researchers should be aware that using eGFR decline instead of mGFR decline could lead to misclassification. Using eGFR decline as an inclusion criterion may introduce selection bias, and as an alternative endpoint in clinical trials or observational research may in some populations lead to inaccurate or biased estimates and associations. Further research is needed to investigate the effect of age on rising serum creatinine, to assess the longitudinal performance of cystatin C–based equations and the predictive performance of eGFR and mGFR decline with ESRD.
SUPPLEMENTARY MATERIAL
Supplementary data are available at ndt online.
AUTHORS’ CONTRIBUTIONS
M.Fl., M.Fr., J.-P.H. and P.H. contributed to data acquisition. M.H.C.v.R., M.M. and J.A.J.G.v.d.B. contributed to data analysis. M.H.C.v.R., M.M., J.A.v.d.B., M.Fr. and B.S. contributed to data interpretation. M.Fr. and B.S. were the research mentor and supervisor. Each author contributed important intellectual content during manuscript drafting or revision and accepts accountability for the overall work by ensuring that questions pertaining to the accuracy or integrity of any portion of the work are appropriately investigated and resolved.
CONFLICT OF INTEREST STATEMENT
The NephroTest CKD cohort study was supported by the following grants: INSERM GIS-IReSP AO 8113LS TGIR (to B.S.), French Ministry of Health AOM 09114 (to M.Fr.), INSERM AO 8022LS (to B.S.), Agence de la Biomédecine R0 8156LL (to B.S.), AURA (to M.Fr.) and Roche 2009-152-447 G (to M.Fr.). M.H.C.v.R. is supported by grants from the Radboud Institute for Health Sciences and the Dutch Kidney Foundation (150KK109). J.A.J.G.v.d.B. is supported by a grant from the Dutch Kidney Foundation (DKF14OKG07). We thank Jo Ann Cahn for her revision of the English in this manuscript. The authors declare that they have no other relevant financial interests. The results presented in this article have not been published previously in whole or part, except in abstract format.`
REFERENCES
Kidney Disease: Improving Global Outcomes (KDIGO) CKD Work Group.
National Kidney Foundation.


Comments