


Abstract
Chronic kidney disease (CKD) progression among German patients in a representative setting has not been described previously. The Verband Deutsche Nierenzentren and Chronic Kidney Disease Outcomes and Practice Patterns Study established a longitudinal observational cohort among German CKD patients to research variations in patient care and outcomes in real-world nephrology practices.
A cohort of CKD Stages 3 (25%) and 4 (75%) patients was established from German nephrologist-run CKD clinics in 2013–16. Linear models were used to determine the estimated glomerular filtration rate (eGFR) slope during follow-up and Cox models were used to assess outcomes of end-stage kidney disease (ESKD) and death.
A total of 1834 patients (median age 75 years, 58% male, 42% diabetics, median baseline eGFR 25 mL/min/1.73 m2) were followed for a median of 29 months. More than 50% had slow or no decline and 17% declined ≥5 mL/min/1.73 m2/year. After 4.5 years, the incidence of ESKD was 8% and of deaths without ESKD 16% among patients with eGFR ≥30 mL/min/1.73 m2 and 37% and 19% for eGFR <30 mL/min/1.73 m2. Adjusted models showed higher risks of ESKD or death for patients with worse kidney function at baseline, male sex, diabetes and higher blood pressure; a higher risk of ESKD with higher albuminuria; and a higher risk of death with older age or cardiovascular comorbidity.
Routine nephrology care of patients in Germany comprises mostly elderly patients, many with slow CKD progression. Identification of risk factors for CKD progression and mortality may help guide resources by closer follow-up of high-risk patients.
INTRODUCTION
The worldwide disease and socio-economic burdens of chronic kidney disease (CKD) are very high. In recent years the importance of medical implications and socio-economic consequences related to the treatment of CKD patient groups has been increasingly recognized [1–3]. In Germany, the prevalence of end-stage kidney disease (ESKD) is ∼950 patients per million population, and a survey-based study reported that 2.3% of the German population 18–79 years of age have an estimated glomerular filtration rate (eGFR) <60 mL/min/1.73 m2 [4]; however, a higher prevalence in Germany was described in the European CKD Burden Consortium [5]. Such estimates have also been made for other countries and areas showing different prevalences of CKD [5, 6].
In addition to its socio-economic impact, CKD has been associated with unfavourable clinical outcomes. In addition to the high risk of progressing to ESKD, CKD is recognized as a major cardiovascular risk factor [7–9] and patients with impaired kidney function exhibit, depending on CKD stage, several-fold increased mortality risks [10]. Interestingly, a previous report based on the analysis of CKD patients identified from a large managed care organization in the USA found that the probability of death in patients from different CKD stages was >2-fold higher compared with the probability of reaching ESKD, regardless of CKD stage [11]. Similar findings were reported in a cohort of patients from the international Chronic Kidney Disease Prognosis Consortium having eGFRs <30 mL/min/1.73 m2 [12]. A similar analysis performed in specialized CKD care clinics in the real-world setting is lacking.
Relatively little is known about patients with CKD who do not advance to ESKD due to low progression rates or due to a fatal event before reaching ESKD. The objectives of this work were to study the natural history of CKD in a population followed in nephrology clinics in Germany, to examine the prevalence of variables associated with CKD progression and to describe clinical outcomes (death and ESKD) over a 4.5-year observation period [13].
MATERIALS AND METHODS
Study design and data collection
The Chronic Kidney Disease Outcomes and Practice Patterns Study (CKDopps) is an ongoing prospective cohort study of non-dialysis, advanced CKD patients in national samples of nephrology clinics in Brazil, France, Germany, Japan and the USA [13]. In Germany, data are collected by the Forschungsnetzwerk Deutsche Nierenzentren (FNDN Scientific Network of Germany Kidney Centers) Registry, a network designed to develop an evidence base and inform patients, doctors and policymakers about disease course and practice variation among advanced CKD patients under nephrology care [14]. Nephrology practices from the Verband Deutsche Nierenzentren (DN, Network of Germany Kidney Centers) were included in the study as a representative national sample of practices, guaranteed by stratification by geographic location and centre size. Consecutive individual patients treated in these clinics, with eGFR between 15 and 60 mL/min/1.73 m2 at screening and who provided written consent, were enrolled in the study. The eGFR was calculated using the Modification of Diet in Renal Disease study equation, assuming serum creatinine measurements had not been calibrated to isotope dilution mass spectrometry. The frequency of visits to the clinic was defined according to the patients’ characteristics, CKD stage and risk of progression. Patient follow-up continued after the onset of dialysis and until death or departure from nephrology care.
An electronic data collection system, Qualitätssicherung Nephrologie und Transplantation (QuaNT), was used to collect patient-level information. Data included demographic characteristics, comorbid conditions, medications, hospitalizations and laboratory values measured during routine clinical care. Data are assessed for data quality by study coordinators and transmitted quarterly from the DN to the CKDopps data coordinating centre in Ann Arbor, MI, USA, for inclusion in CKDopps. This study includes German patients enrolled from 2013 Quarter 1 through 2016 Quarter 2, with longitudinal data through 2018 Quarter 2. The study was conducted with adherence to the Declaration of Helsinki and received research ethics board approval from Ethical and Independent Review Services (study number 14004-05). Patient consent was obtained from study participants.
Independent variables
The primary cause of CKD was determined by the patient’s attending physician and categorized using International Classification of Diseases, Tenth Revision (ICD-10) codes. Unspecified illness, unspecified immune disorder and unspecified kidney disorder were further grouped into an ‘other’ category for descriptive analyses. Comorbidities, including hypertension, diabetes and other cardiovascular conditions, were determined based on reported ICD-10 codes. For models assessing factors associated with outcomes (i) diabetes was treated as a three-category variable: diabetes as primary cause of CKD, diabetes as a comorbidity only, or neither (patients with other causes of CKD and without diabetes comorbidity) and (ii) heart failure, coronary artery disease, cerebrovascular disease and peripheral vascular disease were combined into a composite cardiovascular comorbidity indicator based on whether any of the individual comorbidities were present. Albuminuria, haemoglobin, parathyroid hormone, phosphate, calcium, blood pressure and body mass index were taken from the closest measurement to study entry (‘baseline’) within 1 year prior to the enrolment quarter. Albuminuria was categorized based on Kidney Disease Improving Global Outcomes (KDIGO) 2012 guidelines [15] using, in descending order of priority, spot urine albumin:creatinine ratio, spot urine protein:creatinine ratio, 24-h timed urine albumin, 24-h timed urine protein, or protein reagent strips. The ‘severely increased’ albuminuria category was also split into ‘very high’ and ‘nephrotic range’ (Table 1). Renin–angiotensin–aldosterone system inhibitor (RAASi) and statin prescriptions were recorded during the enrolment quarter.
Baseline demographic and clinical characteristics
| Characteristics | Overall | Baseline | Baseline |
|---|---|---|---|
| eGFR ≥30 mL/min/1.73 m2 | eGFR <30 mL/min/1.73 m2 | ||
| Patients, n | 1834 | 486 | 1348 |
| Age (years), median (IQR) | 75 (67–80) | 73 (64–78) | 75 (68–81) |
| Male (%) | 58 | 64 | 55 |
| Body mass indexa (kg/m2), mean (SD) | 29 (6) | 29 (5) | 29 (6) |
| Primary cause of CKDa,b (%) | |||
| Diabetes | 30 | 25 | 32 |
| Hypertensive renal disease | 33 | 35 | 33 |
| Glomerulonephritis | 9 | 10 | 9 |
| Hereditary disease | 4 | 3 | 4 |
| Tubulointerstitial disease | 6 | 8 | 6 |
| Other | 17 | 20 | 16 |
| Comorbidities (%) | |||
| Diabetesa | 42 | 39 | 42 |
| Hypertensiona | 85 | 86 | 85 |
| Heart failurea | 13 | 9 | 14 |
| Coronary artery diseasea | 28 | 29 | 28 |
| Cerebrovascular diseasea | 11 | 12 | 11 |
| Peripheral vascular diseasea | 20 | 16 | 21 |
| eGFR (mL/min/1.73 m2), median (IQR) | 25 (21–31) | 40 (35–48) | 23 (19–26) |
| Albuminuriac (%) | |||
| Normal to mildly increased | 19 | 27 | 16 |
| Moderately increased | 17 | 17 | 17 |
| Very high | 13 | 12 | 13 |
| Nephrotic range | 6 | 3 | 7 |
| Missing | 45 | 41 | 47 |
| Haemoglobina (g/dL), mean (SD) | 12 (2) | 13 (2) | 12 (2) |
| Parathyroid hormoned (pg/mL), median (IQR) | 103 (66–170) | 70 (49–100) | 118 (78–199) |
| Phosphatee (mg/dl), mean (SD) | 3.69 (0.76) | 3.30 (0.66) | 3.83 (0.75) |
| Calciumf (mg/dl), mean (SD) | 9.27 (0.63) | 9.39 (0.53) | 9.22 (0.65) |
| SBPg (mmHg), mean (SD) | 139 (19) | 136 (18) | 139 (20) |
| DBPg (mmHg), mean (SD) | 76 (11) | 76 (11) | 76 (11) |
| RAASi prescriptiong (%) | 79 | 80 | 78 |
| Statin prescriptiong (%) | 52 | 56 | 51 |
1–10% missing.
According to attending physician.
Albuminuria categories from KDIGO 2012 guidelines [15], where moderately increased is albumin 30–300 mg/day, albumin:creatinine ratio 30–300 mg/g, protein 150–500 mg/day, protein:creatinine ratio 150–500 mg/g or trace to 1+ protein reagent strip and severely increased is split into very high (albumin 300–2000 mg/day, albumin:creatinine ratio 300–2000 mg/g, protein 500–3000 mg/day, protein:creatinine ratio 500–3000 mg/g or 2+ protein reagent strip) and nephrotic range (higher than very high ranges).
49% missing.
Phosphate: mg/dL × 0.3229 = mmol/l.
Calcium: mg/dL × 0.2495 = mmol/l.
11–20% missing.
Statistical analysis
Descriptive statistics were used to summarize demographic and clinical characteristics of patients at baseline, overall, and by eGFR at baseline. Individual patient-level linear models were used to estimate changes in eGFR over each patient’s follow-up time. This analysis was restricted to 1571 patients with at least 6 months of eGFR data, which excluded 65 who reached ESKD before 6 months, 35 who died before 6 months and 163 lost to follow-up. Linearity of eGFR trajectories was assessed by calculating root mean squared error (RMSE) from each linear model. Cumulative incidences of ESKD, defined by dialysis or transplant, and death before ESKD were estimated separately by (i) eGFR at baseline (≥30 versus <30 mL/min/1.73 m2), (ii) eGFR at baseline and albuminuria category among patients with albuminuria data at baseline, (iii) eGFR at baseline and sex and (iv) eGFR at baseline and age tertiles (18–70, 71–78, 79–96 years). Cause-specific Cox models were used to assess associations between baseline patient characteristics and ESKD taking into account competing death events, while standard Cox models were used to assess associations between baseline patient characteristics and death, whether before or after ESKD. All models accounted for facility clustering with sandwich-type standard error estimates [16], were stratified by eGFR ≥30 versus <30 mL/min/1.73 m2 at baseline, and further adjusted for baseline eGFR as a continuous variable. Effect modification between diabetes and albuminuria was assessed using a Wald test of the interaction term. The functional form for effects of continuous variables was checked by assessing effect estimates in centiles. Missing data for all independent variables in Cox models were multiply imputed by chained equations [17] and results from 20 imputed datasets were combined for the final analysis using Rubin’s formula [18]. All statistical analyses were conducted using R software, version 3.4.0 (R Foundation for Statistical Computing, Vienna, Austria).
RESULTS
Of 1834 advanced CKD patients in the analysis, 486 had eGFR ≥30 mL/min/1.73 m2 at study entry and 1348 had eGFR <30 mL/min/1.73 m2. Over a median follow-up time of 29 [interquartile range (IQR) 13–51)] months, 456 progressed to ESKD and 448 died, with 277 deaths prior to ESKD and 171 deaths after ESKD. The median age was 75 (IQR 67–80) years and the majority of patients were male (58%). The predominant primary cause of CKD according to attending physicians was hypertensive kidney disease (33%) followed by diabetes (30%) (Table 1). The proportion of patients with hypertensive kidney disease as the primary cause of CKD increased with increasing age, while the proportion of patients with glomerulonephritis decreased with increasing age (Supplementary data, Figure S1a). Many patients had diabetes (42%), hypertension (85%) and other cardiovascular comorbidities (47% with either heart failure, coronary artery disease, cerebrovascular disease or peripheral vascular disease). A higher proportion of patients who had diabetes (as the primary cause of CKD or as a comorbidity) had cardiovascular comorbidities compared with those without diabetes (Supplementary data, Figure S1 b). Among the patients with albumin measured at baseline [55% (n = 1004)], the majority had normal to mildly increased albuminuria, particularly among patients with eGFR ≥30 mL/min/1.73 m2 at baseline. Many patients had a RAASi prescription at baseline (79%) and more than half had a statin prescription (52%).
Among patients with at least 6 months of follow-up, changes in eGFR were estimated over a mean follow-up time of 42 [standard deviation (SD) 19] months after baseline using a median number of eGFR measurements of 9 (IQR 5–15) among patients with eGFR ≥30 mL/min/1.73 m2 at baseline and 34 (SD 18) months and 11 (IQR 6–17) eGFR measurements among patients with eGFR <30 mL/min/1.73 m2 at baseline. The median time between visits was 3.0 (IQR 1.2–4.6) months among patients with eGFR ≥30 mL/min/1.73 m2 at baseline and 2.3 (IQR 1.2–3.4) months among patients with eGFR <30 mL/min/1.73 m2 at baseline. The median RMSE across patients was 2.1 (IQR 1.3–3.3) mL/min/1.73 m2. The mean change in eGFR was −2.1 (SD 5.3) mL/min/1.73 m2/year for the population as a whole, −2.3 (6.4) among patients with eGFR ≥30 at baseline and −2.0 (4.8) among patients with eGFR <30. More than half had slow or no decline (>−2 mL/min/1.73 m2/year) in eGFR. The prevalence of slow or no decline was 60% among patients with eGFR ≥30 mL/min/1.73 m2 at baseline and 56% among patients with eGFR <30 mL/min/1.73 m2 at baseline (Figure 1). About 25% of patients displayed a moderate eGFR decline (eGFR slope between −5 to −2 mL/min/1.73 m2/year) and 17% had a steep decline (eGFR slope <−5 mL/min/1.73 m2/year) during the study follow-up. Patients who were fast progressors (i.e. eGFR slope ≤−2 mL/min/1.73 m2/year) were younger and a greater proportion were male compared with patients who were slow progressors or had no decline (eGFR slope >2 mL/min/1.73 m2/year) (Supplementary data, Table S1). A greater proportion of fast progressors than slow/non-progressors had glomerulonephritis (14% versus 7%) and more severe albuminuria, while a smaller proportion had hypertension (25% versus 40%) as the primary cause of CKD. Fast progressors also had slightly higher mean systolic blood pressure (SBP) than slow/non-progressors (140 versus 137 mmHg).
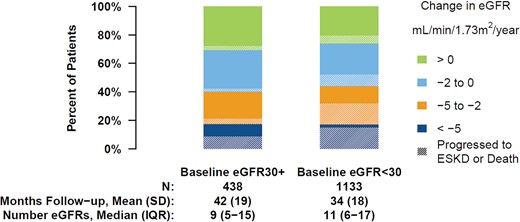
Yearly change in eGFR over the follow-up by eGFR at study entry. Analyses are restricted to patients with at least 6 months of eGFR data. Shading denotes the proportion in each category who progressed to ESKD or death during the study follow-up.
After 4.5 years of follow-up, the cumulative incidence of ESKD was 8% among patients with a baseline eGFR ≥30 mL/min/1.73 m2 and 37% among patients starting the study with eGFR <30 mL/min/1.73 m2. The cumulative incidence of death reached 16 and 19% for patients with eGFR ≥30 and <30 mL/min/1.73 m2, respectively (Figure 2). The cumulative incidence of ESKD differed substantially by albuminuria at baseline (Supplementary data, Figure S2), sex (Supplementary data, Figure S3) and age (Supplementary data, Figure S4). Among patients with normal to mildly increased albuminuria or moderately increased albuminuria and a baseline eGFR <30 mL/min/1.73 m2, the cumulative incidence of ESKD after 4.5 years of follow-up was <22% (Table 2). However, at the same baseline eGFR level, patients with severely increased albuminuria (very high and nephrotic range) presented a cumulative 56% incidence of ESKD. Male and female patients with baseline eGFR <30 mL/min/1.73 m2 had a 45 and 26% incidence of ESKD, respectively. Patients up to age 70, between 70 and 78 and >78 years with baseline eGFR <30 mL/min/1.73 m2 had cumulative incidences of ESKD of 43, 38 and 28%, respectively. While patients with baseline eGFR <30 mL/min/1.73 m2 up to age 78 years had higher cumulative incidences of ESKD compared with mortality, patients with baseline eGFR ≥30 mL/min/1.73 m2 and patients >78 years old had higher cumulative incidences of death compared with ESKD.
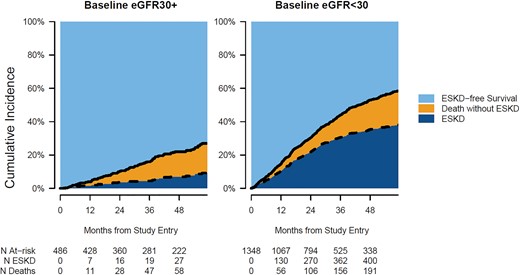
Cumulative incidence of ESKD, death without ESKD and ESKD-free survival by eGFR at study entry.
Cumulative incidences (%) of ESKD and death without ESKD by 4.5 years
| Factor | ESKD | Death without ESKD | ||
|---|---|---|---|---|
| eGFR ≥30 | eGFR <30 | eGFR ≥30 | eGFR <30 | |
| Overall | 8 | 37 | 16 | 19 |
| Albuminuria | ||||
| Normal to mildly increased | 5 | 14 | 11 | 26 |
| Moderately increased | 3 | 22 | 16 | 21 |
| Severely increased | 17 | 56 | 13 | 13 |
| Gender | ||||
| Male | 12 | 45 | 15 | 18 |
| Female | 1 | 26 | 17 | 21 |
| Age (years) | ||||
| 18–70 | 8 | 43 | 7 | 9 |
| 71–78 | 10 | 38 | 16 | 17 |
| 79–96 | 5 | 28 | 32 | 32 |
Note that the cumulative incidence estimates for patients with baseline eGFR ≥30 mL/min/1.73 m2 stratified by albuminuria, gender and age are based on small subsamples.
Adjusted for all demographic and clinical variables, males had estimated hazards of ESKD that were 95% higher than females {hazard ratio [HR] 1.95 [95% confidence interval (CI) 1.54–2.46]} (Table 3). Compared with patients without diabetes, patients with diabetes as a primary cause of CKD had 1.49 (95% CI 1.18–1.88) times higher hazards of ESKD and patients with diabetes as a comorbidity had 1.57 (95% CI 1.14–2.15) times higher hazards of ESKD. Patients with the composite cardiovascular comorbidity had 1.19 (95% CI 0.95–1.48) times the hazards of ESKD compared with patients without cardiovascular comorbidity, although the 95% CI was wide. For every 10 mmHg higher SBP, hazards of ESKD increased by 7% [HR 1.07 (95% CI 1.00–1.15)]. We note that when SBP was split into categories of <110, 110–140, 140–160 and >160 mmHg, the effect was somewhat linear: HRs for each category with SBP <110 mmHg as the reference group were 1.17, 1.47 and 1.92, respectively. Patients with more albuminuria at baseline had increased hazards of ESKD, with those in the nephrotic range at the highest risk. We did not find evidence of effect modification between diabetes and albuminuria for ESKD (P = 0.997).
Factors associated with time to ESKD and death
| Factor | ESKD (456 events) | Death (448 events) | ||
|---|---|---|---|---|
| Model 1 | Model 2 | Model 1 | Model 2 | |
| HR (95% CI) | HR (95% CI) | HR (95% CI) | HR (95% CI) | |
| Age (per 5 years) | 0.92 (0.89–0.96) | 0.96 (0.92–1.00) | 1.29 (1.22–1.37) | 1.31 (1.23–1.39) |
| Male | 2.30 (1.86–2.83) | 1.95 (1.54–2.46) | 1.43 (1.17–1.74) | 1.48 (1.18–1.86) |
| Body mass index (per 5 kg/m2) | 0.85 (0.78–0.94) | 0.92 (0.83–1.02) | 0.88 (0.80–0.98) | 0.93 (0.84–1.02) |
| Diabetes | ||||
| As primary cause of CKD | 1.72 (1.39–2.14) | 1.49 (1.18–1.88) | 1.65 (1.33–2.05) | 1.58 (1.27–1.96) |
| As comorbidity only | 1.59 (1.17–2.16) | 1.57 (1.14–2.15) | 1.26 (0.93–1.70) | 1.30 (0.96–1.77) |
| Neither | 1 (ref) | 1 (ref) | 1 (ref) | 1 (ref) |
| Other comorbidities | ||||
| Hypertension | 0.93 (0.70–1.22) | 0.86 (0.64–1.15) | 1.01 (0.75–1.37) | 1.06 (0.78–1.44) |
| Composite cardiovascular | 1.10 (0.89–1.37) | 1.19 (0.95–1.48) | 1.58 (1.28–1.94) | 1.58 (1.28–1.96) |
| Baseline eGFR (per mL/min/1.73 m2) | 0.87 (0.85–0.89) | 0.90 (0.88–0.92) | 0.93 (0.91–0.94) | 0.95 (0.93–0.97) |
| SBP (per 10 mmHg) | 1.11 (1.04–1.18) | 1.07 (1.00–1.15) | 0.97 (0.91–1.04) | 0.97 (0.91–1.04) |
| DBP (per 10 mmHg) | 0.96 (0.86–1.08) | 0.99 (0.87–1.12) | 1.14 (1.01–1.28) | 1.19 (1.06–1.34) |
| Albuminuria | ||||
| Normal to mildly increased | 1 (ref) | 1 (ref) | ||
| Moderately increased | 1.20 (0.81–1.77) | 0.94 (0.68–1.29) | ||
| Very high | 2.16 (1.50–3.12) | 1.06 (0.76–1.47) | ||
| Nephrotic range | 4.22 (2.70–6.62) | 1.05 (0.68–1.63) | ||
| Haemoglobin (per g/dL) | 0.87 (0.81–0.93) | 0.89 (0.83–0.95) | ||
| Parathyroid hormone (per 10 pg/mL) | 1.01 (1.00–1.02) | 1.02 (1.01–1.03) | ||
| Phosphate (per mg/dL)a | 1.10 (0.94–1.30) | 1.10 (0.94–1.29) | ||
| Calcium (per mg/dL)b | 0.94 (0.78–1.14) | 0.97 (0.81–1.17) | ||
Model 1 includes all demographic and clinical variables listed except for albuminuria and other lab values. Model 2 additionally includes albuminuria and lab values. Results were similar when treatments (RAASi, statins) were included in the models. SBP and DBP were only moderately correlated (P = 0.506). All models were stratified by eGFR ≥30 versus eGFR <30 ml/min/1.73 m2 at study entry.
Phosphate: mg/dL × 0.3229 = mmol/l.
Calcium: mg/dL × 0.2495 = mmol/l.
Males also had higher hazards of death than females [HR 1.48 (95% CI 1.18–1.86) in the fully adjusted model]. Patients with diabetes as the primary cause of CKD had the highest hazards of death, followed closely by those with diabetes as a comorbidity compared with patients without diabetes. Patients with a cardiovascular comorbidity had higher hazards of death than those without any cardiovascular comorbidities. For every 10 mmHg higher diastolic blood pressure (DBP), the hazard of death increased by nearly 20% [HR 1.19 (95% CI 1.06–1.34)]. We note that when DBP was split into categories of <60, 60–75, 74–90 and >90 mmHg, the effect was somewhat linear: HRs for each category with DBP <60 mmHg as the reference group were 1.06, 1.28 and 1.93, respectively. We did not find evidence of effect modification between diabetes and albuminuria for death (P = 0.990).
DISCUSSION
In this study we describe the clinical and demographic characteristics of a representative German cohort of patients with advanced kidney disease under nephrology care and report risk factors and the incidence of kidney disease progression and mortality in this country. Interestingly, despite the high co-morbid profile of the population of this cohort, we observed that a high proportion of patients did not reach ESKD and mortality endpoints, which is somewhat different from previous findings in different cohorts [19].
The CKD patient cohort described in this article is part of the international CKDopps project and was recruited in Germany in nephrology centres of the DN, where more than half of the non-dialysis outpatient CKD population is treated and followed. We sought to establish a representative real-world cohort of nephrology-referred CKD patients by randomly selecting the participating centres, stratified by centre size and geographic location, and by including consecutive consenting patients into the registry until the recruiting goal of a centre was achieved. This procedure resulted in a fairly representative selection of CKD patients with advanced kidney disease. Preliminary descriptive data of a larger, unselected CKD patient group from our database were previously published [14]. The recruiting procedure resulted in a cohort of mostly elderly patients with predominantly hypertensive/vascular and diabetic kidney disease. As expected, primary kidney disease diagnoses differed considerably among age groups, and patients carried a high burden of comorbidities, especially diabetes and cardiovascular diseases.
The population included in this study differs in some aspects from the German Chronic Kidney Disease (GCKD) cohort [20]. Patients in the GCKD cohort were younger, with a mean age at baseline of 60 (SD 12) years; however, a similar patient population was described in the German Care for Home cohort. Also, mean eGFR at baseline was 47 mL/min/1.73 m2 in the GCKD cohort, as compared with a median eGFR of 25 mL/min/1.73 m2 in this study. It is likely that these differences result from different selection criteria, and the combination of the two studies may yield complementing information to describe the patient population and treatment of CKD patients followed in nephrology clinics in Germany.
One of the main goals of this study was to analyse risk factors for CKD progression. Aligned with previous reports in different cohorts, we observed that factors independently associated with faster progression in our cohort were worse kidney function at baseline, male sex, diabetes mellitus both as a renal diagnosis and as a comorbidity, higher SBP and higher albuminuria. These findings are consistent with previously published reports [7, 21–29]. In addition, we aimed to identify rates and risk factors for mortality in the same population, which were male sex, diabetes mellitus both as a renal diagnosis and comorbidity, lower baseline eGFR, composite cardiovascular comorbidity and higher DBP. These risk factors are in line with previously published reports [30–32].
The overall mean annual eGFR decline was in general relatively low (−2.1 mL/min/1.73 m2/year). More than half of patients with longer follow-up had slow or no decline in eGFR. In addition, only 17% had a steep decline during the study follow-up. Patients with a moderate or steep decline in eGFR were younger and a greater proportion were male compared with patients with slow or no decline—the latter having a lower proportion of diabetes and hypertension as a cause of CKD. Potential reasons for the lower rates of CKD progression to ESKD observed in the present cohort include the fact that all patients were followed by nephrologists in specialized CKD clinics, and therefore the treatment rates (including the high prevalence of prescription of RAASis and other renoprotective strategies) could differ from those observed in more general care clinics. Also, the targets for the management of CKD-specific risk factors are potentially more stringent in nephrology care compared with general practices.
Another important and novel finding of this study relates to the risk of ESKD in competition with the mortality risk. ESKD risk was considerably higher than mortality risk before reaching ESKD (37% versus 19%) only in the subgroup of patients starting follow-up at eGFR <30 mL/min/1.73 m2. On the other hand, mortality risk exceeded the incidence of ESKD (32% versus 28%) in the subgroup of patients between 79 and 96 years of age. These findings contrast with the proportionally higher mortality rates (compared with ESKD) among advanced CKD patients reported in other studies [10, 11, 21, 26, 33]. The reasons for this discrepancy remain speculative, but this is observed in general population cohorts where low GFR may not always reflect true CKD. Possibly, different practice patterns, different patient characteristics, different underlying population mortality and different socio-economic conditions with respect to access to medical treatment of patients account for these differences.
This study has the following weaknesses: (i) the smoking status of patients is not known; (ii) quantitation of proteinuria could only be done categorically for many patients and was missing in 45% of patients; (iii) availability of blood pressure data was limited and (iv) while most clinic visits were likely scheduled during a previous visit with frequency of visits defined based on comorbidities, CKD stage and risk of progression, specific reasons for variable frequency of eGFR measurements are unknown. However, there are many strengths, including the patient selection process, which resulted in a representative CKD patient cohort and the relatively long observation time with a high number of follow-up visits, allowing the identification of risk factors for kidney and mortality outcomes.
In summary, routine care of nephrology-referred patients in Germany comprises mostly elderly patients and patients with hypertensive/diabetic kidney disease. While mortality risk was significantly higher than ESKD risk only in elderly patients, the risk of ESKD was significantly higher than mortality in the group of patients with eGFR <30 mL/min/1.73 m2. The identification of local risk factors for CKD progression may help to guide nephrological resources by closer follow-up of patients with higher risk. CKD progression varied largely among the patient population, and a large proportion of patients displayed low CKD progression rates.
SUPPLEMENTARY DATA
Supplementary data are available at ndt online.
ACKNOWLEDGEMENTS
Jennifer McCready-Maynes, an employee of Arbor Research Collaborative for Health, provided editorial assistance on this article.
FUNDING
Global support for the ongoing Dialysis Outcomes and Practice Patterns Study programs is provided without restriction on publications by a variety of funders. For details, see https://www.dopps.org/AboutUs/Support.aspx.
AUTHORS’ CONTRIBUTIONS
J.Z., G.L., D.F., H.R., J.D., C.T., B.R., E.Y., R.P. and R.P.F were responsible for conception or design, analysis and interpretation of data or both. J.Z., G.L., D.F., H.R., J.D., B.R., E.Y., R.P. and R.P.F. were responsible for drafting the article or revising it. J.Z., H.R., B.R., E.Y., R.P. and R.P.F. provided intellectual content of critical importance to the work described. J.Z., D.F., H.R., J.D., B.S., E.Y., R.P. and B.R. were responsible for final approval of the version to be published.
CONFLICT OF INTEREST STATEMENT
J.D., D.F., B.S. and G. L have no conflicts of interest to declare. J.Z., R.L.P., B.M.R. and C.T. are employees of Arbor Research Collaborative for Health, which administers the Dialysis Outcomes and Practice Patterns Study (DOPPS). R.P.-F. reports personal fees from AstraZeneca, Akebia and Novo Nordisk outside the submitted work. E.Y. reports partial support from the Center for Medicare and Medicaid Services and the DOPPS. H.R. reports personal fees from Hexal, Vifor, Amgen and Otsuka outside the submitted work. The results presented in this article have not been published previously in whole or part, except in abstract format.
REFERENCES


Comments