


Abstract
Kidney transplant recipients (KTRs) experience substantial survival benefit compared with dialysis patients. However, their mortality and graft failure risk remain high. KTRs are often low in micronutrient status, including vitamins D and K. We investigated the association of both vitamins D and K status, and vitamin D treatment with all-cause mortality and death-censored graft failure.
We studied 461 KTRs from a single-centre study at median 6.1 years after transplantation. At baseline, vitamins D and K concentrations were measured by 25-hydroxyvitamin D [25(OH)D] and dephosphorylated uncarboxylated matrix gla protein (dp-ucMGP) and patients were categorized into: 25(OH)D <50/≥50 nmol/L and median dp-ucMGP <1057/≥1057 pmol/L.
Mean age was 52 ± 12 years, and 122 KTRs (26%) had low vitamins D and K status. During median 9.8 years follow-up, 128 patients (28%) died and 48 (10%) developed death-censored graft failure. Low vitamins D and K status was associated with 2.33 (1.26–4.30) [hazard ratio (95% confidence interval)] increased mortality risk and 3.25 (1.17–9.08) increased graft failure risk compared with KTR with 25(OH)D ≥50 nmol/L and dp-ucMGP <1057 pmol/L. Dp-ucMGP was strongly associated with mortality (per 500 pmol/L increase): 1.41 (1.08–1.41) for vitamin D treatment versus no treatment 1.07 (0.97–1.18), and graft failure 1.71 (1.17–2.49) for vitamin D treatment versus 1.19 (1.05–1.36) no treatment, P-interaction <0.07 for vitamin D treatment (n = 44).
Combined vitamins D and K deficiency are highly prevalent and are associated with increased mortality and graft failure risk compared with high vitamins D and K status. Low vitamin K status was strongly associated with an increased risk of premature mortality and graft failure for patients treated with vitamin D versus no vitamin D treatment.
INTRODUCTION
Kidney transplant recipients (KTRs) experience substantial survival benefit compared with chronic dialysis patients; however, their premature mortality risk remains disproportionally high compared with the general population [1, 2]. Moreover, KTRs remain exposed to the threat of late graft failure [3, 4]. KTRs are often low in micronutrient status, including vitamins D and K [5, 6]. Either vitamin alone has been associated with premature mortality and graft failure risk [7, 8]; however, it is unknown whether optimal vitamins D and K concentrations could reduce the disease burden in KTRs.
The proportion of carboxylated circulating matrix gla protein (MGP) reflects vascular vitamin K status and plays a role in inhibiting calcification in the vasculature [5]. Vascular calcification is strongly associated with coronary heart disease and premature mortality risk [9]. The MGP gene promoter contains a vitamin D response element, capable of a 2- to 3-fold enhanced MGP expression after vitamin D binding [10, 11]. This suggests that the combination of both vitamins could provide enhanced protection against progressive vascular calcification and cardiovascular disease [12]. Due to growing awareness for the relevance of vitamin D deficiency and osteoporosis, KTRs are often treated with active vitamin D [13]. Given that vitamin D is involved in the synthesis of vitamin K-dependent proteins, long-term vitamin D treatment potentially stimulates the synthesis of uncarboxylated MGP (ucMGP) [12].
Previous studies have suggested joint associations of low vitamins D and K status with incident hypertension and arterial stiffness in the general population [14, 15]. A small randomized trial indicated that vitamin D plus K supplementation versus vitamin D supplementation alone reduced carotid intima-media thickness after 9 months in a non-dialysis-dependent chronic kidney disease (CKD) population [16].
Previous analysis of our cohort indicated that sufficient vitamins D and K statuses alone are associated with survival benefits [7, 8]. Whether the joint relationship of vitamins D and K status is associated with long-term outcomes are unknown. Therefore, we prospectively investigated both vitamins D and K concentrations, and vitamin D treatment in relation to all-cause mortality and graft failure in KTRs.
MATERIALS AND METHODS
Study design and population
The TransplantLines Insulin Resistance and Inflammation Biobank and Cohort Study is an ongoing observational single-centre study of KTRs [17]. The primary aim of this study is to investigate associations of metabolic syndrome with impairment of kidney transplant function [18]. All stable KTRs who visited the outpatient clinic of the University Medical Center Groningen, the Netherlands between August 2001 and July 2003 with a functioning graft for ≥1 year were invited. Follow-up examinations were approximately every 1–2 years. Exclusion criteria were: age <18 years, inability to provide informed consent, overt congestive heart failure or cancer except cured skin cancer.
A total of 606 study participants out of 847 (72%) gave written informed consent. We excluded 145 participants for our analysis: 50 had no vitamin D measurement, 89 had no vitamin K measurement and 6 temporarily used vitamin K antagonists. Participants who used vitamin K antagonist treatment at enrolment and remained on this treatment during follow-up (n = 31) were not excluded, but were subsequently excluded in a sensitivity analysis. The analytic sample consisted of 461 study participants. The protocol was approved by the institutional review board and is in accordance with the Declaration of Helsinki and Istanbul.
Measurement of vitamins D and K status
Study personnel collected morning blood samples in a 8–12 h fasted state. Samples were stored at −80°C until assessment of biochemical measures. Vitamin D status was assessed by 25-hydroxyvitamin D3 concentrations [25(OH)D] and 1,25-dihydroxyvitamin D3 [1,25(OH)2D] in plasma using isotope dilution for solid-phase extraction by high-performance liquid chromatography–mass spectrometry, as described previously [19, 20]. The inter-assay coefficient of variation was 10.0%.
Dephosphorylated ucMGP (dp-ucMGP) was measured in citrated plasma using the pre-commercial dual-antibody enzyme-linked InaKtif MGP (IDS-iSYS) immunoassay [8]. In this assay, the capture antibody is directed against a non-phosphorylated MGP epitope comprising amino acids 3–15 and the detection antibody against an ucMGP epitope that includes amino acids 35–49, as previously described [21]. The intra- and interassay coefficient of variation were 5.6 and 9.9%, respectively. High dp-ucMGP concentrations reflect low vitamin K status.
All-cause mortality and graft failure
The endpoints of this study were all-cause mortality and death-censored graft failure, defined as return to dialysis therapy or re-transplantation. Cause of death was obtained by linkage of the death certificate number to the primary cause of death as coded by a physician from the Central Bureau of Statistics, the Netherlands. The continuous surveillance system of the outpatient programme ensures up-to-date information on patient status. General practitioners or referring nephrologists were contacted in case a patient status was unknown. We defined time at risk as the elapsed time from the baseline 2001–03 examination until date of death or the censoring date (1 April 2012) with no loss of follow-up. Death-censored graft failure was defined as irreversible graft failure by return to dialysis therapy. In the event of death with a functioning graft, the follow-up period is censored at the date when the graft was still functioning.
Other study variables
Study personnel obtained comprehensive data on participants’ demographics, transplantation details, medication including vitamin D treatment and comorbid conditions based on medical records during the outpatient clinic visit. A self-administrated questionnaire was used to assess self-reported smoking status and cardiovascular history. Smoking status was categorized as never, former and current smoker. Cardiovascular history was defined as history of myocardial infarction, percutaneous transluminal angioplasty or stenting of coronary or peripheral arteries, bypass operation of coronary or peripheral arteries, intermittent claudication, amputation for vascular reasons, transient ischaemic attack or ischaemic cerebrovascular accident. Body mass index (BMI) was calculated by dividing body weight by height squared (kg/m2). Season of blood collection was calculated from the baseline blood collection date using meteorological seasons, divided into autumn, winter, spring and summer.
Furthermore, we estimated glomerular filtrate rate from plasma creatinine using the Jaffé method (MEGA AU 510; Merck Diagnostic) with the CKD-Epidemiology (CKD-EPI) 2009 equation [22]. Parathyroid hormone was measured with a second-generation immune-radiometric assay that measures intact parathyroid hormone (Incstar Corp., Stillwater, MN, USA), inter-assay coefficient of variation of 5%. Total cholesterol was determined from fasting serum samples using enzymatic colorimetry method with a Hitachi 747 analyzer (Roche diagnostics, Mannheim, Germany). Serum triglyceride level was determined with the glycerol phosphate oxidase-peroxidase aminophenazone phenol method, and urinary protein excretion was analysed using the Biuret reaction (MEGA-AU-510). Serum albumin, haemoglobin A1c and high-sensitivity C-reactive protein (CRP) were determined by routine laboratory measurements. All biochemical analyses were performed by the Endocrinology Laboratory of the University Medical Center Groningen.
Statistical analysis
We categorized 25(OH)D by <50 and ≥50 nmol/L, the clinical cut-off value for vitamin D deficiency [23]. For vitamin K status, no clinical cut-off value is currently available and therefore we categorized dp-ucMGP by the median 1057 pmol/L. Based on these categories, we defined four groups of vitamins D and K status with the 25(OH)D category ≥50 mmol/L and dp-ucMGP <1057 pmol/L (indicating sufficient MGP carboxylation by vitamin K) as reference. We summarized continuous values by mean and standard deviation or median and interquartile range (IQR) when notably skewed for the vitamins D and K groups.
We used Cox regression analysis to estimate hazard ratios and 95% confidence intervals (CIs) of baseline vitamins D and K groups with long-term outcomes adjusted for characteristics that could plausibly confound this association. Our first model examined associations adjusted for age, sex and a cosinor model to account for the season of blood sampling [24]. In our second model, we added smoking status, BMI (kg/m2), systolic blood pressure (mmHg), triglycerides (mg/dL) and hemoglobin A1c (HbA1c) (%). In the final model, we added transplant time (year), dialysis history (months) and estimated glomerular filtration rate (eGFR) (mL/min/1.73 m2) for all-cause mortality.
We also assessed associations of vitamin K status as continuous variable in patients without vitamins D and K antagonist use, patients with vitamin D but without vitamin K antagonist use and vitamin K antagonist users without vitamin D in relation to long-term outcomes adjusting for only age and sex given the small number of events. Only one person used both vitamins D and K antagonists and was therefore excluded from this analysis. We tested for interaction by comparing the likelihoods of the nested models with and without the specific vitamin D treatment and vitamin K antagonist use interaction terms according to the groups described above with dp-ucMGP for long-term outcomes using the likelihood ratio test.
To evaluate continuous associations, we constructed cubic smoothing splines with evenly spaced knots, stratified by vitamin D treatment and vitamin K antagonist use. To test the robustness of the associations, we excluded KTRs on vitamin D treatment and chronic vitamin K antagonist users. Furthermore, we also categorized 1,25(OH)D by median 1,25(OH)D (108 pmol/L) and defined four groups of 1,25(OH)D and dp-ucMGP.
In the Cox regression, the product term reflects interaction as departure from multiplicativity (multiplicative scale versus additive scale) where in linear regression (continuous outcome), the product term reflects interaction as departure from additivity. However, it has been argued that interaction estimated as departure from additivity better reflects biological interaction, particularly for addressing public health measures to reduce disease frequency [25].
Interaction on an additive scale for relative risks (RRs) from Cox regression can be estimated by calculating the relative excess risk due to interaction. Relative excess risk due to interaction = RR A+B+ − RR A+B– − RR A−B+ + 1; A = vitamin D group; B = vitamin K group. A relative excess risk due to interaction of 0 or smaller reflects the absence of interaction, meaning no evidence of additive interaction.
RESULTS
Study population
Among the 461 study participants, the mean age at baseline was 52 ± 12 years and 245 were male (53%), included at a median (IQR) of 6.1 years (3.0–11.9) after transplantation. Median (IQR) dialysis time before transplantation was 2.2 years (1–4 years) and mean eGFR was 47.3 ± 15.3 mL/min/1.73 m2.
Combined low vitamins D and K status were present in 122 KTRs (26%) and associated with higher BMI, triglyceride, CRP and HbA1c values, with lower eGFR and serum albumin, and more frequent vitamin K antagonist use (Table 1).
Baseline characteristics according to categories of 25(OH)D and dp-ucMGP in 461 KTRs
| Categories of 25(OH)D (nmol/L) and dp-ucMGP status (pmol/L) | P-trend | ||||
|---|---|---|---|---|---|
| 25(OH)D <50 | 25(OH)D ≥50 | 25(OH)D <50 | 25(OH)D ≥50 | ||
| dp-ucMGP ≥1057 | dp-ucMGP ≥1057 | dp-ucMGP <1057 | dp-ucMGP <1057 | ||
| Demographics | |||||
| N | 122 | 108 | 124 | 107 | |
| Men, n (%) | 55 (45) | 68 (63) | 63 (51) | 59 (55) | 0.050 |
| Age (years) | 54.1 ± 11.2 | 51.6 ± 11.2 | 50.5 ± 12.2 | 50.3 ± 12.1 | 0.058 |
| BMI (kg/m2) | 27.8 ± 4.6 | 25.7 ± 4.4 | 25.6 ± 4.3 | 24.5 ± 3.3 | <0.001 |
| Smoking status | |||||
| Never, n (%) | 49 (40) | 43 (40) | 45 (36) | 34 (32) | 0.539 |
| Former, n (%) | 50 (41) | 51 (47) | 47 (38) | 53 (50) | 0.253 |
| Current, n (%) | 22 (18) | 14 (13) | 31 (25) | 20 (19) | 0.135 |
| SBP (mmHg) | 156 ± 22 | 154 ± 24 | 151 ± 22 | 148 ± 22 | 0.063 |
| DBP (mmHg) | 90 ± 9 | 90 ± 11 | 90 ± 10 | 88 ± 9 | 0.474 |
| Prior CVD, n (%) | 16 (13) | 17 (16) | 15 (12) | 9 (9) | 0.443 |
| Season, n (%) | |||||
| Spring | 39 (32) | 16 (15) | 56 (45) | 17 (16) | <0.001 |
| Summer | 15 (12) | 29 (27) | 8 (7) | 32 (30) | <0.001 |
| Autumn | 40 (33) | 56 (52) | 23 (18) | 17 (16) | <0.001 |
| Winter | 28 (23) | 7 (6) | 37 (30) | 19 (18) | <0.001 |
| Kidney transplantation | |||||
| Dialysis duration history (months) | 33 (18–60) | 23 (8–47) | 27 (12–42) | 22 (10–47) | 0.022 |
| Transplant time (year) | 6.6 (3.9–12) | 7.9 (4.4–13) | 6.5 (2.6–12) | 6.1 (3.0–12) | 0.264 |
| Deceased donor, n (%) | 109 (89) | 93 (86) | 100 (81) | 96 (90) | 0.146 |
| eGFR (mL/min/1.73 m2) | 43 ± 15 | 41 ± 15 | 53 ± 14 | 53 ± 13 | <0.001 |
| Metabolic | |||||
| 25(OH) D (nmol/L) | 36 ± 10 | 72 ± 19 | 35 ± 9.3 | 71 ± 17 | <0.001 |
| 1,25(OH)D (pmol/L) | 99 ± 41 | 116 ± 46 | 106 ± 43 | 133 ± 50 | <0.001 |
| Dp-ucMGP (pmol/L) | 1712 (1283–2425) | 1556 (1241–2006) | 780 (583–922) | 728 (595–881) | <0.001 |
| PTH (pmol/L) | 10.6 (7.8–18) | 10.2 (7.4–15) | 9.4 (6.4–13) | 6.8 (5.2–9.2) | 0.001 |
| Total cholesterol (mmol/L) | 5.6 ± 1.1 | 5.8 ± 1.0 | 5.6 ± 1.0 | 5.6 ± 1.0 | 0.171 |
| Triglycerides (mg/dL) | 2.5 ± 1.4 | 2.2 ± 1.3 | 2.1 ± 1.3 | 2.0 ± 1.4 | 0.006 |
| CRP (mg/L) | 3.0 (1.4–6.1) | 1.9 (0.5–4.8) | 2.0 (0.6–6.1) | 1.4 (0.4–3.4) | 0.006 |
| Albumin (g/dL) | 40 ± 4.0 | 41 ± 2.8 | 41 ± 3.3 | 41 ± 2.6 | <0.001 |
| Haemoglobin (g/dL) | 8.4 ± 0.9 | 8.2 ± 1.0 | 9.4 ± 7.5 | 8.6 ± 0.8 | 0.113 |
| HbA1c (%) | 6.7 ± 1.2 | 6.6 ± 0.9 | 6.4 ± 1.1 | 6.3 ± 0.9 | 0.013 |
| Medication use, n (%) | |||||
| Vitamin D treatment | 15 (12) | 15 (14) | 11 (9) | 4 (4) | 0.058 |
| Vitamin K antagonist | 16 (13) | 11 (10) | 3 (2) | 1 (1) | <0.001 |
| ACE inhibitor | 43 (35) | 41 (38) | 44 (36) | 26 (24) | 0.143 |
| Statins | 65 (53) | 55 (51) | 62 (50) | 48 (45) | 0.639 |
| Mycophenolate mofetil | 44 (36) | 28 (26) | 54 (44) | 50 (47) | 0.008 |
Values are presented as means with standard deviations, median with IQR or numbers with percentages. SPB, systolic blood pressure; DBP, diastolic blood pressure; CVD, cardiovascular disease; PTH, parathyroid hormone; ACE, angiotensin-converting enzyme.
Associations of combined 25(OH)D and dp-ucMGP with long-term outcomes
During a median (IQR) follow-up of 9.8 years (8.7–10.3), 128 patients (28%) died and 48 (10%) developed death-censored graft failure. The incidence rate for mortality per 100 person-years was highest in the low vitamins D and K status category, 5.2 versus 1.5 for the high vitamins D and K status category (Table 2). Survival curves for vitamins D and K categories differed for all-cause mortality and graft failure, log rank P < 0.001 (Figure 1).
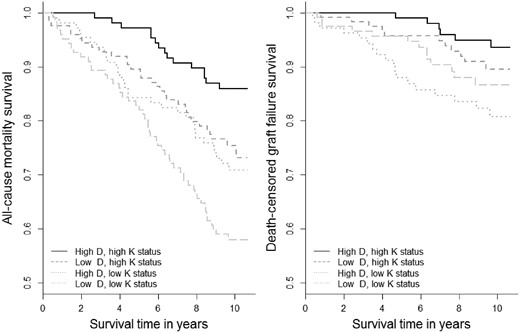
Survival curves for 25(OH)D and dp-ucMGP categories with all-cause mortality and graft failure in 461 KTRs. All-cause mortality: N = 128 died, log-rank P < 0.001. Death-censored graft failure: N = 158, log-rank P < 0.001.
Associations of combined 25(OH)D and dp-ucMGP categories with all-cause mortality and graft failure in 461 KTRs
| Categories of 25(OH)D (nmol/L) and dp-ucMGP status (pmol/L) | ||||
|---|---|---|---|---|
| 25(OH)D <50 | 25(OH)D ≥50 | 25(OH)D <50 | 25(OH)D ≥50 | |
| dp-ucMGP ≥1057 | dp-ucMGP ≥1057 | dp-ucMGP <1057 | dp-ucMGP <1057 | |
| N | 122 | 108 | 124 | 107 |
| All-cause mortality | ||||
| No. of cases (%) | 51 (42) | 31 (29) | 31 (25) | 15 (14) |
| Person-years | 975 | 970 | 1073 | 1030 |
| Incidence rate/100 person-years | 5.2 | 3.2 | 2.9 | 1.5 |
| Model 1 | 3.13 (1.74–5.61) | 2.18 (1.18–4.05) | 2.11 (1.13–4.00) | 1.00 (Ref.) |
| Model 2 | 2.91 (1.60–5.30) | 2.16 (1.16–4.03) | 1.99 (1.06–3.75) | 1.00 (Ref.) |
| Model 3 | 2.51 (1.37–4.59) | 1.73 (0.91–3.29) | 2.08 (1.10–3.93) | 1.00 (Ref.) |
| Death-censored graft failure | ||||
| No. of cases (%) | 13 (27) | 18 (38) | 11 (23) | 6 (13) |
| Person-years | 928 | 857 | 1052 | 1004 |
| Incidence rate/100 person-years | 1.4 | 2.1 | 1.0 | 0.6 |
| Model 1 | 2.50 (0.94–6.64) | 3.75 (1.48–9.49) | 1.58 (0.58–4.34) | 1.00 (Ref.) |
| Model 2 | 3.15 (1.14–8.72) | 4.30 (1.67–11.1) | 1.67 (0.60–4.63) | 1.00 (Ref.) |
| Model 3 | 3.25 (1.17–9.08) | 4.15 (1.59–10.8) | 1.61 (0.58–4.50) | 1.00 (Ref.) |
Hazard ratios and 95% CIs were derived from Cox proportional hazard models. To convert 25(OH)D to nanogram per millilitre divide by 2.5. 25(OH)D ≥50, sufficient vitamin D status; dp-ucMGP ≥1057, vitamin K deficiency. Model 1 adjusted for age, sex and a cosinor model to account for time of the year. Model 2 includes Model 1 plus current smoking (yes/no), BMI (kg/m2), triglycerides (mg/dL), HbA1c (%) and systolic blood pressure (mmHg). Model 3 includes Model 2 plus transplant vintage (year), dialysis duration history (month) and eGFR (mL/min/1.73 m2). Graft failure adjusted for model 3 and eGFR: HR = 1.52 (0.52–4.41), 1.95 (0.72–5.31) and 1.61 (0.58–4.48), respectively.
Combined low vitamins D and K status was associated with a 3.13-fold (95% CI: 1.74–5.61) increased risk of all-cause mortality compared with the high vitamins D and K status group (reference) after adjusting for age and sex and season. The hazard ratio slightly attenuated further after adjustments for smoking, BMI, triglycerides, systolic blood pressure, HbA1c, transplant time, dialysis history duration and eGFR to 2.51 (1.37–4.59). The risk estimates were lower for the high vitamin D/low vitamin K [1.73 (0.91–3.29)] and low vitamin D/high vitamin K [2.08 (1.10–3.93)] groups, but still statistically significant for the low vitamin D/high vitamin K group.
For graft failure, combined low vitamins D and K status showed similar associations with a hazard ratio of 2.50 (0.94–6.64), which increased to 3.25 (1.17–9.08) after full adjustment. The high vitamin D/low vitamin K group showed an even higher risk estimate of 4.15 (1.59–10.8) for graft failure and a non-significant risk for the low vitamin D/high vitamin K group 1.61 (0.58–4.50).
For all-cause mortality, the relative excess risk because of interaction for Model 1 is −0.16 (3.13 – 2.18 – 2.11 + 1) for Model 1 and −0.3 for Model 3. For graft failure, values were −1.5 or more.
Vitamin D treatment
Vitamin D treatment was prescribed to 45 (10%) study participants, and consisted of alfacalcidol (n = 36) with a daily dose of 0.25 μg/day, usually combined with calcium supplementation. Median (IQR) dp-ucMGP was lowest in the non-vitamin D treatment group: 974 (723–1392), higher in the vitamin D treatment group 1281 (940–1834) and highest in the vitamin K antagonist group 2806 (2007–3791) pmol/L.
Stratifying for vitamin D treatment and vitamin K antagonist use resulted in stronger relationships between dp-ucMGP (per 500 pmol/L increase) and mortality for vitamin D treatment 1.41 (1.08–1.84) and vitamin K antagonist users 1.25 (1.05–1.50) compared with no vitamin D treatment and vitamin K antagonist use 1.07 (0.97–1.18) adjusting for age and sex, P-interaction <0.07 (Table 3). For graft failure, risk estimates for increasing dp-ucMGP were also strongest for patients on vitamin D treatment 1.71 (1.17–2.49) and vitamin K antagonist users 1.74 (0.81–3.79), compared with no vitamin D treatment and no vitamin K antagonist use 1.19 (1.05–1.36). Comparable graphical findings were observed for continuous dp-ucMGP with all-cause mortality and graft failure stratified by vitamin D treatment (Figure 2).
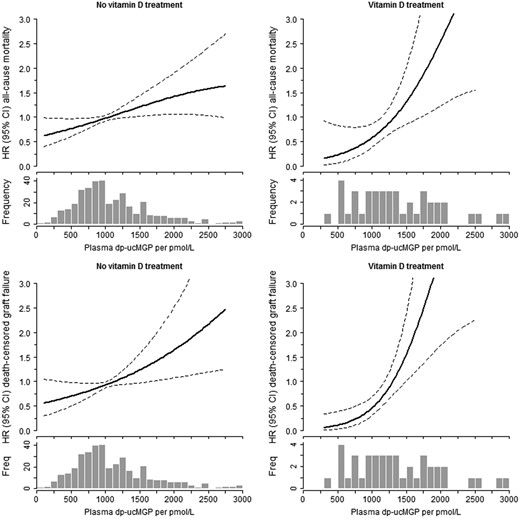
Continuous associations for dp-ucMGP with all-cause mortality and graft failure stratified by vitamin D treatment. Adjusted for age and sex. No vitamin D: N = 386; vitamin D treatment: N = 44. Due to the small number of vitamin K antagonist users (n=30), no continuous association could be plotted.
Associations of dp-ucMGP with all-cause mortality and graft failure in 460a KTRs stratified by vitamin D supplement treatment and vitamin K antagonist users
| No vitamin D, no VKA | Vitamin D treatment, no VKA | VKA, no vitamin D | P for interaction | |
|---|---|---|---|---|
| N = 386 | N = 44 | N = 30 | ||
| Dp-ucMGP (pmol/L), median (IQR) | 974 (723–1392) | 1281 (940–1834) | 2806 (2007–3791) | |
| All-cause mortality | ||||
| No. of cases (%) | 98 (25) | 15 (34) | 15 (50) | |
| dp-ucMGP per 500 pmol/L increase, HR (95% CI) | 1.07 (0.97–1.18) | 1.41 (1.08–1.84) | 1.25 (1.05–1.50) | 0.03 |
| Death-censored graft failure | ||||
| No. of cases (%) | 39 (10) | 7 (16) | 2 (7) | |
| dp-ucMGP per 500 pmol/L increase, HR (95% CI) | 1.19 (1.05–1.36) | 1.71 (1.17–2.49) | 1.74 (0.81–3.79) | 0.07 |
VKA, vitamin K antagonist use, adjusted for age and sex. One KTR excluded due to combined use of vitamin D treatment and vitamin K antagonist.
Sensitivity analyses
Excluding the active vitamin D treatment group (n = 424) resulted in a risk estimate of 1.31 (1.23–4.35) for the low vitamin D/low vitamin K group for all-cause mortality and 2.52 (0.86–7.43) for graft failure.
We further excluded vitamin D treatment and vitamin K antagonist users to test the robustness of the associations (n = 385) between 25(OH)D with dp-ucMGP categories, which slightly attenuated the result, but remained statistically significant in this more homogeneous population supporting the overall conclusion (Supplementary data, Tables S1 and S2).
The risk estimates for 1,25(OH) and dp-ucMGP categories with mortality indicated a significant risk only for the low active vitamin D/low vitamin K group 1.85 (1.05–3.29) in the fully adjusted model. For graft failure, the risk estimate for the low active vitamin D/low vitamin K group was 4.98 (1.31–19.0) (Supplementary data, Table S3). Furthermore, excluding patients on vitamin D treatment and vitamin K antagonist users, the risk estimate for the low active vitamin D/low vitamin K groups was slightly lower [1.52 (0.80–2.87)] and the risk estimate for graft failure was larger [10.3 (2.83–37.7)].
DISCUSSION
We observed that the combined low vitamins D and K status are highly prevalent in stable KTRs and are associated with an increased risk of premature all-cause mortality and death-censored graft failure after 9.8 years follow-up. Importantly, the risk of the combined deficiency was higher than a single deficiency. Furthermore, low vitamin K status in the setting of active vitamin D treatment is associated with an increased risk of premature mortality and graft failure compared with no treatment, implying risk amplification. Finally, vitamin K antagonist use also appears to amplify these effects, and therefore awareness for the potential harmful effects of vitamin K antagonist use in patients with vitamin D deficiency is needed.
To our knowledge, this is the first study among KTRs that investigated the association of combined vitamins D and K status with long-term clinically relevant outcomes. The role of vitamins D and K on bone and cardiovascular health has mainly been studied in isolation, and potential synergistic effects of vitamins D and K are largely unknown. Few previous studies investigated the interaction between vitamins D and K status on intermediate endpoints of cardiovascular disease in the general population. In a cross-sectional analysis of the Czech post-MONICA (MONItoring trends and determinants in CArdiovascular disease) study, the lowest vitamins D and K status group had a higher odds for arterial stiffness 6.83 (95% CI: 1.95–20.9) defined as pulse wave velocity ≥9.3 m/s compared with the highest vitamins D and K status group [15]. In the Dutch LASA study, low vitamins D and K status was associated with increased systolic and diastolic blood pressure and a trend for incident hypertension after 6.4 years follow-up in a middle-aged population [14].
A small randomized trial demonstrated that vitamin D plus K supplementation versus vitamin D supplementation alone reduced progression of intima-media thickness after 9 months in a small population of non-dialysis-dependent CKD patients [16].
Multiple lines of evidence suggest that optimal concentrations of both vitamins D and vitamin K might protect against progressive vascular calcification and cardiovascular disease. Excess vitamin D induced a relative vitamin K deficiency by direct stimulation of the synthesis of vitamin K-dependent proteins in vitro [11]. In the absence of sufficient capacity to active these proteins by carboxylation, an aggravated relative vitamin K deficiency will occur. Treatment with 1,25(OH)D dramatically increased MGP mRNA and increased MGP secretion 15-fold [26]. Treatment with active vitamin D might therefore increase the ratio of uncarboxylated over active carboxylated MGP, thereby inducing a relative vitamin K deficiency. Multiple animal studies confirmed that vitamin D has direct effects on vitamin K-dependent metabolism [11, 27–29]. In mice, a diet high in 1,25(OH)D for 20 weeks induced higher amounts of ucMGP and renal calcification [27]. Also in rats, vitamin K2 suppressed soft tissue calcification induced by vitamin D as demonstrated by lower calcium and phosphorus content in the aorta and kidney [29].
Our results support an increased risk mortality and graft failure risk for vitamin D treatment, especially in the setting of low vitamin K status. Therefore, the combined prescription of vitamins D and K may exert joint therapeutic effects for cardiovascular health.
The increased mortality risk for KTRs on vitamin D treatment with low vitamin K status might be explained by the fact that vitamin D treatment increases the pool of uncarboxylated vitamin K-dependent proteins at similar vitamin K concentrations. Due to this relative shortage of vitamin K, protection from ectopic calcification by fully carboxylated MGP is diminished. KTRs on vitamin D treatment with low vitamin K status may thereby be at increased risk of developing vascular calcification as confirmed by the increased premature mortality risk in our study. However, we cannot exclude that confounding by indication for the use of active vitamin D distorted its association with the outcomes we studied. More research is needed to elucidate the potential risk of active vitamin D treatment.
In addition, we do not know whether supplementation with cholecalciferol with low vitamin K status has similar effects compared with alfacalcidiol on clinical outcomes. Given the very high-risk estimates, further research into the type of vitamin treatment and the causal effect on vitamin K status is urgently warranted.
Strengths and limitations
Our study has some strengths and limitations that should be noted. Strengths include the precise vitamin D assessments of 25(OH)D and 1,25(OH)D with high-performance liquid chromatography–mass spectrometry. Furthermore, this study has a relatively large and homogeneous sample size, long-term and complete follow-up, and the novelty of our study to demonstrate combined associations between vitamins D and K status with endpoints in KTRs.
Several limitations of our study warrant consideration. For plasma dp-MGP, no clinical cut-off value has been developed although dp-ucMGP is an established marker of vitamin K status and has been associated with increased risk of cardiovascular events in CKD populations [21, 30]. The samples have been stored at −80°C after collection for 12 years, and no data are available whether potential sample degradation could have affected our results. We stratified our results by median dp-ucMGP, which inevitably leads to a high prevalence of low vitamin K status. However, the median value compared in this population is much higher when compared with mean concentrations as observed in the general population, possibly indicating more generalized disturbances in vitamin K metabolism in our population [14]. Studies in the general population suggested a clinical cut-off value of 500 pmol/L for vitamin K insufficiency [7, 8], which will further increase the combined deficiency to 48% versus 26%. Moreover, our study was observational in nature and therefore the possibility of residual confounding cannot be excluded. Study attrition may have led to survival bias; however, the population reflects the outpatient clinic of prevalent KTRs. No information on the indication and duration of vitamin D treatment was available, which could be due to frailty or high fracture risk.
CONCLUSION
We observed that the combination of low vitamins D and K status is highly prevalent in stable KTRs and is associated with an increased risk of premature all-cause mortality and death-censored graft failure after 9.8 years follow-up. Furthermore, KTRs on vitamin D treatment with low vitamin K status have a strong risk of premature mortality and graft failure compared with no vitamin D treatment. Future studies should address whether combined vitamins D and K supplementation may lead to improved outcomes after kidney transplantation.
ACKNOWLEDGEMENTS
We are extremely grateful to all TransplantLines Insulin Resistance and Inflammation Biobank and Cohort Study participants and the research team involved for their ongoing commitment to the study.
FUNDING
This research was supported by a personal postdoctoral grant from the Kidney Foundation (16OKG02, A.J.v.B.) and a Dr Dekker senior postdoc grant from the Netherlands Heart Foundation (2013T120, J.W.J.B.). No commercial funding was involved.
AUTHORS’ CONTRIBUTIONS
A.J.v.B. analysed the experiments, contributed to data and wrote the article. J.W.J.B. analysed and interpreted the data, contributed data and revised the manuscript for intellectual content. C.A.K. interpreted the data, contributed to data and revised the manuscript for intellectual content. G.J.N. designed and performed the experiments, interpreted the data, contributed to data and revised the manuscript for intellectual content. S.P.B. interpreted the data, contributed to data and revised the manuscript for intellectual content. M.H.d.B. designed and performed the experiments, interpreted the data, contributed to data and revised the manuscript for intellectual content. M.G.V. interpreted the data, contributed to data and revised the manuscript for intellectual content. S.J.L.B. designed and performed the experiments, interpreted the data, contributed to data and revised the manuscript for intellectual content.
CONFLICT OF INTEREST STATEMENT
No conflicts of interest for A.J.v.B., S.P.B., C.A.K., G.J.N., M.H.d.B. and S.J.L.B. J.W.J.B. reports grants from Unilever R&D, outside the submitted work. M.G.V. reports grants and personal fees from Amgen, grants and personal fees from FMC, personal fees from VFMCRP, personal fees from Bayer, personal fees from Baxter, personal fees from Medice, personal fees from Otsuka and personal fees from Braun, outside the submitted work.


Comments