


Abstract
Advances in life expectancy have led to an increase in the number of elderly people with end-stage renal disease (ESRD). Scarce information is available on the outcomes of kidney transplantation (KT) in extremely elderly patients based on an allocation policy prioritizing donor–recipient age matching.
We included recipients ≥75 years that underwent KT from similarly aged deceased donors at our institution between 2002 and 2015. Determinants of death-censored graft and patient survival were assessed by Cox regression.
We included 138 recipients with a median follow-up of 38.8 months. Median (interquartile range) age of recipients and donors was 77.5 (76.3–79.7) and 77.0 years (74.7–79.0), with 22.5% of donors ≥80 years. Primary graft non-function occurred in 8.0% (11/138) of patients. Cumulative incidence rates for post-transplant infection and biopsy-proven acute rejection (BPAR) were 70.3% (97/138) and 15.2% (21/138), respectively. One- and 5-year patient survival were 82.1 and 60.1%, respectively, whereas the corresponding rates for death-censored graft survival were 95.6 and 93.1%. Infection was the leading cause of death (46.0% of fatal cases). The occurrence of BPAR was associated with lower 1-year patient survival [hazard ratio (HR) = 4.21, 95% confidence interval (CI) 1.64–10.82; P = 0.003]. Diabetic nephropathy was the only factor predicting 5-year death-censored graft survival (HR = 4.82, 95% CI 1.08–21.56; P = 0.040).
ESRD patients ≥75 years can access KT and remain dialysis free for their remaining lifespan by using grafts from extremely aged deceased donors, yielding encouraging results in terms of recipient and graft survival.
INTRODUCTION
Advances in healthcare have led to a rise in life expectancy in developed countries, with a progressive increase in the number of elderly people with good health-related quality of life (HRQoL). The epidemiology of end-stage renal disease (ESRD) has accordingly changed in Spain, with a notable increase in incidence and prevalence of this condition within the elderly age segment [1]. Kidney transplantation (KT) remains the treatment of choice for patients with ESRD of any age [2], since it provides the best survival rate and HRQoL with the lowest cost [3, 4]. Nevertheless, elderly patients often experience difficulties in accessing transplantation due to high comorbidity burden and perceived increased risks associated with surgical procedures and immunosuppression. In addition, it is likely that the shortage of deceased donors negatively impacts the management of the waiting list, giving priority to younger candidates to the detriment of the older ones. An allocation policy allowing for the use of young donor grafts to elderly recipients may result in suboptimal outcomes in terms of years of graft function if the recipient dies before reaching the expected graft survival time [5]. Moreover, transplants from older donors to younger recipients have been associated with higher risks of graft loss and death [6, 7]. In contrast, this poorer survival would be compensated if these grafts were reserved for older recipients, taking into account their shorter life expectancy. Such a policy of donor–recipient age matching would eventually allow elderly ESRD patients to remain free from dialysis for most, if not all, of their remaining lifespan.
The Spanish donation model does not set an age limit for deceased donation, and, therefore a large number of extremely aged patients are being identified as potential donors. A third of deceased donors in Spain are currently >70 years of age and 10% of them are >80 years [8]. This enlarging pool of organs from very aged donors offers the possibility of transplantation to elderly recipients without competing with younger candidates on the waiting list.
There are successful reports of KT in very old recipients from younger living or deceased donors [9, 10]. In most of these studies, however, recipients had low comorbidity and donors were significantly younger. Our group has shown that grafts from extremely old deceased donors (≥75 years) can provide satisfactory results in younger recipients undergoing single or double KT after an extensive functional and histological assessment that included pre-transplant graft biopsy [11]. Nevertheless, graft and patient outcomes resulting from an allocation policy that prioritizes age mismatch between extremely aged donors and recipients have not been reported.
Single and double transplants using grafts from very aged donors have been regularly performed at our institution for two decades. In view of the favourable results, we have progressively extended this strategy to recipients of increasing age with greater comorbidity burden. The present study was aimed at reporting long-term outcomes of extremely elderly (≥75 years) KT recipients from very aged deceased donors as well as at assessing the determinants of graft and patient survival in this poorly investigated population.
MATERIALS AND METHODS
Study population and setting
This observational retrospective cohort study was performed at the University Hospital ‘12 de Octubre’ (Madrid, Spain). Between January 2002 and December 2015, a total of 2036 KT procedures were performed at our institution. For the present analysis, we selected extremely elderly recipients (≥75 years) from similarly aged deceased donors during such period. The study was performed in accordance with the ethical standards laid down in the Declarations of Helsinki and Istanbul. The local Clinical Research Ethics Committee approved the study protocol. The need for written informed consent was waived due to the retrospective nature of the research.
A number of pre-transplant, perioperative and post-transplant variables were recorded by using a standardized case report form. We specifically collected the occurrence of immune (acute and chronic rejection) and non-immune (infectious, cardiovascular and metabolic) complications until April 2018 or, alternatively, the date of death, graft loss or last contact (whatever occurred first).
Study procedures
According to our institutional practice, ESRD patients ≥75 years with a life expectancy longer than the estimated time on the waiting list were considered for KT if no absolute contraindications were identified. We considered absolute contraindications to be the presence of ongoing infection, a recent history of malignancy, left ventricular ejection fraction <50%, chronic liver disease with portal hypertension, relevant neurological or psychiatric conditions, and urinary tract and/or vascular abnormalities that could potentially prevent graft placement.
Pre-emptive transplantation was considered only when a graft from an extremely aged donor was available and there were no alternative extremely elderly candidates listed for KT on dialysis at that moment. The suitability of the kidney was established in the presence of (i) adequate graft macroscopic appearance of the parenchyma, vessels and urinary tract and (ii) donor serum creatinine level (sCr) ≤1.0 mg/dL. Histological examination was commonly performed until 2010.
All patients received prophylaxis for Pneumocystis jirovecii pneumonia with trimethoprim–sulfamethoxazole or monthly inhaled pentamidine for 6–9 months. In patients at high risk for cytomegalovirus (CMV) infection, universal prophylaxis with oral valganciclovir was given for 3 [seropositive recipients (R+) receiving induction with antithymocyte globulin (ATG)] or 3–6 months {serology mismatch [donor positive (D+)/recipient negative (R−)]}.
Study definitions
Causes of ESRD were categorized according to the ERA-EDTA classification [12]. Biopsy-proven acute rejection (BPAR) was suspected in the presence of an otherwise unexplained acute increase in sCr and subsequently confirmed by histological assessment. Delayed graft function (DGF) was defined as the requirement for dialysis within the first week after transplantation. In patients undergoing pre-emptive KT, DGF was considered if sCr did not decrease from the patient's baseline level (before transplantation) at 72 h after transplantation. Diagnosis of primary graft non-function (PNF) required the permanent lack of graft function from the time of transplantation that led to the continuation of chronic dialysis or retransplantation. Estimated glomerular filtration rate (eGFR) was calculated using the Chronic Kidney Disease Epidemiology Collaboration equation [13]. The definition of CMV disease included viral syndrome and end organ disease [14]. Proven or probable invasive fungal disease (IFD) was defined according to the European Organization on Research and Treatment in Cancer/Mycoses Study Group criteria [15]. Death-censored graft survival was defined as the time from transplantation until to permanent graft failure leading to return to dialysis or retransplantation. Non-death-censored graft survival included either graft loss or death with functioning graft.
Statistical analysis
Quantitative data are shown as mean ± standard deviation (SD) or median with interquartile range (IQR). Qualitative variables are expressed as absolute and relative frequencies. Categorical variables were compared using the Chi-square test, whereas Student’s t or Mann–Whitney U test was applied for continuous variables. Repeated measures were compared with the Student’s t-test for paired samples or the Wilcoxon test. A logistic regression analysis was performed to identify factors predicting PNF, with associations expressed as odds ratios (ORs) with 95% confidence intervals (CIs). Patient and graft survival were estimated by the Kaplan–Meier method. Separate univariate and multivariate Cox regression models (with backward stepwise selection) were constructed to evaluate the factors predicting (1 and 5 years) patient survival and (5 years) death-censored graft survival. Since we applied an ‘intention-to-treat’ approach to analyse factors influencing patient survival, the entire study cohort was included in these models. On the contrary, analyses of graft function and factors predicting death-censored graft survival were performed after excluding those patients that experienced PNF. Results were expressed as hazard ratios (HRs) with 95% CIs. Statistical analysis was performed with SPSS version 20.0 (IBM Corp., Armonk, NY, USA).
RESULTS
Characteristics of the study population
Overall, 138 patients were included, accounting for 6.8% of the 2036 KT procedures performed at our centre during the study period. The median (IQR) follow-up was 38.8 months (11.5–75.4). Demographics and clinical characteristics of recipients are presented in Table 1. Median (IQR) age at transplantation was 77.5 years (76.3–79.7), with 29 patients (21.0%) being ≥80 years. Recipients exhibited notable pre-transplant comorbidities, including chronic heart disease [63 patients (45.7%)], diabetes mellitus [45 (32.6%)] and chronic obstructive pulmonary disease [19 (13.8%)]. The most common causes of ESRD were hypertensive nephrosclerosis [36 (26.1%)] and diabetic nephropathy [33 (23.9%)]. Most patients [119 (86.2%)] were on dialysis before transplantation, whereas the rate of previous KT was low [9 (6.5%)].
Demographics and baseline clinical characteristics of recipients (n = 138)
| Variable | |
|---|---|
| Age at transplantation [median (range)], years | 77.5 (76.3–79.7) |
| Gender (male), n (%) | 83 (60.1) |
| Cardiovascular risk factors, n (%) | |
| Hypertension | 124 (89.9) |
| Diabetes mellitus | 45 (32.6) |
| Dyslipidaemia | 58 (42.0) |
| Prior or current smoking history | 32 (23.2) |
| Pre-transplant chronic conditions, n (%) | |
| Heart disease | 63 (45.7) |
| Hypertensive heart disease | 36 (26.1) |
| Coronary artery disease | 17 (12.3) |
| Valvular disease | 7 (5.1) |
| Pulmonary arterial hypertension | 3 (2.2) |
| Cerebrovascular disease | 21 (15.2) |
| Chronic obstructive pulmonary disease | 19 (13.8) |
| Obstructive sleep apnoea–hypopnoea syndrome | 8 (5.8) |
| Ocular disordera | 15 (10.9) |
| Lower limb peripheral arterial disease | 17 (12.3) |
| Aortic atherosclerosisb | 54 (39.1) |
| Venous thromboembolic event | 10 (7.2) |
| Obesity (BMI ≥30 kg/m2) | 37 (26.8) |
| Malignancyc | 20 (14.5) |
| Solid organ tumour | 12 (8.7) |
| Cutaneous tumour | 9 (6.5) |
| Aetiology of underlying ESRD, n (%) | |
| Chronic hypertensive nephropathy | 36 (26.1) |
| Diabetic nephropathy | 33 (23.9) |
| Glomerular disease | 13 (9.4) |
| Tubulointerstitial nephritis | 12 (8.7) |
| Polycystic kidney disease (adult type) | 10 (7.2) |
| Acquired obstructive nephropathy | 4 (2.9) |
| Glomerulonephritis secondary to systemic disease | 4 (2.9) |
| Ischaemic nephropathy | 3 (2.2) |
| Chronic kidney disease secondary to tumour nephrectomy | 2 (1.3) |
| AA amyloid secondary to chronic inflammation | 2 (1.3) |
| Alport syndrome | 2 (1.3) |
| Aetiology uncertain/unknown | 15 (10.9) |
| Otherd | 2 (1.3) |
| Anti-HCV-positive serostatus, n (%) | 5 (3.6) |
| Anti-HBsAg-positive serostatus, n (%) | 8 (5.8) |
| CMV serostatus, n (%)e | |
| D+/R+ | 117 (84.8) |
| D−/R+ | 13 (9.4) |
| D+/R− | 2 (1.4) |
| D−/R− | 1 (0.7) |
| Pre-transplant renal replacement therapy, n (%) | 119 (86.2) |
| Haemodialysis | 115 (83.3) |
| Continuous ambulatory peritoneal dialysis | 4 (2.9) |
| Dialysis vintage [median (IQR)], months | 14 (8–24) |
| Prior KT, n (%) | 9 (6.5) |
| Baseline laboratory values (mean ± SD) | |
| Haemoglobin, g/dL | 13.0 ± 1.6 |
| Albumin, g/dL | 4.1 ± 0.8 |
| PRA levels, % [n (%)]f | |
| Peak PRA >10% | 4 (3.4) |
| Current PRA >10% | 2 (1.7) |
| Peak or current PRA >50% | 0 (0.0) |
Includes glaucoma, cataracts or retinopathy.
Demonstrated by CT scan.
One patient had colorectal carcinoma and non-melanoma skin cancer.
Includes atheroembolic renal disease and light chain deposition disease.
Data on CMV serostatus were not available in five patients.
Data on PRA levels were not available in 20 patients.
AA, amyloid A; BMI, body mass index; D, donor; HBsAg, hepatitis B virus surface antigen; PRA, panel reactive antibody; R, recipient.
Donor characteristics are presented in Table 2. Median (IQR) age was 77.0 years (74.7–79.0) and 31 of them (22.5%) were ≥80 years. Pre-implantation biopsy was performed in 75 procedures (54.3%). Glomerular sclerosis was most commonly <10% (70.7%), whereas only 11 cases (14.7%) had a percentage ≥15.
Donor characteristics (n = 138)
| Variable | |
|---|---|
| Age at donation [median (range)], years | 77.0 (74.7–79.0) |
| Gender (male), n (%)a | 54 (45.8) |
| sCr level (mean ± SD), mg/dL | 0.7 ± 0.2 |
| Glomerular sclerosis, n/N (%)b | |
| No sclerosis | 19/75 (25.3) |
| <10% of glomeruli per biopsy | 34/75(45.3) |
| 10–15% of glomeruli per biopsy | 11/75 (14.7) |
| 15–20% of glomeruli per biopsy | 8/75 (10.7) |
| >20% of glomeruli per biopsy | 3/75 (4.0) |
| DBD donor, n (%) | 138 (100.0) |
| Cause of death, n (%) | |
| Stroke | 114 (82.6) |
| Trauma | 20 (14.5) |
| Anoxia | 4 (2.9) |
| Number of HLA mismatches [median (IQR)] | 4 (3–5) |
Data on donor gender were not available in 20 patients.
Percentages based on 75 donors who underwent pre-transplant kidney biopsy.
DBD, donation after brain death.
Most patients [91.9% (124/135)] received induction with an anti-CD25 monoclonal antibody. Maintenance regimen mainly consisted of tacrolimus, mycophenolic acid (MPA) and steroids [123/135 (91.1% of patients with available data); Table 3]. Steroid minimization with subsequent withdrawal was carried out in 18.5% (25/135) of the patients, whereas 11.1% (15/135) underwent conversion to the mammalian target of rapamycin inhibitor to minimize tacrolimus nephrotoxicity or with the aim of controlling CMV or BK polyomavirus viremia.
Peri-transplant variables and early post-transplant events (n = 138)
| Variable | |
|---|---|
| Type of transplant, n (%) | |
| Single kidney | 131 (94.9) |
| Double kidney | 7 (5.1) |
| Cold ischaemia time (mean ± SD), h | 22.5 ± 5.0 |
| Induction therapy, n (%)a | |
| Basiliximab | 122 (90.4) |
| Daclizumab | 2 (1.5) |
| ATG | 6 (4.4) |
| None | 5 (3.7) |
| Primary immunosuppression regimen, n (%)a | |
| Tacrolimus, MPA, steroids | 123 (91.1) |
| Tacrolimus, azathioprine, steroids | 6 (4.4) |
| Cyclosporine, MPA, steroids | 3 (2.2) |
| Belatacept, MPA, steroids | 2 (1.5) |
| MPA, steroids | 1 (0.7) |
| Delayed introduction of CNI, n/N (%)a,b | 12/132 (9.1) |
| Interval from transplantation to introduction of CNI [median (IQR)], days | 6.5 (4.3–7) |
| CMV antiviral prophylaxis, n (%)a | 8 (5.9) |
| Early initiation of anticoagulant therapy, n (%)a,c | 20 (14.8) |
| Early post-transplant events | |
| PNF, n (%) | 9 (6.5) |
| DGF, n (%) | 74 (53.6) |
| Surgical complications, n (%) | 51 (37.0) |
| Surgical site haematoma | 14 (10.1) |
| Urinary fistula | 14 (10.1) |
| Wound dehiscence | 9 (6.5) |
| Lymphocele | 8 (5.8) |
| Ureteral stenosis | 3 (2.2) |
| Others | 3 (2.2) |
Data on immunosuppression, prophylaxis and anticoagulation therapy were not available in three patients.
Percentage based on the subgroup of patients that received CNI-containing regimens (n = 132).
Anticoagulation therapy was initiated due to elevated renal arterial resistance index in the Doppler examination (n = 7), previous venous thromboembolic event (n = 6), atrial fibrillation (n = 5) or thrombophilia (n = 1).
CNI, calcineurin inhibitor.
Post-transplant complications
Nine patients (6.5%) suffered PNF (Table 3). The causes of PNF included graft thrombosis [n = 3 (two venous and one arterial)], irreversible acute tubular necrosis (n = 3), acute T cell-mediated rejection (n = 1), haemorrhage (n = 1) and urinary fistula (n = 1). Previous KT (OR = 9.62, 95% CI 21.80–51.37; P = 0.008) and the number of human leucocyte antigen (HLA) mismatches [OR (per unitary increment) = 2.17, 95% CI 1.09–4.34; P = 0.028] were identified as independent factors for PNF (Table 4). On the other hand, 74 patients (53.6%) developed DGF, with a median (IQR) time until functional recovery of 6 days (4–11). Some types of surgical complications occurred in 37.0% of patients (51/138).
Univariate and multivariate analysis of risk factors for the occurrence of PNF
| PNF (n = 11) | Graft function (n = 127) | P-valuea | Univariate, OR (95% CI) | Multivariatee, OR (95% CI) | P-value | |
|---|---|---|---|---|---|---|
| Recipient age (mean ± SD), years | 78.4 ± 2.4 | 78.1 ± 2.4 | 0.708 | |||
| Recipient gender (male), n (%) | 9 (81.8) | 74 (58.3) | 0.199 | |||
| Pre-transplant conditions, n (%) | ||||||
| Diabetes mellitus | 6 (54.5) | 39 (30.7) | 0.176 | |||
| Heart disease | 3 (27.3) | 60 (47.2) | 0.202 | |||
| Atherothrombotic diseaseb | 3 (27.3) | 45 (35.4) | 0.747 | |||
| Venous thromboembolic event | 1 (9.1) | 9 (7.2) | 0.583 | |||
| Obesity | 5 (45.5) | 32 (25.6) | 0.170 | |||
| Prior KT, n (%) | 3 (27.3) | 6 (4.7) | 0.025 | 7.56 (1.59–35.98) | 9.62 (21.80–51.37) | 0.008 |
| Chronic hypertensive nephropathy, n (%) | 3 (27.3) | 33 (26.0) | 1.000 | |||
| Diabetic nephropathy, n (%) | 5 (45.5) | 28 (22.0) | 0.132 | |||
| Glomerular disease, n (%) | 0 (0.0) | 13 (10.2) | 0.599 | |||
| Positive anti-HCV serostatus, n (%) | 0 (0.0) | 5 (3.9) | 1.000 | |||
| Pre-transplant renal replacement therapy, n (%) | 10 (90.9) | 109 (85.8) | 1.000 | |||
| Dialysis vintage [median (IQR)], months | 19 (6.8–28.5) | 12 (8–24) | 0.585 | |||
| Donor age (mean ± SD), years | 78.6 ± 3.1 | 76.3 ± 4.5 | 0.106 | |||
| Donor sCr level (mean ± SD), mg/dL | 0.8 ± 0.2 | 0.8 ± 0.2 | 0.862 | |||
| Number of HLA mismatches [median (IQR)]c | 4.5 (4–5) | 4 (3–5) | 0.025 | 1.98 (1.04–3.76) | 2.17 (1.09–4.34) | 0.028 |
| Peak PRA level >10%, n (%)d | 1 (16.7) | 3 (3.6) | 0.245 | |||
| Cold ischaemia time (mean ± SD), h | 22.2 ± 3.9 | 22.5 ± 5.1 | 0.857 | |||
| Double KT, n (%) | 0 (0.0) | 7 (5.5) | 1.000 | |||
| ATG as induction therapy, n (%) | 0 (0.0) | 6 (4.8) | 1.000 |
Univariate P-values <0.05 are indicated in bold characters.
Coronary artery disease, cerebrovascular disease and/or peripheral arterial disease in lower limbs.
OR per unitary increment.
Data on PRA levels were not available in 4 and 16 patients in the ‘PNF’ and ‘graft function’ groups, respectively.
Hosmer and Lemeshow test P = 0.868.
PRA, panel reactive antibody.
The cumulative incidence rate of BPAR was 15.2% (21/138) (Table 5). Most of the episodes of BPAR were T cell-mediated [63.6% (14/22)], followed by antibody-mediated episodes [27.3% (6/22)]. All patients diagnosed with T cell-mediated rejection were treated with steroid boluses and two of them also received ATG due to steroid resistance. Episodes of antibody-mediated rejection received steroid boluses, plasmapheresis and intravenous immunoglobulins, whereas rituximab was additionally used in two of them.
Cumulative incidence of major post-transplant events in the overall cohort (n = 138)
| Post-transplant event | |
|---|---|
| BPAR, n (%) | 21 (15.2) |
| Two or more episodes | 1/21 (4.8) |
| Interval from transplantation [median (IQR)], days | 55 (24–131.5) |
| Biopsy-proven chronic rejection, n (%) | 6 (4.3) |
| Post-transplant infection, n (%) | 97 (70.3) |
| Urinary tract infection | 57 (41.3) |
| Bloodstream infection | 43 (31.2) |
| Lower respiratory tract infection and pneumonia | 32 (23.2) |
| Surgical site infection | 26 (18.8) |
| CMV disease | 27 (19.6) |
| Viral syndrome | 14 (10.1) |
| Colitis | 12 (8.7) |
| Esophagitis | 1 (0.7) |
| Digestive tract infection | 24 (17.4) |
| Infective endocarditis | 6 (4.3) |
| Proven or probable IFD | 9 (6.5) |
| Invasive candidiasis | 5 (3.6) |
| Invasive aspergillosis | 4 (2.9) |
| Renal artery stenosis, n (%) | 16 (11.6) |
| NODAT, n (%) | 11 (8.0) |
| Cardiovascular event, n (%) | 36 (26.1) |
| Congestive heart failure | 26 (18.8) |
| Acute coronary syndrome | 4 (2.9) |
| Stroke | 3 (2.2) |
| Critical peripheral arterial diseasea | 3 (2.2) |
| Venous thromboembolic event, n (%) | 6 (4.3) |
| De novo malignancy, n (%) | 21 (15.2) |
| Solid organ tumourb | 9 (6.5) |
| Non-melanoma skin carcinoma | 8 (5.8) |
| Kaposi sarcoma | 3 (2.2) |
| Multiple myeloma | 1 (0.7) |
| Graft loss (including PNF), n (%) | 18 (13.0) |
| All-cause mortality at the end of follow-up, n (%) | 63 (45.7) |
| 1-year mortality rate | 20 (14.5) |
| 5-year mortality rate | 42 (30.4) |
Ischaemic pain at rest, ulcer or gangrene in one or both legs attributed to proven peripheral arterial disease.
Primary sites included lung (n = 4), prostate (n = 2), pancreas (n = 1), bladder (n = 1) and kidney (n = 1).
NODAT, new onset diabetes mellitus after transplantation.
Overall, 97 patients (70.3%) developed 182 episodes of post-transplant infection during the follow-up (Table 5). The most common source was the urinary tract [41.3% (57/138)]. The diagnosis of CMV disease was established in 19.6% of patients (27/138) after a median (IQR) interval of 79 days (40.5–388.8), mostly in the form of viral syndrome. The incidence of proven or probable IFD was 6.5% (9/138), with invasive candidiasis accounting for most of the cases.
The cumulative incidence of cardiovascular events was 26.1% (36/138), including coronary artery disease [2.9% (4/138)], cerebrovascular disease [2.2% (3/138)] and lower limb peripheral arterial disease with critical ischaemia [2.2% (3/138)]. New-onset diabetes after transplantation was diagnosed in 8.0% (11/138) of the overall cohort and 11.8% (11/93) of non-diabetic patients at the time of transplantation.
The rate of de novo malignancy was 15.2% (21/138), mainly in the form of solid organ tumour [6.5% (9/138)]. The median (IQR) interval to the diagnosis was 22.3 months (15.5–51.2).
Patient outcomes
Sixty-three patients (45.6%) died during follow-up at a median (IQR) interval of 38.1 months (7.7–77.4). One- and 5-year patient survival rates were 82.1 and 60.1%, respectively (Figure 1). Post-transplant infection [46.0% (29/63)], cardiovascular event [22.2% (14/63)] and malignancy [4.8% (3/63)] were the most common causes of death [that could not be identified in 12.7% of cases (8/63)]. Very early mortality (i.e. within the first month) occurred in 2.9% of patients (4/138) and was due to cardiovascular disease [acute myocardial infarction (n = 2) and acute mesenteric ischaemia (n = 1)] and infection [septic shock secondary to surgical site infection (n = 1)].
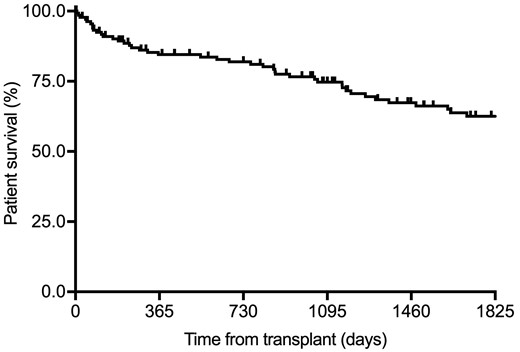
Kaplan–Meier curve for patient survival in the overall study cohort (n = 138).
Venous thromboembolic event previous to transplantation and BPAR during the first post-transplant year were associated with lower 1-year survival at the univariate level. Only the occurrence of BPAR (HR = 4.21, 95% CI 1.64–10.82; P = 0.003) remained in the multivariate Cox model (Table 6).
Factors predicting 1-year patient survival in the overall cohort (n = 138)
| Survivors (n = 118) | Non-survivors (n = 20) | P-valuea | Univariate, HR (95% CI) | P-value | Multivariate, HR (95% CI) | P-value | |
|---|---|---|---|---|---|---|---|
| Recipient age (mean ± SD), years | 78.1 ± 2.3 | 78.1 ± 2.9 | 0.920 | ||||
| Recipient gender (male), n (%) | 69 (58.5) | 14 (70.0) | 0.330 | ||||
| Pre-transplant conditions, n (%) | |||||||
| Diabetes mellitus | 41 (34.7) | 4 (20.0) | 0.193 | ||||
| Heart disease | 50 (42.4) | 13 (65.0) | 0.060 | ||||
| Cerebrovascular disease | 20 (16.9) | 1 (5.0) | 0.310 | ||||
| Lower limb peripheral arterial disease | 14 (11.9) | 3 (15.0) | 0.714 | ||||
| Atherothrombotic diseaseb | 42 (35.6) | 6 (30.0) | 0.627 | ||||
| Chronic obstructive pulmonary disease | 16 (13.7) | 3 (15.0) | 1.000 | ||||
| Venous thromboembolic event | 6 (5.2) | 4 (20.0) | 0.040 | 3.27 (1.09–9.79) | 0.034 | – | – |
| Obesity | 30 (25.9) | 7 (35.0) | 0.396 | ||||
| Malignancy | 21 (18.1) | 4 (20.0) | 0.763 | ||||
| Prior KT, n (%) | 6 (5.1) | 3 (15.0) | 0.124 | ||||
| Chronic hypertensive nephropathy, n (%) | 31 (26.3) | 5 (25.0) | 0.905 | ||||
| Diabetic nephropathy, n (%) | 31 (26.3) | 2 (10.0) | 0.158 | ||||
| Glomerular disease, n (%) | 12 (10.2) | 1 (5.0) | 0.692 | ||||
| Tubulointerstitial nephritis, n (%) | 9 (7.6) | 3 (15.0) | 0.382 | ||||
| Positive anti-HCV serostatus, n (%) | 3 (2.5) | 2 (10.0) | 0.153 | ||||
| Pre-transplant renal replacement therapy, n (%) | 101 (85.6) | 18 (90.0) | 1.000 | ||||
| Dialysis vintage [median (IQR)], months | 12 (8–22.5) | 22.5 (7–35.3) | 0.131 | ||||
| Baseline haemoblogin (mean ± SD), g/dL | 13.1 ± 1.6 | 12.6 ± 1.8 | 0.161 | ||||
| Baseline albumin (mean ± SD), g/dL | 4.2 ± 0.9 | 4.1 ± 0.4 | 0.617 | ||||
| Donor age (mean ± SD), years | 76.3 ± 4.3 | 77.3 ± 4.9 | 0.368 | ||||
| Number of HLA mismatches [median (IQR)] | 4 (3–5) | 4.5 (4–5) | 0.163 | ||||
| Peak PRA level >10%, n (%)c | 2 (2.6) | 2 (15.4) | 0.098 | ||||
| Cold ischaemia time (mean ± SD), h | 22.3 ± 4.9 | 23.7 ± 5.3 | 0.292 | ||||
| ATG as induction therapy, n (%) | 5 (4.3) | 1 (5.0) | 1.000 | ||||
| CMV antiviral prophylaxis, n (%)d | 7 (6.1) | 1 (5.0) | 1.000 | ||||
| Early initiation of anticoagulant therapy, n (%)d | 16 (13.9) | 4 (20.0) | 0.498 | ||||
| DGF, n (%)e | 64 (57.1) | 10 (66.7) | 0.482 | ||||
| BPAR in the first year, n (%) | 13 (11.0) | 7 (35.0) | 0.011 | 3.63 (1.44–9.14) | 0.006 | 4.21 (1.64–10.82) | 0.003 |
Univariate P-values <0.05 are indicated in bold characters.
Coronary artery disease, cerebrovascular disease and/or peripheral arterial disease in lower limbs.
Data on PRA levels were not available in 20 patients.
Data on prophylaxis and anticoagulation therapy were not available in three patients.
Patients with PNF were excluded.
PRA, panel reactive antibody.
A previous history of chronic heart disease and peripheral artery disease, positive serology for hepatitis C virus (HCV) and the occurrence of DGF were found to predict 5-year patient survival at the univariate analysis. Pre-transplant heart disease (HR = 3.74, 95% CI 1.75–7.98; P = 0.001), positive anti-HCV serology (HR = 3.97, 95% CI 1.36–11.59; P = 0.012) and DGF (HR = 2.52, 95% CI 1.18–5.39; P = 0.018) acted as independent risk factors (Table 7). Neither recipient nor donor age was found to have a significant impact on 1- or 5-year survival.
Factors predicting 5-year patient survival in the overall cohort (n = 138)
| Survivors (n = 96) | Non-survivors (n = 42) | P-valuea | Univariate, HR (95% CI) | P-value | Multivariate, HR (95% CI) | P-value | |
|---|---|---|---|---|---|---|---|
| Recipient age (mean ± SD), years | 78.2 ± 2.4 | 77.9 ± 2.4 | 0.541 | ||||
| Recipient gender (male), n (%) | 56 (58.3) | 27 (64.3) | 0.511 | ||||
| Pre-transplant conditions, n (%) | |||||||
| Diabetes mellitus | 31 (32.3) | 14 (33.3) | 0.904 | ||||
| Heart disease | 34 (35.4) | 29 (69.0) | 0.0002 | 2.84 | 0.002 | 3.74 | 0.001 |
| Cerebrovascular disease | 15 (15.6) | 6 (14.3) | 0.840 | ||||
| Lower limb peripheral arterial disease | 8 (8.3) | 9 (21.4) | 0.031 | 2.41 | 0.020 | – | – |
| Atherothrombotic diseaseb | 29 (30.2) | 19 (45.2) | 0.088 | ||||
| Chronic obstructive pulmonary disease | 13 (13.7) | 6 (14.3) | 0.925 | ||||
| Venous thromboembolic event | 4 (4.3) | 6 (14.3) | 0.069 | ||||
| Obesity | 22 (23.4) | 15 (35.7) | 0.136 | ||||
| Malignancy | 17 (18.1) | 8 (19.0) | 0.893 | ||||
| Prior KT, n (%) | 5 (5.2) | 4 (9.5) | 0.455 | ||||
| Chronic hypertensive nephropathy, n (%) | 26 (27.1) | 10 (23.8) | 0.687 | ||||
| Diabetic nephropathy, n (%) | 22 (22.9) | 11 (26.2) | 0.678 | ||||
| Glomerular disease, n (%) | 11 (11.5) | 2 (4.8) | 0.343 | ||||
| Tubulointerstitial nephritis, n (%) | 7 (7.3) | 5 (11.9) | 0.512 | ||||
| Positive anti-HCV serostatus, n (%) | 1 (1.0) | 4 (9.5) | 0.030 | 3.95 | 0.009 | 3.97 | 0.012 |
| Donor age (mean ± SD), years | 76.3 ± 4.3 | 76.8 ± 4.8 | 0.555 | ||||
| Number of HLA mismatches [median (IQR)] | 4 (3–5) | 4.5 (4–5) | 0.311 | ||||
| Peak PRA level >10%, n (%)c | 2 (3.2) | 2 (7.1) | 0.586 | ||||
| CMV antiviral prophylaxis, n (%)d | 7 (7.4) | 1 (2.4) | 0.434 | ||||
| Early initiation of anticoagulant therapy, n (%)d | 14 (14.9) | 6 (14.6) | 0.969 | ||||
| DGF, n (%)e | 47 (51.6) | 27 (75.0) | 0.016 | 2.72 | 0.010 | 2.52 | 0.018 |
| BPAR, n (%) | 12 (12.5) | 9 (21.4) | 0.179 | ||||
| Graft function at Month 12 (CKD-EPI), mL/min/1.73 m2 | 40.5 ± 13.6 | 39.8 ± 14.3 | 0.840 |
Univariate P-values <0.05 are indicated in bold characters.
Coronary artery disease, cerebrovascular disease and/or peripheral arterial disease in lower limbs.
Data on PRA levels were not available in 20 patients.
Data on prophylaxis and anticoagulation therapy were not available in three patients.
Patients with PNF were excluded.
CKD-EPI, Chronic Kidney Disease Epidemiology Collaboration equation; PRA, panel reactive antibody.
Graft outcomes
Once those patients that developed PNF were excluded (n = 11), seven recipients (5.1%) experienced graft loss after a median (IQR) interval of 175 days (34–805) from transplantation. One- and 5-year death-censored graft survival rates were 95.6 and 93.1%, respectively (Figure 2). The only factor that influenced 5-year death-censored graft survival was the presence of diabetic nephropathy (HR = 4.82, 95% CI 1.08–21.56; P = 0.040) (Table 8).
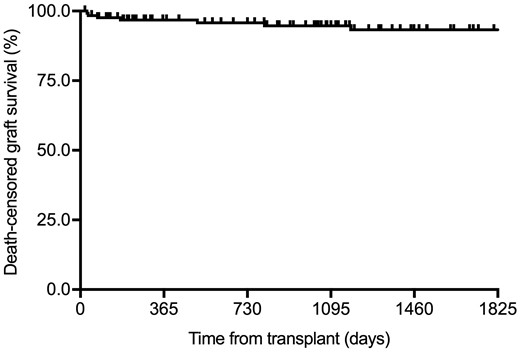
Kaplan–Meier curve for death-censored graft survival after excluding patients that developed PNF (n = 127).
Factors predicting 5-year death-censored graft survival after excluding those patients that developed PNF (n = 127)
| Graft survival (n = 120) | Graft failure (n = 7) | P-valuea | HR (95% CI) | P-value | |
|---|---|---|---|---|---|
| Recipient age (mean ± SD), years | 77.9 ± 2.3 | 79.8 ± 3.5 | 0.229 | ||
| Recipient gender (male), n (%) | 69 (57.5) | 5 (71.4) | 0.698 | ||
| Pre-transplant conditions, n (%) | |||||
| Diabetes mellitus | 35 (29.2) | 4 (57.1) | 0.200 | ||
| Heart disease | 56 (46.7) | 4 (57.1) | 0.706 | ||
| Atherothrombotic diseaseb | 41 (34.2) | 4 (57.1) | 0.244 | ||
| Venous thromboembolic event | 9 (7.6) | 0 (0.0) | 1.000 | ||
| Obesity | 29 (24.6) | 3 (42.9) | 0.371 | ||
| Prior KT, n (%) | 6 (5.0) | 0 (0.0) | 1.000 | ||
| Chronic hypertensive nephropathy, n (%) | 32 (26.7) | 1 (14.3) | 0.676 | ||
| Diabetic nephropathy, n (%) | 24 (20.0) | 4 (57.1) | 0.042 | 4.82 (1.08–21.56) | 0.040 |
| Glomerular disease, n (%) | 13 (10.8) | 0 (0.0) | 1.000 | ||
| Tubulointerstitial nephritis, n (%) | 10 (8.3) | 0 (0.0) | 1.000 | ||
| Positive anti-HCV serostatus, n (%) | 5 (4.2) | 0 (0.0) | 1.000 | ||
| Dialysis vintage [median (IQR)], months | 12 (8 - 23.8) | 23 (9 - 34.5) | 0.317 | ||
| Donor age (mean ± SD), years | 76.4 ± 4.5 | 74.9 ± 3.3 | 0.387 | ||
| Donor sCr level (mean ± SD), mg/dL | 0.7 ± 0.2 | 0.6 ± 0.3 | 0.305 | ||
| Number of HLA mismatches [median (IQR)] | 4 (3–5) | 5 (2–6) | 0.597 | ||
| Peak PRA level >10%, n (%)c | 3 (3.8) | 0 (0.0) | 1.000 | ||
| Cold ischaemia time (mean ± SD), h | 22.4 ± 5.2 | 24.2 ± 2.1 | 0.417 | ||
| ATG as induction therapy, n (%) | 6 (5.1) | 0 (0.0) | 1.000 | ||
| DGF, n (%) | 69 (57.5) | 5 (71.4) | 0.698 | ||
| BPAR, n (%) | 19 (15.8) | 1 (14.3) | 1.000 |
P-values <0.05 are indicated in bold characters.
Coronary artery disease, cerebrovascular disease and/or peripheral arterial disease in lower limbs.
Data on PRA levels were not available in 16 patients.
Data on prophylaxis and anticoagulation therapy were not available in three patients.
PRA, panel reactive antibody.
Regarding the evolution of graft function, eGFR remained essentially stable from Month 6 through Year 5 after transplantation (41.3 ± 16.7 versus 47.1 ± 17.1 mL/min/1.73 m2, respectively; P-value for trend = 0.218), whereas 24-h proteinuria decreased during this period (0.61 ± 1.34 versus 0.39 ± 0.31 g; P-value for trend = 0.045; Figure 3).
Evolution of graft function throughout the first 5 years after transplantation: (A) eGFR and (B) 24-h proteinuria. Mean values are represented by circles and SDs are represented by whiskers. CKD-EPI, Chronic Kidney Disease Epidemiology Collaboration equation.
DISCUSSION
Although favourable outcomes have been reported for old KT recipients [9–11], previous experiences included selected patients with low comorbidity burden that received grafts from substantially younger deceased or living donors. To our knowledge, the present study is the first one to analyse long-term outcomes in a cohort of extremely elderly recipients—with substantial comorbidity—from similarly aged deceased donors (median ages of 77.5 and 77.0 years, respectively). Donor–recipient age matching prevents elderly subjects from competing on the waiting list with younger recipients for grafts from young donors. Our experience also clarifies a number of concerns regarding the benefits to be expected from KT in this rapidly increasing age segment within the ESRD population. Thus, we suggest that patients aged ≥75 years with no absolute contraindications (i.e. severe underlying conditions or recent malignancy) should be considered for transplantation. In addition, grafts used in this setting may come from extremely aged donors that would not be otherwise suitable for younger recipients. Our group had previously reported that a non-negligible number of kidneys from donors ≥60 years are discarded due to the absence of suitable elderly candidates [16]. Furthermore, the present experience supports that preserved renal function in the donor and adequate graft appearance are valid criteria to ensure an appropriate renal mass without the need of dual transplantation in this type of recipients.
An important consideration in the present study is that the long-term survival observed was significantly higher than that reported for ESRD patients of similar age that remain on dialysis in Spain [1]. Other series have observed a 5-year survival rate as low as 12.5% for dialysed patients ≥75 years and 29% for those on the waiting list [17]. Analyses from the US Renal Data System [2, 17, 18] and the Norwegian Renal Registry [19] have also found an increased survival for older ESRD patients that underwent KT as compared with those listed or on dialysis, although recipients in these studies usually had a low comorbidity burden and received grafts from much younger donors. Likewise, an estimation tool based on a combination of the Kidney Donor Profile Index (KDPI) and the Estimated Post-Transplant Survival Score (EPTS) has demonstrated an absolute mortality reduction in patients receiving marginal kidneys compared with waitlisted individuals. For example, 5-year survival in subjects with an EPTS of 80 was 47% among KT candidates as compared with 70% for transplanted patients with a KDPI as high as 80. Of note, the impact of KDPI on survival benefit was greatly influenced by EPTS [20]. A recent analysis from the United Network of Organ Sharing reported lower mortality after the first year in patients >60 years that received a graft with a KDPI >85 years (either for pre-emptive and non-pre-emptive transplantation) [21]. It should be noted that data recently published from the French national cohort on KT recipients >70 years found no benefit in terms of survival as compared with those that remained listed, but survival was still better than in a similar population on dialysis [22]. In addition to increased survival rates, elderly recipients score higher in all HRQoL domains than dialysed patients and even than the general population of similar age and gender [23].
Patient survival at 1 (82.1%) and 5 years (60.1%) was remarkable considering the advanced age of the recruited patients (mean of 77.0 years, with one-fifth of them exceeding 80 years) and the amount of pre-transplant comorbidities. Perioperative mortality was lower than that reported after hip replacement surgery in a similarly aged cohort in Spain (2.9% versus 5.3%, respectively) [24], with deaths due to cardiovascular and infectious complications. An increased mortality risk in the elderly population during the first post-transplant months in comparison with listed patients has been already observed in an analysis from the Scientific Registry of Transplant Recipients including >5000 patients aged >70 years. Nonetheless, this risk appeared to significantly decrease in the longer term [18].
The only factor independently associated with 1-year mortality was previous BPAR. Heldal et al. reported that the occurrence of an acute rejection episode during the first 3 months was a strong predictor of premature death in recipients >60 years old. However, in the younger group, early rejection only predicted death-censored graft loss [9]. In the study by Lemoine et al. [25] on KT recipients aged >70 years, acute rejection was identified as a risk factor for patient death or graft loss within the first year. Since the infection was the main cause of death in our cohort (accounting for 46.0% of fatal cases), it is plausible that the host’s increased susceptibility resulting from the combined effect of immunosenescence and anti-rejection therapy could have played a negative impact on patient survival through the first post-transplant year. High mortality rates due to infectious complications in elderly recipients have been described in the previous series [19, 25, 26]. Thus, targeted prevention practices should be encouraged in this patient population, including prolonged prophylaxis or tapering of immunosuppression (with particular focus on strategies aimed at early steroid withdrawal).
The incidence observed for BPAR (15.2%) was lower than that reported from the Eurotransplant Senior Program (ESP) study (43.2%) [27], in which recipient mean age (67.9 years) was notably lower than in our cohort. The greater immunogenicity of kidneys from aged donors is well described as well as the higher impact of acute rejection on graft function due to less functional reserve and lower recovery capacity [28]. Although BPAR was not associated with graft loss, we did find an association with patient mortality within the first year.
Currently, there is no agreement on the optimal immunosuppression for elderly recipients. Tacrolimus-based regimens, either with early initiation after transplantation or in a delayed fashion, followed by steroid withdrawal have shown favourable results [29]. Although evidence is scarce, standard triple immunosuppression containing low doses of MPA, steroids and calcineurin inhibitors—with or without anti-CD25 induction—is the most frequently used in the elderly segment of KT recipients [30].
The incidence of PNF in the present cohort (6.5%) was very similar to that reported from the ESP (7.9%) [31]. A global analysis of the ESP reported similar percentages of PNF in the group of donors ≥65 years whose grafts were allocated to recipients ≥65 years (7.3%) or to recipients of any age (8.3%). On the other hand, PNF was less common in the group of recipients between 60 and 64 years of age that received a kidney from a younger donor, suggesting an impact for donor age [32]. We found no association between PNF and donor age, presumably due to the extremely aged donor pool in our study. Nevertheless, the fact that previous transplantation and the number of HLA mismatches were identified as independent risk factors for PNF would rather point to an immunological basis.
Once excluding patients with never-functioning grafts, 1- and 5-year death-censored graft survival was excellent (95.6% and 93.1%, respectively). Diabetic nephropathy was the only risk factor for graft loss identified. However, it is possible that the low number of events would have prevented the identification of additional predisposing factors. Of note, neither donor age nor the extent of glomerular sclerosis in the pre-implantation biopsy were associated with long-term graft loss. As expected, the main cause of graft loss was recipient death. In fact, as many as 84.1% of the patients died with a functioning graft, suggesting that pre-transplant donor and graft assessment on the basis of clinical and macroscopic features constitutes a valid method for ensuring good outcomes and obviates the need for pre-implantation biopsy. Although graft outcomes are worse when aged deceased donors are used as compared with younger ones, our series shows that the long-term function of grafts obtained from donors with a median age of 77 years is expected to be good enough to ensure an acceptable dialysis-free survival among extremely elderly ESRD patients, since most of them died with a functioning graft. On the contrary, we consider that the use of grafts from younger donors in the very elderly population is inadequate since ‘effective’ time of graft function is lost because of lower life expectancy [5]. Indeed, donor–recipient age matching (old-for-old) has shown good results, as already shown by our group [11, 33] and further supported by reports from other registries that described a survival benefit for patients receiving grafts from donors aged >65 years [34–36].
The main limitation of our study lies in the lack of a control group composed of ESRD patients with comparable age and comorbidities remaining on dialysis or on the waiting list. Therefore, all comparisons have been made with previous experiences reported in the literature. We did not assess HRQoL following transplantation. The relatively small sample and low number of certain events (i.e. graft loss) may have limited statistical power to detect outcome determinants. Finally, the single-centre design could compromise the external validity of our results.
In conclusion, the present experience suggests that ESRD patients aged ≥75 years without absolute contraindications (i.e. severe conditions or recent malignancy) can successfully undergo KT from extremely aged deceased donors, resulting in a survival benefit when compared with those that remain on dialysis or listed for transplantation. The use of kidneys from extremely age deceased donors would offer the possibility of transplantation to very old recipients without a detrimental impact on younger candidates in terms of organ allocation.
ACKNOWLEDGEMENTS
The authors would like to acknowledge Mari Paz Cebrián, Sofía Vázquez, María Soledad Vereda, Enriqueta Nuño, Tomás Bello, Dr Rosario Berterretche, Dr Alicia Alemán, Dr Oscar Noboa, Dr Alejandro Ferreiro and Dr Ec Fiorella Cavalleri for their valuable collaboration in patient management and data collection.
FUNDING
This research was supported by ‘Plan Nacional de I + D+I’ and Instituto de Salud Carlos III [Proyecto Integrado de Excelencia (PIE) 13/00045], Subdirección General de Redes y Centros de Investigación Cooperativa, Spanish Ministry of Science, Innovation and Universities, Spanish Renal Research Network [REDinREN (RD12/0021/0029)]—co-financed by the European Development Regional Fund (EDRF) ‘A way to achieve Europe’ and by the Fundación Mutua Madrileña (FMM 2017). J.C. holds an ISN-Saulo Klahr-funded fellowship. M.F.-R. holds a clinical research contract ‘Miguel Servet’ (CP 18/00073) from the Spanish Ministry of Science, Innovation and Universities, Instituto de Salud Carlos III.
AUTHORS’ CONTRIBUTIONS
J.C., M.F.-R., H.T., E.G. and A.A. designed the original research; J.C., M.F.-R., H.T., E.G., M.M., N.P., E.H., E.M., E.G., J.R.M. and A.C. carried out carried assessment and data collection; J.C. and M.F.-R. performed statistical analysis; J.C., M.F-R. and H.T. drafted the manuscript; and A.R.-A., M.P. and A.A. critically reviewed and completed the final draft of the manuscript.
CONFLICT OF INTEREST STATEMENT
The authors have no conflicts of interest to disclose. The results presented in this article have not been published previously in whole or part, except in abstract format.
REFERENCES
Spanish National Transplant Organization (Organización Nacional de Trasplantes). Memorias de actividad y donacion en trasplantes, año
European Renal Association-European Dialysis and Transplant Association (ERA-EDTA) Registry. ERA-EDTA Registry Annual Report 2017,


Comments