


Abstract
Patients with chronic kidney disease (CKD) are more prone to develop premature age-related diseases. Data on immune senescence are scarce in CKD populations, except in end-stage renal disease and dialysis. We designed a longitudinal prospective study to evaluate immune senescence at different CKD stages and its influence on CKD patient outcomes.
Clinical and biological data collections were performed on 222 patients at different CKD stages [1–2 (n = 85), 4 (n = 53) and 5 (n = 84)]. Immune senescence biomarkers were measured by cytometry on T cells (CD28, CD57, CD45RA, CD31, γH2A.X) or by quantitative polymerase chain reaction [relative telomere length (RTL)] on peripheral blood mononuclear cells and analysed according to CKD stages and outcomes.
CKD was associated with an increase in immune senescence and inflammation biomarkers, as follows: low thymic output (197 ± 25 versus 88 ± 13 versus 73 ± 21 CD4+CD45RA+CD31+ T cells/mm3), an increased proportion of terminally differentiated T cells (CD8+CD28−CD57+) (24 ± 18 versus 32 ± 17 versus 35 ± 19%) restricted to cytomegalovirus-positive patients, telomere shortening (1.11 ± 0.36 versus 0.78 ± 0.24 versus 0.97 ± 0.21 telomere:single copy ratio) and an increase in C-reactive protein levels [median 2.9 (range 1.8–4.9) versus 5.1 (27–9.6) versus 6.2 (3.4–10.5) mg/L]. In multivariate analysis, shorter RTL was associated with death {hazard ratio [HR] 4.12 [95% confidence interval (CI) 1.44–11.75]}. Low thymic output was associated with infections [HR 1.79 (95% CI (1.34–9.58)] and terminally differentiated CD8+ T-cell expansion with a risk of cardiovascular events [CEs; HR 4.86 (95% CI 1.72–13.72)].
CKD was associated with premature immune ageing. Each of these alterations increased the risk of specific age-related diseases, such as RTL and death, thymic function and infections and terminally differentiated CD8+ T-cell expansion and CEs.
INTRODUCTION
Immune senescence contributes to the development of age-related diseases (i.e. infections, cancers, autoimmune diseases, atherosclerosis) [1–4]. Chronic viral infections, with cytomegalovirus (CMV) as a frontline virus, amplify this phenomenon. These immune changes define the immune risk profile reported by Wikby et al. [5] in octogenarian and nonagenarian populations and are associated with shorter lifespan.
Chronic kidney disease (CKD) patients exhibited clinical features of premature ageing. Indeed, CKD patients have a shorter lifespan compared with the general population [6], mostly due to an increase in so-called age-related diseases, such as cancer [7–10], infections [11–14] and cardiovascular diseases [6, 15–17]. Although the mechanisms involved in CKD-associated premature ageing are not fully elucidated, several factors, including accumulation of uraemic toxins, phosphorus-calciumdisorders, dialysis-related bioincompatibilities and chronic diseases often associated with CKD (diabetes mellitus, chronic heart failure and obesity) may play an important role [18]. These factors promote chronic oxidative stress and inflammation, sometimes termed ‘inflamm-aging’ [19].
The impact of uraemia on the immune system has been previously studied in end-stage renal disease (ESRD) patients. Betjes et al. [20, 21] described lower thymic output, CD4+ T-cell lymphopenia with an inverted CD4:CD8 ratio, a CD28−CD57+ T-cell expansion (thereafter called ‘terminally differentiated’) and telomere attrition in young ESRD patients on dialysis. They further hypothesized that uraemia induces premature immune senescence. Yet the influence of CKD on immune senescence and its clinical impact have not been well reported according to CKD Stage IV, dialysis methods and CMV status.
The aims of our study were first to describe CKD-related immune senescence according to advanced Stage IV CKD and dialysis methods and, second, to analyse the impact of immune senescence on major clinical outcomes.
MATERIALS AND METHODS
Patient population and samples
A total of 222 stable outpatients from the Nephrology Department of the University Hospital of Besançon were prospectively included between 1 September 2013 and 1 August 2016. Patients were split into three groups according to CKD stage: group 1 with normal renal function [estimated glomerular filtration rate (eGFR) >60 mL/min/1.73 m2, Modification of Diet in Renal Disease (MDRD) equation or creatininaemia <120 µmol/L; n = 85), group 2 with severe CKD Stage IV (eGFR 15–30 mL/min/1.73 m2, MDRD; n = 53) and group 3 with ESRD on dialysis [haemodialysis (HD), n = 47; peritoneal dialysis (PD), n = 37; arbitrary eGFR of 5 mL/min/1.73 m2]. The inclusion criterion was age >18 years. Exclusion criteria were a history of cancer, viral infections [hepatitis B virus, hepatitis C virus and human immunodeficiency virus (HIV)], immunosuppressive treatments or a recent infectious episode (<3 months). We quickly observed major differences in the clinical characteristics of the three populations. The more important was a shift towards older age in patients with uraemia. We considered that adjustment for age would not be sufficient to take into account this bias. We then decided to select a subpopulation age-matched (and CMV) to counteract the initial bias. We analysed 35 triplets matched for age, gender and CMV status and studied immune senescence biomarkers in this subpopulation.
Confounding parameters
Clinical parameters including body mass index (BMI), diabetes mellitus (type 1 or 2), chronic heart failure diagnosed by a cardiologist, history of cardiovascular events (CEs; such as arterial bypass, endarterectomy, endoluminal arterial dilatation, stroke or acute coronary syndrome), active tobacco use defined by consumption of at least one cigarette per day and statin treatment were recorded. Dialysis patients were included at least 6 months after the onset of renal replacement therapy. The dose and duration of dialysis were also recorded. Biological data included CMV serological status, β2-microglobulin, calcaemia, phosphataemia, haemoglobin, 25-hydroxyvitamin D3 and chronic inflammation markers [C-reactive protein (CRP), ferritin and albumin]. All patients provided informed consent. The study was approved by the Ethics Committee (approval 13/686) and registered at ClinicalTrials.gov (NCT02116270).
T-cell subset analysis
Absolute numbers of CD4+ and CD8+ T cells were determined using a ‘lyse no wash’ method on fresh samples by a single platform flow cytometry approach using the TetraCXP method, Flow-Count fluorospheres and FC500 cytometer (Beckman Coulter, Villepinte, France) according to the manufacturer’s recommendations. Extended T-cell phenotyping was also performed on fresh samples after isolation of peripheral blood mononuclear cells (PBMCs) by density gradient centrifugation (Pancoll, Pan-Biotech, Aidenbach, Germany). PBMCs were washed twice in RPMI 1640 GlutaMAX TM-I medium (Invitrogen, Cergy-Pontoise, France) containing 10% foetal calf serum (Invitrogen, Carlsbad, CA, USA), hereafter referred to as complete medium. Cells were stained with conjugated antibodies directed against CD3, CD4, CD8, CD45RA, CD28, CD31, CD57 (Supplementary data, Table S1). To detect intracellular γH2AX, surface staining of PBMCs was followed by treatment with a fixation buffer and a permeabilization buffer (respectively, Cytofix Buffer and Phosphow Perm Buffer III, BD Biosciences, Le Pont de Claix, France) and incubated for 30 min in the dark with anti-γH2AX antibody. Cell debris and doublets were excluded on the basis of side versus forward scatter. Cells were analysed on a fluorescence-activated cell sorter (FACS) CANTO II cytometer (BD Biosciences) using FACS Diva (BD Biosciences) software. Thymic output was assessed by both the frequency and absolute number of CD45RA+CD31+ CD4+ T cells obtained using cytometry, hereafter called recent thymic emigrant (RTE), as described by Kohler et al. [22]. Naïve CD4+ and CD8+ T cells were defined as CD45RA+CD28+ and terminally differentiated CD4+ and CD8+ T cells were defined as CD57+CD28−, as previously described [23, 24].
Relative telomere length
DNA was extracted from isolated PBMCs according to the manufacturer’s instructions (QIAMP DNA Blood Mini Kit, reference 51106; Qiagen, Courtaboeuf, France). A Nanodrop ND-1000 spectrophotometer (Labtech, Palaiseau, France) was used to quantify genomic DNA. Genomic DNA was stored in TE buffer (10 mM Tris–HCl, 0.1 mM EDTA, pH 7.5) at 4°C at a concentration of 10 ng/µL. DNA samples were diluted into pure water before starting real-time quantitative multiplex polymerase chain reaction (PCR) runs, described in the Supplementary data. We used a CFX96 Real Time PCR System (Bio-Rad) with Bio-Rad CFX Manager software to generate standard curves and calculate the telomere:single copy (T:S) ratio. Two T:S ratio results were obtained for each sample and the final reported result for one sample in a given run was the average of the two T:S values. The average T:S ratio is expected to be proportional to the average telomere length per cell.
Relative telomerase activity measurement
Telomerase activity of PBMCs was examined using the TeloTAGGG Telomerase PCR ELISA PLUS kit (Roche Diagnostics, Meylan, France) according to the manufacturer’s instructions and as described previously [25].
Clinical outcomes
Deaths and their causes, cardiovascular events and infections (viral or bacterial) requiring hospitalization and antibiotics or antiviral therapy were registered during follow-up.
Statistical analysis
All data are reported as mean ± SD for continuous variables unless otherwise indicated and as percentages for categorical variables. Differences between groups were evaluated using the Fischer exact or chi-square test for categorical variables. Student’s t and Mann–Whitney U tests were used to compare quantitative variables, according to data distribution. The Kruskal–Wallis test was used to compare quantitative variables of three groups. A P-value (two-tailed) <0.05 was considered statistically significant. Data analysis and interpretation were performed using GraphPad Prism software (GraphPad Software, La Jolla, CA, USA). For clinical outcomes of dialysed patients, multivariate Cox regression model analysis was performed with SPSS software (IBM, Armonk, NY, USA) after selection of variables with P-values ≤0.20 in univariate analysis. The results are expressed as the hazard ratio (HR) with 95% confidence interval (CI) with a P-value testing the null hypothesis (HR = 1). Therefore when the P-value is <0.05, the HR is significantly different from 1, either >1 (i.e. increased risk of event) or <1 (i.e. decreased risk of event). To assess the risk of death with clinical outcomes (CEs and infections) of dialysed patients, a multivariate Fine and Gray model analysis was performed with SAS software (version 9.4; SAS Institute, Cary, NC, USA).
RESULTS
Population
Clinical and biological data are summarized in Supplementary data, Table S2. The number of males and age were significantly higher in CKD (Stage IV and dialysed) patients. Patients with CKD experienced more comorbidities, including diabetes, CEs and chronic heart failure. Immune senescence biomarker analysis was performed on three groups (222 patients). Since these patients showed a large difference in terms of age and gender, we carried out an analysis of biomarkers of immune senescence on 105 patients matched for age, gender and CMV status (Table 1). Differences in comorbidity frequencies were less significant between groups in this selected cohort; the three groups were comparable for diabetes, arterial hypertension, active tobacco consumption and statin treatment. As expected, patients in Groups 2 (CKD Stage IV) and 3 (dialysed patients) exhibited all the biological hallmarks of CKD, with a greater frequency of anaemia, low calcium levels, high phosphorus levels, as well as higher calcium–phosphate product. Yet CKD patients had higher vitamin D concentrations, probably because of frequent vitamin D supplementation (Table 1). No difference in T-cell subsets and immune senescence biomarkers was found between HD and PD patients (Supplementary data, Table S3). Therefore the data of these two subgroups were combined in Group 3 for comparison with the data of the other groups.
Baseline characteristics of matched cohort for age, gender and CMV status
| Group 1: patients without uraemia | Group 2: CKD Stage IV | Group 3: Dialysed patients | P-value | |
|---|---|---|---|---|
| N | 35 | 35 | 35 | |
| Age (years) | 66.4 ± 14.5 | 65.5 ± 14.9 | 66.1 ± 13.9 | 0.968 |
| Male, % | 46 | 46 | 46 | 1 |
| BMI (kg/m2) | 27.2 ± 5 | 30.1 ± 6 | 26.2 ± 6 | 0.019 |
| Diabetes mellitus, % | 23 | 43 | 34 | 0.201 |
| Arterial hypertension, % | 86 | 94 | 91 | 0.460 |
| History of CEs, % | 17 | 34 | 49 | 0.020 |
| Chronic heart failure, % | 11 | 26 | 34 | 0.076 |
| Active tobacco, % | 6 | 14 | 9 | 0.461 |
| Statin therapy, % | 40 | 49 | 63 | 0.155 |
| PD/HD, % | 43/57 | |||
| Duration in dialysis (months), median (range) | 23 (7–55) | |||
| Creatinine clearance (mL/min/1.73 m2; MDRD) | 68 ± 24 | 23 ± 4 | <0.001 | |
| CMV seropositive status, % | 66 | 66 | 66 | 1 |
| Calcaemia (mmol/L) | 2.35 ± 0.1 | 2.39 ± 0.13 | 2.31 ± 0.16 | 0.026 |
| Phosphataemia (mmol/L) | 0.96 ± 0.1 | 1.1 ± 0.2 | 1.5 ± 0.4 | <0.001 |
| Calcium × phosphorus product | 2.27 ± 0.3 | 2.54 ± 0.5 | 3.50 ± 0.9 | <0.001 |
| 25-hydroxyvitamin D3 (ng/mL) | 22 ± 10 | 25 ± 10 | 27 ± 12 | 0.095 |
| Haemoglobin (g/dL) | 14 ± 1.2 | 12.7 ± 1.4 | 11.4 ± 1.3 | <0.001 |
| CRP (mg/L), median (range) | 2.9 (1.8–4.9) | 5.1 (2.7–9.6) | 6.2 (3.4–10.5) | 0.003 |
| Albuminaemia (g/L) | 41 ± 3 | 38 ± 4 | 32 ± 4 | <0.001 |
| Ferritin (ng/L), median (range) | 142 (82–285) | 134 (81–248) | 246 (131–567) | 0.014 |
| β2-microglobulin (ng/mL) | 2.5 ± 1 | 6.9 ± 2 | 21 ± 7 | <0.001 |
Results are presented as mean ± SD, except when variables are not normally distributed.
CE: cardiovascular event, PD: peritoneal dialysis, HD: haemodialysis, CRP: C reactive protein.
CKD is associated with a pro-inflammatory profile
In the matched cohort, CKD progression was associated with higher CRP [median 2.9 (range 1.8–4.9) versus 5.1 (27–9.6) versus 6.2 (3.4–10.5) mg/L (P = 0.003), respectively, for Groups 1–3] and higher ferritin levels [median 142 (range 82–285) versus 134 (81–248) versus 246 (131–567) ng/mL (P = 0.014), respectively, for Groups 1–3]. CRP and ferritin levels were negatively correlated with eGFR (r = −0.22, P = 0.025 and r = −0.20, P = 0.037, respectively). CKD progression was associated with decreased albumin levels [41 ± 3 versus 38 ± 4 versus 32 ± 4 g/L (P < 0.001), respectively, for Groups 1–3]. Albumin concentration was positively correlated with eGFR (r = 0.56, P < 0.001) (Table 1).
CKD stage is associated with a premature senescence of the T-cell compartment
Since total lymphocyte count and distribution of lymphocyte subsets depended on age, analyses were performed on the matched cohort. CKD was associated with lower total lymphocyte counts [2 ± 0.6 versus 1.7 ± 0.8 versus 1.3 ± 0.6 g/L (P = 0.001), respectively, for Groups 1–3] and CD4+ T-cell counts [962 ± 66 versus 738 ± 62 versus 638 ± 80/mm3 (P = 0.001), respectively, for Groups 1–3].
An inverted CD4:CD8 ratio was present in Groups 2 (CKD Stage IV) and 3 (dialysed patients) as compared with Group 1 [0 versus 3 versus 9% (P = 0.061), respectively, for Groups 1–3]. An inverted CD4:CD8 ratio was only observed in CMV-seropositive patients. T-cell subsets were also different according to CKD progression.
Naïve CD4+ and CD8+ T cells, defined as CD45RA+CD28+, decreased [45 ± 12 versus 35 ± 16 versus 39 ± 17% (P = 0.002) among CD4+ T cells and 39 ± 18 versus 32 ± 14 versus 28 ± 18% (P = 0.028) among CD8+ T cells, respectively, for Groups 1–3], while terminally differentiated CD4+ and CD8+ T cells, defined as CD57+CD28−, increased [3.3 ± 6 versus 6.6 ± 10 versus 7.0 ± 9% (P = 0.032) in CD4+ T cells and 24 ± 18 versus 32 ± 17 versus 35 ± 19% (P = 0.009) in CD8+ T cells, respectively, for Groups 1–3]. This effect was more pronounced in CD8+ T cells (Supplementary data, Table S4).
Thymic output decreased with progression of CKD both in percentage and absolute counts of recent thymic emigrants [RTEs; 20 ± 10 versus 15 ± 9 versus 9 ± 13% (P = 0.025) and 197 ± 25 versus 88 ± 13 versus 73 ± 21 RTE/mm3 (P < 0.001), respectively, for Groups 1–3]. Thymic output also decreased with age, yet earlier in uraemic compared with non-uraemic patients (r = −0.35, P = 0.003 and r = −0.23, P = 0.187, respectively). Indeed, thymic output was comparable between 40-year-old uraemic patients and 80-year-old non-uraemic patients (Figure 1). We performed analysis on the whole cohort split by median of age and found similar results, presented in Supplementary data, Figure S1.
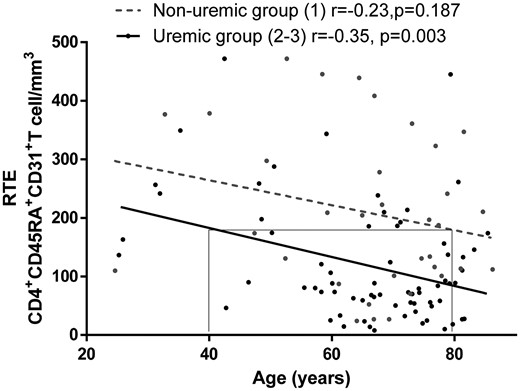
Thymic output assessed by circulating RTEs is reduced in young uremic patients. Circulating RTEs were assessed by flow cytometry as CD31+CD45RA+CD4+ T cells in the different groups of patients. Forty-year-old patients of Groups 2 and 3 exhibited the same thymic output as non-uraemic patients (Group 1) >80 years of age. Non-uraemic patients (Group 1) were compared with uraemic patients, including CKD Stage IV and dialysed patients (i.e. Groups 2 and 3).
CMV infection impacts the frequency of terminally differentiated CD8+ T cells
CMV is a well-known trigger of CD8+ T-cell activation and exhaustion [26]. We did not observe any viral replication in our patient-matched cohort. There was a significant increase in terminally differentiated CD8+ T cells among CMV-seropositive patients according to CKD status [27 ± 20 versus 37 ± 15 versus 43 ± 16% (P = 0.011), respectively, for Groups 1–3]. Conversely, terminally differentiated CD8+ T cells were not different between groups in CMV-naïve patients [16 ± 10 versus 21 ± 16 versus 20 ± 15% (P = 0.619), respectively, for Groups 1–3) (Figure 2). The same phenomenon was observed with terminally differentiated CD4+ T cells (data not shown). CMV status did not alter thymic output [18 ± 9 versus 17 ± 12% (P = 0.681%), respectively, from CMV-exposed status and CMV-naïve status].
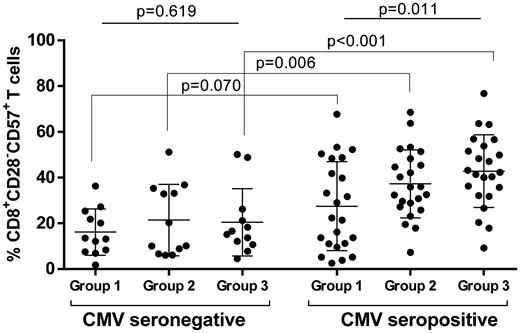
Influence of CMV status on terminally differentiated CD8+ T-cell frequency for Groups 1–3. Circulating CD28−CD57+CD8+ T cells were analysed by flow cytometry in the different groups of patients from matched cohorts for age and gender: non-uraemic patients (Group 1), CKD Stage IV patients (Group 2) and dialysed patients (Group 3).
Premature replicative senescence is observed in young uraemic patients
Analysis of relative telomere length (RTL) needed more power and was performed on the whole cohort. Attrition of RTL was age dependent in non-uraemic patients (Group 1; r = −0.4, P < 0.001) and in uraemic patients (Groups 2 and 3; r = −0.18, P = 0.036). Yet replicative senescence was more pronounced in uraemic patients. Indeed, RTL was comparable between 40-year-old uraemic patients and 75-year-old non-uraemic patients (Figure 3). Patients of the whole cohort were split according to their median age (65 years). Analysis of RTL was performed in the youngest patients [age <65 years (young)] and in the oldest patients [age >65 years (old)]. Younger patients from Groups 2 and 3 had shorter RTLs than those from Group 1 [1.11 ± 0.36 versus 0.78 ± 0.24 versus 0.97 ± 0.21 T/S ratio (P < 0.001), respectively, for Groups 1–3]. Older patients from Groups 2 and 3 had shorter RTLs than those from Group 1 (0.98 ± 0.27 versus 0.82 ± 0.23 versus 0.88 ± 0.22 T:S ratio, P = 0.045). Young patients from Group 3 have the same RTLs as older patients from Group 1 (0.97 ± 0.21 versus 0.98 ± 0.27 T:S ratio, P = 0.810) (Figure 4). Relative telomerase activity (RTA) was not associated with age and no correlation was found with RTL. We did not observe any difference in RTA in patients according to the group [13 ± 26 versus 15 ± 22 versus 8 ± 12% (P = 0.250), respectively, for Groups 1–3]. Uraemia-induced immune senescence might depend on telomere replicative senescence, because telomere-independent immune senescence assessed by quantification of DNA damage (%γH2A.X) was similar between the three groups [0.23 ± 0.16 versus 0.19 ± 0.11 versus 0.20 ± 0.11% (P = 0.534), respectively, for Groups 1–3] whatever the lymphocyte subset (data not shown).
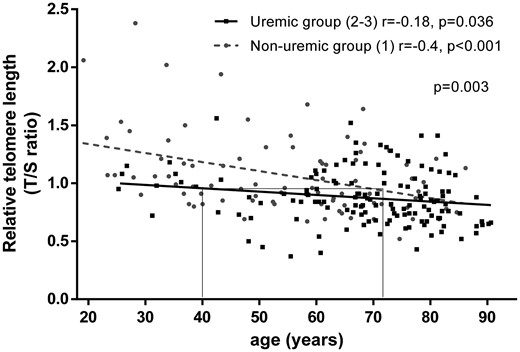
PBMC RTL is reduced with age for non-uraemic patients while this effect is reduced for uraemic patients. RTL was assessed as reported in the ‘Materials and Methods’ section in non-uraemic patients (Group 1) and in uraemic patients including CKD Stage IV and dialysed patients (i.e. Groups 2 and 3).
![PBMC RTL attrition was observed in young and old patients according to the level of uraemia. RTL is assessed as described in the ‘Materials and Methods’ section. Patients in the entire cohort were divided according to their median age (65 years). Analysis of senescence biomarkers was performed in the youngest patients [age <65 years (young)] and the oldest patients [age >65 years (old)].](https://oup.silverchair-cdn.com/oup/backfile/Content_public/Journal/ndt/35/4/10.1093_ndt_gfy276/1/m_gfy276f4.jpeg?Expires=1750265961&Signature=OY6CIU4QyMbsY-qsH6vTDyRJKnYD0qoPldLNCVDiMiYS1tk~cgZWtraTMuc~3kajApBiAiCX2VWK1G8wCvtt0RQb~-cOmigEML4OFD4NcpAr-NKAlfkeF1oKtk5kpataNjQrZYtrUcHnYG8hqLJ79UakwPIr3zt3au2fhRQF0dvvuQ46Y793EcP~cSlt63GnypUmhXz824RNvZWNI8sENZAxHv9wNJrN1Hda0-Fh7~ruwoBYagL2CFsAykQFWlLTvBJv0LX6GjXYemD~-fmw6zXqqrPl0sQLCKWkv~0Osa2nOeCltqTUmD-F6io6u2auGpD5wqUAg50NeswOm5CqRg__&Key-Pair-Id=APKAIE5G5CRDK6RD3PGA)
PBMC RTL attrition was observed in young and old patients according to the level of uraemia. RTL is assessed as described in the ‘Materials and Methods’ section. Patients in the entire cohort were divided according to their median age (65 years). Analysis of senescence biomarkers was performed in the youngest patients [age <65 years (young)] and the oldest patients [age >65 years (old)].
Clinical outcomes
Patients from Group 1 were event-free. During the 574 ± 265 days of follow-up, we recorded 24 (17.5%) deaths in Groups 2 and 3. As expected, there were more deaths in Group 3 as compared with Group 2 [n = 21 (25%) versus n = 3 (5.6%); P = 0.005, respectively]. A total of 50% (n = 12) of deaths were from CEs with sudden death [n = 6 (50%)], stroke [n = 4 (33%)] and mesenteric ischaemia [n = 2 (17%)]. The other causes of death were infectious diseases [n = 8 (33.3%)], cancers [n = 3 (12.5%)] and collegial decision to stop dialysis for ethical reasons [n = 1 (8.3%)]. A total of 25 patients (18%) experienced at least one CE. During follow-up, 41 patients (30%) developed at least one infectious event, 25 patients (61%) during the first year of follow-up. The localization of infection was the following: pulmonary infections [n = 11 (27%)], skin or joint infections [n = 9 (22%)], dialysis access-related infections [n = 9 (22%)] (shunt or catheter-related infections or medical peritonitis), urinary or abdominal infections [n = 7 (17%)] and other sites or undocumented site [n = 5 (12%)]. Finally, 14 patients (17%) received renal transplantation in Group 3. Multivariate analysis was only performed in dialysed patients (Group 3) because they experienced more clinical events than Group 2 (Supplementary data, Table S5).
In multivariate analysis, shorter RTLs were associated with a risk of death [HR 4.12 (95% CI 1.44–11.75); P = 0.008]; the other independent risk factors, such as history of CEs, BMI and CRP levels, were less statistically significantly associated with death (Table 2). Moreover, RTL analysed with the Hosmer–Lemeshow test revealed good calibration for predicting the risk of death (P = 0.801; Supplementary data, Table S6). Receiver operating characteristic (ROC) curve analysis of RTL is shown in Supplementary data, Figure S2.
Global survival performed with Cox regression model in univariate analysis then we selected variables with P-values <0.2 for multivariate model analysis step by step on dialysed patients
| Univariate analysis | Multivariate analysis | |||||
|---|---|---|---|---|---|---|
| Factors | HR | 95% CI | P-value | HR | 95% CI | P-value |
| Age | 1.06 | 1.01–1.12 | 0.023 | |||
| Gender (male) | 2.07 | 0.69–6.22 | 0.193 | |||
| BMI | 0.93 | 0.86–1.01 | 0.071 | 0.89 | 0.80–0.99 | 0.031 |
| History of CE | 9.97 | 1.33–74.71 | 0.003 | 8.22 | 1.06–63.59 | 0.044 |
| Chronic heart failure | 2.74 | 0.99–7.56 | 0.052 | |||
| PD versus HD | 2.09 | 0.88–4.94 | 0.094 | 2.67 | 1.07–8.18 | 0.036 |
| Dialysis duration | 1.01 | 1.00–1.22 | 0.152 | |||
| Lymphocyte count (g/L) | 0.36 | 0.14–0.96 | 0.041 | |||
| Haemoglobin (g/dL) | 1.24 | 0.92–1.68 | 0.158 | |||
| Albuminaemia (g/L) | 0.88 | 0.77–1.01 | 0.063 | |||
| Ferritin (ng/mL) | 1.00 | 1.00–1.00 | 0.031 | |||
| CRP (mg/L) | 1.06 | 1.00–1.12 | 0.042 | 1.07 | 1.01–1.13 | 0.024 |
| Calcium × phosphorus product | 0.63 | 0.33–1.18 | 0.149 | |||
| Shorter RTL (first versus second and third tertiles) | 2.05 | 0.86–4.87 | 0.103 | 4.73 | 1.59–14.10 | 0.005 |
HR: hazard ratio, BMI: body mass index, CE: cardiovascular event, CRP: C reactive protein, RTL: relative telomere length.
In multivariate analysis, risk factors associated with infectious episodes were diabetes mellitus [HR 2.58 (95% CI 1.28–5.19); P = 0.008], PD [HR 3.18 (95% CI 1.52–6.64); P = 0.002], CRP [HR 1.06 (95% CI 1.01–1.11); P = 0.009] and lower thymic output defined as the first and second tertile of the CD4+ RTE count [HR 1.79 (95% CI 1.34–9.58); P = 0.011] (Table 3). Similar results were observed using competitive risk Fine and Gray model analysis (Supplementary data, Table S11). ROC curve analysis of the CD4+ RTE count as a predictor of an infectious event showed an area under the curve of 0.66 ± 0.06 (95% CI 0.54–0.78, P = 0.014; Supplementary data, Figure S3). RTE count >100/mm3 had the best threshold value, with 85% sensibility and 41% specificity.
Infection-free survival performed with Cox model regression in univariate analysis then we selected variables with P-values <0.2 for multivariate model analysis step by step on dialysed patients
| Univariate analysis | Multivariate analysis | |||||
|---|---|---|---|---|---|---|
| Factors | HR | 95% CI | P-value | HR | 95% CI | P-value |
| Age | 1.05 | 1.01–1.09 | 0.011 | |||
| BMI | 1.05 | 0.99–1.12 | 0.107 | |||
| Diabetes mellitus | 2.08 | 1.05–4.11 | 0.036 | 2.58 | 1.28–5.19 | 0.008 |
| History of CE | 1.89 | 0.85–4.20 | 0.118 | |||
| Chronic heart failure | 1.83 | 0.92–3.66 | 0.087 | |||
| PD versus HD | 2.78 | 2.40–5.53 | 0.004 | 3.18 | 1.52–6.64 | 0.002 |
| Dialysis duration (month) | 1.00 | 0.99–1.01 | 0.766 | |||
| CRP (mg/L) | 1.05 | 1.01–1.09 | 0.029 | 1.06 | 1.01–1.11 | 0.009 |
| Ferritin (ng/L) | 0.99 | 0.99–1.00 | 0.127 | |||
| Low thymic output (first and second versus third tertile) | 2.42 | 1.00–5.85 | 0.050 | 1.79 | 1.34–9.58 | 0.011 |
Thymic output quantified by RTE CD4+CD45RA+CD31+ T cells are expressed in tertiles. Low thymic ouput was first and second tertiles. Duration of dialysis was forced in this model because of its clinical relevance.
HR: hazard ratio, BMI: body mass index, CE: cardiovascular event, CRP: C reactive protein.
In multivariate analysis, risk factors associated with CEs were history of CEs [HR 8.94 (95% CI 1.96–40.79); P = 0.005], PD [HR 4.27 (95% CI 1.53–11.86); P = 0.005], dialysis duration [HR 0.96 (95% CI 0.94–0.99); P = 0.003] and higher proportion, defined as the third tertile, of terminally differentiated CD8+ T cells [HR 4.86 (95% CI 1.72–13.72); P = 0.003] (Table 4). The use of a competitive risk model resulted in similar results (Supplementary data, Table S12). In bivariate Cox model analysis, the impact of a history of CEs on the association between terminally differentiated CD8+ T cells and risk factors of occurrence of CEs remained unchanged and independent [HR 4.72 (95% CI 1.07–20.71), P = 0.040 for a history of CE and HR 3.02 (95% CI 1.16–7.87), P = 0.024 for terminally differentiated CD8+ T cells]. ROC curve analysis of terminally differentiated CD8+ T cells as a predictor of CEs showed an area under the curve of 0.71 ± 0.06 (95% CI 0.54–0.83; P = 0.005). A proportion of terminally differentiated CD8+ T cells >30% was the best threshold value, with 89.5% sensibility and 59.5% specificity (Supplementary data, Figure S4). At baseline, the proportion of patients with a history of CEs who had a higher proportion of terminally differentiated CD8+ T cells was more frequent than patients without a history of CE (70 versus 50%; P = 0.079). We did not find any association between CEs and terminally CD4+ T-cell expansion [HR 1.54 (95% CI 0.51–4.70), P = 0.445].
CE-free survival performed with Cox model regression in univariate analysis then we selected variables with P-values <0.2 for multivariate model analysis step by step on dialysed patient
| Univariate analysis | Multivariate analysis | |||||
|---|---|---|---|---|---|---|
| Factors | HR | 95% CI | P-value | HR | 95% CI | P-value |
| Age | 1.02 | 0.98–1.06 | 0.266 | |||
| Gender (male) | 1.70 | 0.55–5.20 | 0.354 | |||
| Diabetes mellitus | 1.87 | 0.72–4.86 | 0.199 | |||
| History of CE | 5.63 | 1.29–24.55 | 0.021 | 8.94 | 1.96–40.79 | 0.005 |
| Chronic heart failure | 3.12 | 1.11–8.79 | 0.031 | |||
| PD versus HD | 2.99 | 1.14–7.86 | 0.026 | 4.27 | 1.53–11.86 | 0.005 |
| Dialysis duration | 0.98 | 0.95–1.00 | 0.051 | 0.96 | 0.94–0.99 | 0.003 |
| 25-hydroxyvitamin D3 (ng/mL) | 0.95 | 0.91–0.99 | 0.017 | |||
| Terminally differentiated CD8+ T cells (third versus first and second tertiles) | 3.57 | 1.38–9.22 | 0.009 | 4.86 | 1.72–13.72 | 0.003 |
Age and gender were included in Cox model despite a P-value >0.2 because these are factors with clinical relevance for this outcome. Terminally differentiated (CD57+CD28–) CD8+ T cells are expressed in tertiles.
HR: hazard ratio, CE: cardiovascular event.
DISCUSSION
Our results showed that CKD is associated with premature senescence of the T-cell compartment, similar to immune alterations reported in the elderly. These alterations are specifically associated with different clinical outcomes, suggesting that the pathophysiology of age-related diseases is complex and differentially involves specific senescence pathways. This could have important consequences for clinical research on reversing immune senescence.
Immune senescence exists before ESRD and renal replacement therapy. Uraemia impacts thymic output early, with a major decrease in naïve T-cell populations, RTE and expansion of terminally differentiated CD8+ T cells. Our results are consistent with those reported by Litjens et al. [27], who described, in a small cohort of patients, similar T-cell compartment alterations during CKD progression. Moreover, they did not analyse these alterations in the light of CMV status. Meijers et al. [28] showed later that terminally differentiated CD8+ and CD4+ T-cell expansion in dialysed or non-dialysed ESRD patients (eGFR <15 mL/min/1.73 m2) is highly associated with CMV exposure, without any impact of CMV status on thymic output. We report here similar results in Stage IV CKD patients (eGFR >15 mL/min/1.73 m2), suggesting that immune senescence appears before ESRD.
We observed a premature replicative senescence in young CKD patients associated with poor naïve T-cell frequency and reduced thymic output. Increased replicative senescence was not observed in elderly ESRD patients. This is also consistent with a previous study [29]. Uraemia-induced immune senescence has a strong negative impact on the immune system, especially thymic function. It is likely that the impact of uraemia on thymic function could be more pronounced in young patients with persistent thymic function than in elderly patients with pre-existing thymic involution.
In our study, telomere length shortening is associated with a higher risk of death, regardless of age. This is in accordance with Carrero et al. [30], who reported data from 175 patients on HD. However, in contrast to this report, we do not find any correlation between inflammation biomarkers and RTL. Another recent study based on 43 HD patients did not find any increase in mortality in patients with shorter telomere length [31]. Comparisons between studies remain difficult because of the different methods used to assess RTL. While Stefanidis et al. [31] used the terminal restriction fragments method (which measures both telomeric and subtelomeric regions), we and Carrero et al. [30] performed quantitative PCR (which measures the telomeric cap [32]).
CKD progression was associated with higher CRP levels and a decrease in albuminaemia. Both markers are frequently gathered under the term of ‘inflamm-aging’ [33], often associated with premature immune senescence. In our study we found an association between thymic function evaluated with RTE count and elevated chronic inflammation level (i.e. high levels of CRP and ferritin, associated with low albuminaemia). Nevertheless, it remains unclear whether inflamm-aging is the cause or the consequence of premature senescence [34] and requires further complementary mechanistic studies.
We found a strong association between reduced thymic output and the occurrence of severe infectious episodes. Furthermore, an absolute count of RTE >100/mm3 defined ‘good thymic function’ for CKD patients. To the best of our knowledge, our study is the first to clearly demonstrate an association between thymic activity and infections in CKD patients. Thymic function assessment in CKD patients would help to identify patients with a higher risk of infections and more prone to be eligible for active prevention, such as vaccination, or particular awareness in case of fever. One can extrapolate that these patients could benefit from future therapeutic approaches able to restore thymic function and reverse immune senescence [35–37]. Among of these, a substitutive therapy using recombinant interleukin-7 could be interesting to test in lymphopenic dialysed patient [38, 39].
In patients with CKD, an increased cardiovascular risk is associated with terminally differentiated CD8+ T-cell expansion. Although this association has been suspected, it has never been demonstrated. Our data support this hypothesis in patients with CKD. Our team has previously shown that immune T-cell activation and, more particularly, terminally differentiated CD8+ T-cell expansion is associated with accelerated atherosclerosis in renal transplant recipients, especially after induction treatment with T-cell-depleting agents [40]. Chronic allo-immune challenge, such as the number of human leucocyte antigen mismatches, peripheral homeostatic immune reconstitution following T-cell depletion and CMV reactivation, have been shown to be associated with terminally differentiated CD8+ T-cell expansion and were identified as major factors associated with increased risk of atherosclerotic events after renal transplantation [41]. Similar observations were recently shown in the elderly, as illustrated by the Newcastle 85+ study [42] (including patients >85 years of age), and in HIV patients who are another model of premature senescence [43, 44]. Mechanisms of terminally differentiated CD8+ T-cell expansion remain partly unknown. Nevertheless, the role of repeated/chronic antigenic stimulation, such as CMV reactivation or dysbiosis, with chronic translocation of gut bacteria products has been recently highlighted [43, 45].
Our study has some limitations. Association does not imply causality and we cannot exclude the impact of unmeasured parameters. The follow-up period was too short to correlate immune senescence biomarkers with the rate of progression to end-stage CKD for each patient. Long-term studies of senescence biomarkers might be necessary for a better understanding of the relationship between CKD and premature immune senescence. The number of patients was limited. Nevertheless, the effect is important and should be judged on its clinical importance. Indeed, the risk of incorrectly stating that shortening of telomeres is a risk factor for death was as low as 1%.
In conclusion, CKD, even before ESRD and dialysis, is associated with features of immune senescence. Uraemia-induced immune senescence parameters are associated with poor clinical outcomes.
ACKNOWLEDGEMENTS
This work was executed in INSERM unit 1098 with the collaboration of the BioMonitoring Platform. We would like to thank the technicians of the Biomonitoring Platform for sample collection and analysis.
FUNDING
This work was supported by grants from APICHU 2011, the Agence Nationale de la Recherche (Labex LipSTIC, ANR-11-LABX-0021), the Région de Bourgogne Franche-Comté (supported to LipSTIC 2016 and 2017) and Santélys Bourgogne-Franche-Comté 2016.
CONFLICT OF INTEREST STATEMENT
C.V. reports grants from Region France-Comte and Santèlys during the conduct of the study.


Comments