


Abstract
It currently remains understudied whether low consumption of fruits and vegetables after kidney transplantation may be a modifiable cardiovascular risk factor. We aimed to investigate the associations between consumption of fruits and vegetables and cardiovascular mortality in renal transplant recipients (RTRs).
Consumption of fruits and vegetables was assessed in an extensively phenotyping cohort of RTRs. Multivariable-adjusted Cox proportional hazards regression analyses were performed to assess the risk of cardiovascular mortality.
We included 400 RTRs (age 52 ± 12 years, 54% males). At a median follow-up of 7.2 years, 23% of RTRs died (53% were due to cardiovascular causes). Overall, fruit consumption was not associated with cardiovascular mortality {hazard ratio [HR] 0.82 [95% confidence interval (CI) 0.60–1.14]; P = 0.24}, whereas vegetable consumption was inversely associated with cardiovascular mortality [HR 0.49 (95% CI 0.34–0.71); P < 0.001]. This association remained independent of adjustment for several potential confounders. The association of fruit consumption with cardiovascular mortality was significantly modified by estimated glomerular filtration rate (eGFR; Pinteraction = 0.01) and proteinuria (Pinteraction = 0.01), with significant inverse associations in patients with eGFR > 45 mL/min/1.73 m2 [HR 0.56 (95% CI 0.35–0.92); P = 0.02] or the absence of proteinuria [HR 0.62 (95% CI 0.41–0.92); P = 0.02].
In RTRs, a relatively higher vegetable consumption is independently and strongly associated with lower cardiovascular mortality. A relatively higher fruit consumption is also associated with lower cardiovascular mortality, although particularly in RTRs with eGFR > 45 mL/min/1.73 m2 or an absence of proteinuria. Further studies seem warranted to investigate whether increasing consumption of fruits and vegetables may open opportunities for potential interventional pathways to decrease the burden of cardiovascular mortality in RTRs.
ADDITIONAL CONTENT
An author video to accompany this article is available at: https://dbpia.nl.go.kr/ndt/pages/author_videos.
INTRODUCTION
Kidney transplantation is the preferred treatment for most patients with end-stage renal disease [1–3]. Despite the success of this treatment, the risk of mortality in renal transplant recipients (RTRs) remains considerably higher than that of age- and sex-matched controls in the general population [4], with cardiovascular disease as the leading cause of mortality [5, 6].
Consumption of fruits and vegetables is an essential component of a healthy diet that may help to improve cardiovascular health and reduce deaths from cardiovascular disease [7, 8]. Many studies have investigated and consistently confirmed the substantial role of adequate consumption of fruits and vegetables on cardiovascular prognosis in the general population [9–22]. It may therefore be hypothesized that consumption of fruits and vegetables is inversely associated with the cardiovascular prognosis of RTRs. To the best of our knowledge, however, to date no study has investigated the association of consumption of fruits and vegetables with cardiovascular mortality in RTRs.
In the present study we aimed to prospectively investigate whether consumption of fruits and vegetables is associated with the risk of cardiovascular mortality in the specific clinical setting of RTRs. For this purpose we examined the daily consumption of fruits and vegetables in an extensive phenotyped cohort of outpatient RTRs and assessed its associations with risk of cardiovascular mortality. In secondary analyses we investigated whether consumption of fruits and vegetables is associated with the risk of all-cause mortality in RTRs.
MATERIALS AND METHODS
Study design and patients
All adult (≥18 years old) RTRs who were ≥1 year after transplantation were approached for participation during outpatient clinic visits at the University Medical Center Groningen between August 2001 and July 2003. As described before [23], the outpatient follow-up constitutes a continuous surveillance system in which patients visit the outpatient clinic with declining frequency, in accordance with the American Transplantation Society Guidelines [24]. Patients with overt congestive heart failure and patients diagnosed with cancer other than cured skin cancer were not considered eligible for the study. In patients with fever or other signs of infection (e.g. complaints of upper respiratory tract infection or urinary tract infection), baseline visits were postponed until symptoms had resolved. From a total of 847 eligible RTRs, 606 gave signed written informed consent (72% consent rate). After 206 participants had been included in the study, a semi-quantitative food-frequency questionnaire on consumption of fruits and vegetables was added to the questionnaires to be filled out by the RTRs, providing data for 400 consecutive RTRs, of which data are presented here. Fruit consumption was assessed by asking participants: ‘How many servings of fruit do you eat per day on average?’ Vegetable consumption was assessed by asking participants: ‘How many tablespoons of vegetable do you eat per day on average?’ Respondents were asked to choose among five possible frequency categories: 0, 1, 2, 3, ≥4 per day. All study protocols were approved by the Medical Ethical Committee (METc 2001/039) and adhered to the principles of the Declarations of Helsinki and Istanbul.
The primary endpoint of this study was cardiovascular mortality. The secondary endpoint was all-cause mortality. The continuous surveillance system of the outpatient programme ensures up-to-date information on patient status and cause of death. Cause of death was obtained by linking the number of the death certificate to the primary cause of death as coded by a physician from the Central Bureau of Statistics. Causes of death were coded according to the International Classification of Diseases, 9th revision (ICD-9) [23, 25]. Cardiovascular mortality was defined as deaths in which the principal cause of death was cardiovascular in nature, using ICD-9 codes 410–447. Endpoints were recorded until May 2009. There was no loss during follow-up.
Data collection
The measurement of clinical parameters has been described in detail previously [23]. In brief, information on medical history and medication use were extracted from the Groningen Renal Transplant Database. Details of the standard immunosuppressive treatment were described previously [26]. Diabetes mellitus was defined according to the guidelines of the American Diabetes Association [27]. Physical activity was estimated using metabolic equivalents of task (MET) [28, 29]. Lifestyle, smoking status, alcohol use and cardiovascular history were obtained using a self-report questionnaire at inclusion. Cardiovascular disease history was considered positive if participants had a previous myocardial infarction, transient ischaemic attack or cerebrovascular accident. Income was recorded as a categorical variable (<1800, 1800–2799, 2800–3799, >3800 euros/month). Education levels were categorized according to the International Standard Classification of Education [30]. Education levels were bachelor, master or doctorate graduate (Level 1), postsecondary or non-tertiary or short-cycle tertiary education (Level 2), upper secondary education (Level 3), lower secondary education (Level 4) and primary or below primary education (Level 5), as described previously [31].
Laboratory procedures
Blood samples were drawn after an 8–12 h overnight fasting period. Total cholesterol, low-density lipoprotein (LDL) cholesterol, high-density lipoprotein (HDL) cholesterol, plasma triglycerides, plasma glucose concentration, plasma insulin, glycated haemoglobin and insulin resistance were determined as described before [23]. Plasma high-sensitivity C-reactive protein (hs-CRP) was assessed by enzyme-linked immunosorbent assay as described previously [32]. Plasma and urine creatinine concentrations were determined using a modified version of the Jaffé method (MEGA AU510; Merck Diagnostica, Darmstadt, Germany). Renal function was assessed by estimated glomerular filtration rate (eGFR) applying the Chronic Kidney Disease Epidemiology Collaboration equation [33]. Proteinuria was defined as urinary protein excretion ≥0.5 g/24 h.
Statistical analysis
Data were analysed using SPSS software, version 23.0 (IBM, Armonk, NY, USA), R version 3.2.3 (R Foundation for Statistical Computing, Vienna, Austria), Stata 14.1 (StataCorp, College Station, TX, USA), and GraphPad Prism 7.02 software (GraphPad Software Inc., San Diego, CA, USA). Data are expressed as mean ± SD for normally distributed variables and as median [25th–75th interquartile range (IQR)] for variables with a skewed distribution. Categorical data are expressed as number (percentage). Natural log transformation was used for variables with a skewed distribution to reach normality criteria. Multiple imputations (n = 5) were used to account for missingness of data among variables other than data on consumption of fruits and vegetables [34]. The percentage of missing data was 0.2, 0.2, 0.3, 0.7, 1.5, 1.7 and 1.7% for waist circumference, glycated haemoglobin, proteinuria, personal cardiovascular history, familiar cardiovascular history, alcohol use and cumulative dose of prednisolone, respectively. The percentage of missing data was maximally 10, 21 and 29% for physical activity, income and education level, respectively. Differences in baseline characteristics among subgroups of RTRs by categories of consumption of fruits and vegetables were tested by analysis of variance or Kruskal–Wallis test for continuous variables and by chi-squared test for categorical variables.
Log-rank tests were performed to determine if there were differences among the survival distribution of RTRs with different categories of consumption of fruits and vegetables. To study the associations of consumption of fruits and vegetables with cardiovascular and all-cause mortality, we fitted Cox proportional hazards regression models to the data and Schoenfeld residuals were calculated to assess whether proportionality assumptions were satisfied. For these analyses, consumption of fruits and vegetables were used as continuous and categorical (0–1, 2, ≥3 servings or tablespoons per day, respectively) variables to obtain the best-fitting model. We performed analyses in which we first adjusted for age, sex, income and education level (Model 1) and additionally for eGFR, proteinuria, time since transplantation and primary renal disease (Model 2). To avoid inclusion of too many variables for the number of events, additional models were based on additive adjustments to Model 2. In further models we adjusted for physical activity, total cholesterol, systolic blood pressure, body mass index (BMI), diabetes mellitus and smoking status (Model 3); and, both personal and familiar cardiovascular history, alcohol use, and hs-CRP (Model 4). For the categorical analyses we additionally calculated the absolute risk reduction (ARR) provided by consumption of fruits and vegetables [35–38]. ARR was calculated by subtracting the event rate (events/total subjects × 100) in the reference group (i.e. consumption of 0–1 servings/tablespoons per day) from the event rate in the group under study (i.e. consumption of either 2 or ≥3 servings/tablespoons per day) [39].
Next, we performed pre-specified analyses in which we tested for potential effect modification by age, sex, BMI, smoking status, alcohol use, physical activity, eGFR and proteinuria, using multiplicative interaction terms. For these analyses, Pinteraction < 0.05 was considered to indicate significant effect modification. In case of significant effect-modification, we proceeded with stratified analyses for the concerned variable. These analyses were analoguous to Model 2 of the overall prospective analyses.
RESULTS
A total of 400 RTRs (mean age 52 ± 12 years; 54% men; 97% Caucasian) were studied. Baseline characteristics are shown in Tables 1 and 2. The distributions of consumption of fruits and vegetables are shown in Supplementary data, Figure S1. The mean consumption of fruits and vegetables was 1.5 ± 1 servings/day and 2.5 ± 0.8 tablespoons/day, respectively. Comparison analysis of baseline characteristics between RTRs with and without data on intake is shown in Supplementary data, Table S1. Primary renal disease, transplant characteristics and immunosuppressive therapy by categories of consumption of fruits and vegetables are shown in Supplementary data, Tables S2 and S3, respectively.
Baseline characteristics of 400 RTRs by categories of fruit consumption
| Variables | All patients (N = 400) | Categories of fruit consumption, servings/day | P-value | ||
|---|---|---|---|---|---|
| 0–1 (n = 207) | 2 (n = 129) | ≥3 (n = 64) | |||
| Demographics | |||||
| Age (years) | 52 ± 12 | 49 ± 12 | 55 ± 11 | 54 ± 12 | <0.001 |
| Male, n (%) | 217 (54) | 128 (62) | 60 (47) | 29 (45) | 0.01 |
| Caucasian ethnicity, n (%) | 389 (97) | 202 (98) | 126 (98) | 61 (95) | 0.59 |
| Body composition, mean ± SD | |||||
| Body surface area (m2) | 1.87 ± 0.19 | 1.87 ± 0.19 | 1.87 ± 0.17 | 1.85 ± 0.19 | 0.59 |
| BMI (kg/m2) | 25.8 ± 4.1 | 25.2 ± 3.9 | 26.8 ± 4.4 | 26.0 ± 4.2 | 0.003 |
| Waist circumference (cm) | 96.7 ± 13.3 | 95.1 ± 13.0 | 100.1 ± 13.3 | 95.2 ± 12.6 | 0.002 |
| Blood pressure | |||||
| Systolic blood pressure (mmHg) | 155 ± 23 | 152 ± 21 | 156 ± 23 | 160 ± 26 | 0.04 |
| Diastolic blood pressure (mmHg) | 91 ± 10 | 90 ± 9 | 90 ± 10 | 92 ± 9 | 0.34 |
| Use of anti-hypertensives, n (%) | 355 (89) | 181 (87) | 119 (92) | 55 (86) | 0.30 |
| Number of anti-hypertensives | 1.9 ± 1.1 | 1.8 ± 1.2 | 2.0 ± 1.1 | 2.0 ± 1.2 | 0.28 |
| Use of ACE inhibitor or ARB, n (%) | 131 (33) | 62 (30) | 45 (35) | 24 (38) | 0.44 |
| Use of beta-blocker, n (%) | 240 (60) | 123 (59) | 78 (61) | 39 (61) | 0.97 |
| Use of calcium antagonist, n (%) | 162 (41) | 88 (43) | 51 (40) | 23 (36) | 0.62 |
| Lifestyle | |||||
| Current smoker, n (%) | 88 (22) | 57 (28) | 21 (16) | 10 (16) | 0.02 |
| Alcohol (non-user), n (%) | 192 (48) | 86 (42) | 75 (58) | 31 (48) | 0.01 |
| Physical activity (MET-min/day), median (IQR) | 279 (69–605) | 282 (69–664) | 215 (56–489) | 358 (133–739) | 0.17 |
| Socio-economic status | |||||
| Income, n (%) | 0.16 | ||||
| <1800 euros/month | 52 (13) | 27 (13) | 19 (15) | 6 (7) | |
| 1800–2799 euros/month | 108 (27) | 45 (22) | 44 (34) | 19 (30) | |
| 2800–3799 euros/month | 101 (25) | 52 (25) | 33 (26) | 16 (25) | |
| >3800 euros/month | 139 (35) | 83 (40) | 33 (26) | 23 (36) | |
| Educational level, n (%) | 0.03 | ||||
| Level 1 | 17 (4) | 11 (5) | 2 (2) | 4 (6) | |
| Level 2 | 45 (11) | 24 (12) | 15 (12) | 6 (9) | |
| Level 3 | 164 (41) | 91 (44) | 45 (35) | 28 (44) | |
| Level 4 | 147 (37) | 67 (32) | 59 (46) | 21 (33) | |
| Level 5 | 27 (7) | 14 (7) | 8 (6) | 5 (8) | |
| History of cardiovascular disease, n (%) | |||||
| Personal cardiovascular history | 50 (13) | 27 (13) | 18 (14) | 5 (8) | 0.47 |
| Familiar cardiovascular history | 178 (45) | 94 (45) | 56 (43) | 28 (44) | 0.93 |
| Renal allograft function | |||||
| eGFR (mL/min/1.73 m2) | 47 ± 17 | 49 ± 18 | 44 ± 15 | 47 ± 17 | 0.02 |
| Proteinuria (≥0.5 g/24 h), n (%) | 112 (28) | 55 (27) | 34 (27) | 23 (36) | 0.31 |
| Lipids | |||||
| Total cholesterol (mmol/L) | 5.6 ± 1.0 | 5.6 ± 1.0 | 5.7 ± 1.0 | 5.5 ± 1.0 | 0.48 |
| HDL cholesterol (mmol/L) | 1.09 ± 0.33 | 1.07 ± 0.33 | 1.11 ± 0.34 | 1.11 ± 0.29 | 0.48 |
| LDL cholesterol (mmol/L) | 3.6 ± 0.9 | 3.6 ± 1.0 | 3.5 ± 0.9 | 3.6 ± 0.9 | 0.89 |
| Triglycerides (mmol/L), median (IQR) | 1.9 (1.4–2.6) | 1.9 (1.4–2.6) | 1.9 (1.4–2.8) | 1.7 (1.2–2.1) | 0.02 |
| Use of statins, n (%) | 194 (49) | 94 (45) | 69 (54) | 31 (48) | 0.35 |
| Glucose homeostasis | |||||
| Insulin (µU/mL), median (IQR) | 11.2 (8.0–15.5) | 10.9 (7.8–15.2) | 11.9 (8.9–16.8) | 9.7 (7.4–14.4) | 0.07 |
| Glucose (mmol/L), median (IQR) | 4.5 (4.1–5.0) | 4.6 (4.1–5.0) | 4.5 (4.2–5.1) | 4.3 (4.0–4.8) | 0.11 |
| Glycated HbA1c (%), median (IQR) | 6.4 (5.8–7.0) | 6.4 (5.9–7.1) | 6.4 (5.9–7.1) | 6.3 (5.7–6.7) | 0.42 |
| Diabetes, n (%) | 73 (18) | 32 (16) | 33 (26) | 8 (13) | 0.03 |
| HOMA-IR, median (IQR) | 2.3 (1.6–3.5) | 2.3 (1.6–3.7) | 2.5 (1.7–3.5) | 1.8 (1.3–3.2) | 0.06 |
| Inflammation | |||||
| hs-CRP (mg/L), median (IQR) | 2.1 (0.9–5.1) | 2.3 (0.9–5.6) | 2.1 (0.9–4.8) | 1.8 (0.9–5.3) | 0.96 |
Values presented as mean ± SD unless stated otherwise. ACE, angiotensin-converting enzyme; ARB, angiotensin II receptor blocker; HbA1c, haemoglobin A1c; HOMA-IR, homeostatic model assessment insulin resistance. Differences were tested by analysis of variance or Kruskal–Wallis test for continuous variables and by chi-squared test for categorical variables.
Baseline characteristics of 400 RTRs by categories of vegetable consumption
| Variables | All patients (N = 400) | Categories of vegetable consumption, tablespoons/day | P-value | ||
|---|---|---|---|---|---|
| 0–1 (n = 35) | 2 (n = 175) | ≥3 (n = 190) | |||
| Demographics | |||||
| Age (years) | 52 ± 12 | 50 ± 13 | 52 ± 13 | 52 ± 11 | 0.67 |
| Men, n (%) | 217 (54) | 13 (37) | 95 (54) | 119 (57) | 0.09 |
| Caucasian ethnicity, n (%) | 389 (97) | 33 (94) | 171 (98) | 185 (97) | 0.52 |
| Body composition | |||||
| Body surface area (m2) | 1.87 ± 0.19 | 1.78 ± 0.19 | 1.87 ± 0.18 | 1.89 ± 0.18 | 0.01 |
| BMI (kg/m2) | 25.8 ± 4.1 | 25.6 ± 4.3 | 25.7 ± 4.3 | 25.9 ± 4.0 | 0.84 |
| Waist circumference (cm) | 96.7 ± 13.3 | 94.9 ± 15.2 | 96.8 ± 12.8 | 97.0 ± 13.4 | 0.68 |
| Blood pressure | |||||
| Systolic blood pressure (mmHg) | 155 ± 23 | 155 ± 22 | 154 ± 23 | 156 ± 23 | 0.81 |
| Diastolic blood pressure (mmHg) | 91 ± 10 | 92 ± 9 | 90 ± 9 | 91 ± 10 | 0.32 |
| Use of anti-hypertensives, n (%) | 355 (89) | 29 (83) | 158 (90) | 168 (88) | 0.44 |
| Number of anti-hypertensives | 1.9 ± 1.1 | 2.2 ± 1.6 | 1.9 ± 1.1 | 1.9 ± 1.1 | 0.20 |
| Use of ACE inhibitor or ARB, n (%) | 131 (33) | 14 (40) | 55 (31) | 62 (33) | 0.61 |
| Use of beta-blocker, n (%) | 240 (60) | 21 (60) | 114 (65) | 105 (55) | 0.16 |
| Use of calcium antagonist, n (%) | 162 (41) | 18 (51) | 66 (38) | 78 (41) | 0.31 |
| Lifestyle | |||||
| Current smoker, n (%) | 88 (22) | 8 (23) | 33 (19) | 47 (25) | 0.40 |
| Alcohol (non-user), n (%) | 192 (48) | 23 (66) | 81 (46) | 88 (46) | 0.09 |
| Physical activity (MET-min/day), median (IQR) | 279 (69–605) | 217 (14–501) | 235 (47–551) | 349 (140–670) | 0.02 |
| Socio-economic status | |||||
| Income, n (%) | 0.91 | ||||
| <1800 euros/month | 52 (13) | 5 (14) | 25 (14) | 3 (2) | |
| 1800–2799 euros/month | 108 (27) | 8 (23) | 46 (26) | 19 (10) | |
| 2800–3799 euros/month | 101 (25) | 8 (23) | 44 (25) | 54 (28) | |
| >3800 euros/month | 139 (35) | 14 (40) | 60 (34) | 49 (26) | |
| Educational level, n (%) | 0.07 | ||||
| Level 1 | 17 (4) | 4 (11) | 3 (2) | 10 (5) | |
| Level 2 | 45 (11) | 4 (11) | 16 (9) | 25 (13) | |
| Level 3 | 164 (41) | 14 (40) | 78 (45) | 72 (38) | |
| Level 4 | 147 (37) | 8 (23) | 66 (38) | 73 (38) | |
| Level 5 | 27 (7) | 5 (14) | 12 (7) | 10 (5) | |
| History of cardiovascular disease, n (%) | |||||
| Personal cardiovascular history | 50 (13) | 4 (11) | 23 (13) | 23 (12) | 0.94 |
| Familiar cardiovascular history | 178 (45) | 17 (49) | 76 (43) | 85 (45) | 0.85 |
| Renal allograft function | |||||
| eGFR (mL/min/1.73 m2) | 47 ± 17 | 48 ± 17 | 46 ± 17 | 47 ± 17 | 0.75 |
| Proteinuria (≥0.5 g/24 h), n (%) | 112 (28) | 9 (26) | 45 (26) | 58 (31) | 0.56 |
| Lipids | |||||
| Total cholesterol (mmol/L) | 5.6 ± 1.0 | 5.9 ± 1.4 | 5.5 ± 1.0 | 5.7 ± 1.0 | 0.04 |
| HDL cholesterol (mmol/L) | 1.09 ± 0.33 | 1.12 ± 0.32 | 1.06 ± 0.31 | 1.11 ± 0.34 | 0.22 |
| LDL cholesterol (mmol/L) | 3.6 ± 0.9 | 3.7 ± 1.2 | 3.5 ± 0.9 | 3.7 ± 0.9 | 0.13 |
| Triglycerides (mmol/L), median (IQR) | 1.9 (1.4–2.6) | 2.0 (1.5–3.7) | 1.9 (1.4–2.6) | 1.8 (1.3–2.6) | 0.42 |
| Use of statins, n (%) | 194 (49) | 13 (37) | 90 (51) | 91 (48) | 0.30 |
| Glucose homeostasis | |||||
| Insulin (µU/mL), median (IQR) | 11.2 (8.0–15.5) | 13.7 (8.6–22.8) | 11.5 (8.7–15.8) | 10.3 (7.7–14.2) | 0.03 |
| Glucose (mmol/L), median (IQR) | 4.5 (4.1–5.0) | 4.6 (4.0–5.4) | 4.6 (4.2–5.1) | 4.4 (4.0–4.9) | 0.06 |
| Glycated HbA1c (%), median (IQR) | 6.4 (5.8–7.0) | 6.5 (5.9–7.8) | 6.4 (5.8–7.0) | 6.3 (5.8–7.0) | 0.60 |
| Diabetes, n (%) | 73 (18) | 8 (23) | 36 (21) | 29 (15) | 0.32 |
| HOMA-IR, median (IQR) | 2.3 (1.6–3.5) | 2.6 (1.7–5.9) | 2.4 (1.7–3.6) | 2.0 (1.5–3.1) | 0.02 |
| Inflammation | |||||
| hs-CRP (mg/L), median (IQR) | 2.1 (0.9–5.1) | 1.7 (1.0–4.8) | 2.4 (0.9–6.0) | 2.1 (0.9–5.1) | 0.68 |
Values presented as mean ± SD unless stated otherwise. ACE, angiotensin-converting enzyme; ARB, angiotensin II receptor blocker; HbA1c, haemoglobin A1c; HOMA-IR, homeostatic model assessment insulin resistance. Differences were tested by analysis of variance or Kruskal–Wallis test for continuous variables and by chi-squared test for categorical variables.
Prospective analyses
At a median follow-up of 7.2 years (IQR 6.7–7.6), 93 (23%) RTRs died, of which 49 (53%) were due to cardiovascular causes. Cardiovascular and overall survival distributions among subgroups of RTR by categories of fruit consumption were not significantly different. Kaplan-Meier curves for cardiovascular and all-cause mortality by subgroups of RTRs according to categories of fruit consumption are shown in Figures 1 and 2, respectively. Cardiovascular and overall survival distributions among subgroups of RTRs by categories of vegetable consumption were significantly different (log-rank test P < 0.001 and P = 0.02, respectively). Kaplan-Meier curves for cardiovascular and all-cause mortality by subgroups of RTRs according to categories of vegetable consumption are shown in Figures 3 and 4, respectively. In multivariable-adjusted Cox proportional hazards regression analyses, overall fruit consumption was not associated with a risk of cardiovascular mortality {hazard ratio [HR] 0.82 [95% confidence interval (CI) 0.60–1.14]; P = 0.24; Table 3, Model 2}. Further adjustments did not materially change this finding. The proportionality assumptions in the model were satisfied (chi-squared test 3.27; P = 0.07). Vegetable consumption, however, was inversely associated with the risk of cardiovascular mortality [HR 0.49 (95% CI 0.34–0.71); P < 0.001; Table 4, Model 2]. Moreover, after additional adjustment for several measures of healthy lifestyle as potential confounders (e.g. physical activity, total cholesterol, blood pressure, BMI, diabetes and smoking status), vegetable consumption remained strongly and inversely associated with cardiovascular mortality [HR 0.50 (95% CI 0.35–0.72); P < 0.001; Table 4, Model 3]. The proportionality assumptions in the model were satisfied (chi-squared test 0.45; P = 0.50). Similar trends were found when considering consumption of fruits and vegetables as categorical variables (Tables 3 and 4, respectively).
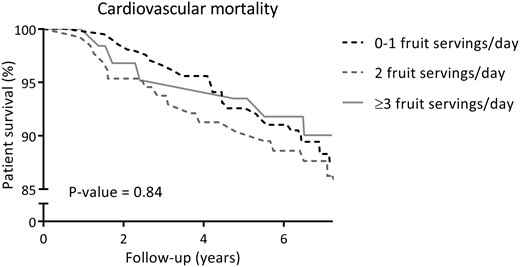
Kaplan–Meier curve for cardiovascular mortality according to categories of fruit consumption (0–1, 2, ≥3 servings/day) among RTRs.
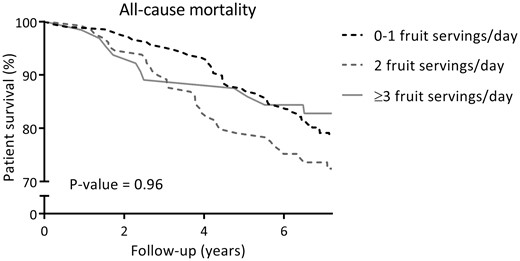
Kaplan–Meier curve for all-cause mortality according to categories of fruit consumption (0–1, 2, ≥3 servings/day) among RTRs.
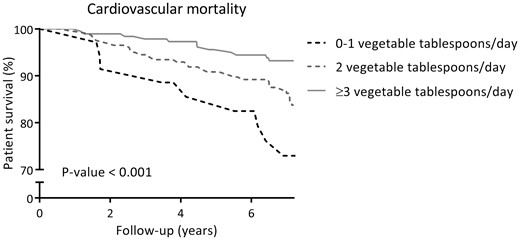
Kaplan–Meier curve for cardiovascular mortality according to categories of vegetable consumption (0–1, 2, ≥3 tablespoons/day) among RTRs.
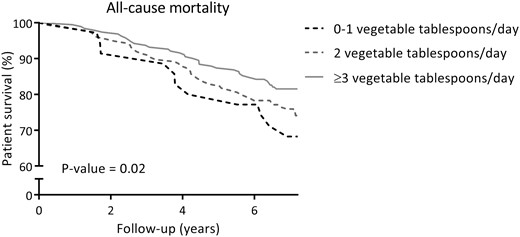
Kaplan–Meier curve for all-cause mortality according to categories of vegetable consumption (0–1, 2, ≥3 tablespoons/day) among RTRs.
Association of fruit consumption with risk of cardiovascular and all-cause mortality in 400 RTRs, adjusted for confoundersa
| Outcomes, mortality | Categories of fruit consumption, servings/day | Fruit consumption, servings/day (N = 400) | |||||||||
|---|---|---|---|---|---|---|---|---|---|---|---|
| 0–1 (n = 207) | 2 (n = 129) | ≥3 (n = 64) | |||||||||
| Events | Reference | Events | HR (95% CI) | ARR (%) | Events | HR (95% CI) | ARR (%) | Events | HR (95% CI) | P-value | |
| Cardiovascular | 25 | – | 17 | – | 1 | 7 | – | −1 | 49 | – | – |
| Model 1b | 1.00 | 0.74 (0.39–1.41) | 0.59 (0.24–1.47) | 0.82 (0.60–1.12) | 0.21 | ||||||
| Model 2c | 1.00 | 0.74 (0.38–1.44) | 0.62 (0.25–1.55) | 0.82 (0.60–1.14) | 0.24 | ||||||
| Model 3d | 1.00 | 0.84 (0.41–1.71) | 0.82 (0.31–2.12) | 0.90 (0.64–1.27) | 0.55 | ||||||
| Model 4e | 1.00 | 0.78 (0.38–1.57) | 0.82 (0.32–2.12) | 0.79 (0.57–1.10) | 0.16 | ||||||
| All-cause | 45 | – | 36 | – | 6 | 12 | – | −3 | 93 | – | – |
| Model 1b | 1.00 | 0.77 (0.39–1.49) | 0.52 (0.20–1.35) | 0.86 (0.69–1.08) | 0.19 | ||||||
| Model 2c | 1.00 | 0.89 (0.56–1.41) | 0.60 (0.31–1.17) | 0.87 (0.69–1.09) | 0.23 | ||||||
| Model 3d | 1.00 | 0.90 (0.56–1.43) | 0.63 (0.32–1.26) | 0.91 (0.71–1.16) | 0.45 | ||||||
| Model 4e | 1.00 | 0.89 (0.55–1.46) | 0.75 (0.37–1.50) | 0.83 (0.65–1.05) | 0.12 | ||||||
Cox proportional hazards regression analysis was performed to assess the association of fruit consumption with outcomes.
Adjusted for age, sex, income and education level.
Model 1 plus adjustment for eGFR, proteinuria, time since transplantation and primary renal disease.
Model 2 plus adjustment for physical activity, total cholesterol, systolic blood pressure, BMI, diabetes and smoking status.
Model 2, plus adjustment for cardiovascular history, alcohol use and hs-CRP.
Association of vegetable consumption with risk of cardiovascular and all-cause mortality in 400 RTRs, adjusted for confoundersa
| Outcomes, mortality | Categories of vegetable consumption, tablespoons/day | Vegetable consumption, tablespoons/day (N = 400) | |||||||||
|---|---|---|---|---|---|---|---|---|---|---|---|
| 0–1 (n = 35) | 2 (n = 175) | ≥3 (n = 190) | |||||||||
| Events | Reference | Events | HR (95% CI) | ARR (%) | Events | HR (95% CI) | ARR (%) | Events | HR (95% CI) | P-value | |
| Cardiovascular | 10 | – | 27 | – | −14 | 12 | – | −23 | 49 | – | – |
| Model 1b | 1.00 | 0.44 (0.20–0.94) | 0.19 (0.08–0.46) | 0.52 (0.36–0.74) | <0.001 | ||||||
| Model 2c | 1.00 | 0.42 (0.19–0.93) | 0.18 (0.07–0.43) | 0.49 (0.34–0.71) | <0.001 | ||||||
| Model 3d | 1.00 | 0.44 (0.20–0.98) | 0.18 (0.07–0.44) | 0.50 (0.35–0.72) | <0.001 | ||||||
| Model 4e | 1.00 | 0.40 (0.18–0.89) | 0.17 (0.07–0.41) | 0.48 (0.33–0.70) | <0.001 | ||||||
| All-cause | 12 | – | 46 | – | −8 | 35 | – | −16 | 93 | – | – |
| Model 1b | 1.00 | 0.61 (0.31–1.20) | 0.44 (0.22–0.89) | 0.75 (0.58–0.99) | 0.04 | ||||||
| Model 2c | 1.00 | 0.60 (0.31–1.19) | 0.41 (0.21–0.82) | 0.73 (0.56–0.95) | 0.02 | ||||||
| Model 3d | 1.00 | 0.60 (0.31–1.19) | 0.41 (0.21–0.83) | 0.73 (0.56–0.95) | 0.02 | ||||||
| Model 4e | 1.00 | 0.60 (0.30–1.19) | 0.41 (0.20–0.81) | 0.72 (0.55–0.95) | 0.02 | ||||||
Cox proportional hazards regression analysis was performed to assess the association of fruit consumption with outcomes.
Adjusted for age, sex, income and education level.
Model 1 plus adjustment for eGFR, proteinuria, time since transplantation and primary renal disease.
Model 2 plus adjustment for physical activity, total cholesterol, systolic blood pressure, BMI, diabetes and smoking status.
Model 2, plus adjustment for cardiovascular history, alcohol use and hs-CRP.
In interaction analyses, the association of fruit consumption with cardiovascular mortality was significantly modified by eGFR and proteinuria (Pinteraction = 0.01 and 0.01, respectively). Thus, in further stratified prospective analysis by subgroups of RTRs according to renal function (eGFR ≤ or >45 mL/min/1.73 m2) and proteinuria status (< or ≥0.5 g/24 h), fruit consumption was associated with a lower risk of cardiovascular mortality in RTRs with eGFR >45 mL/min/1.73 m2 [HR 0.56 (95% CI 0.35–0.92); P = 0.02] or without proteinuria <0.5 g/24 h [HR 0.62 (95% CI 0.41–0.92); P = 0.02], as depicted in Figure 5. We found no signs of effect modification on the association of fruit consumption with cardiovascular mortality by age, sex, BMI, smoking status, alcohol use and physical activity (Supplementary data, Table S4). We also found no signs of effect modification on the association of vegetable consumption with cardiovascular mortality (Supplementary data, Table S4).
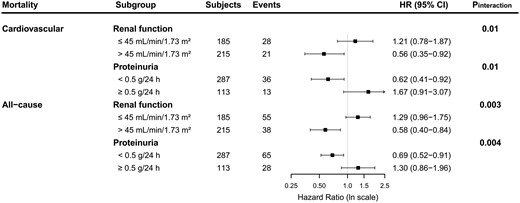
Stratified analysis of the association of fruit consumption with cardiovascular and all-cause mortality in 400 RTRs. HRs adjusted for age, sex, income, education level, eGFR, proteinuria, time since transplantation and primary renal disease are shown.
Similar results were found in secondary analyses with all-cause mortality as the endpoint. In multivariable-adjusted Cox proportional hazards regression analyses, overall fruit consumption was not associated with all-cause mortality [HR 0.87 (95% CI 0.69–1.09); P = 0.23; Table 3, Model 2]. Further adjustment for other potential confounders did not materially change this finding. The proportionality assumptions in the model were satisfied (chi-squared test 1.22; P = 0.27). Vegetable consumption, however, was inversely associated with the risk of all-cause mortality [HR 0.73 (95% CI 0.56–0.95); P = 0.02; Table 4, Model 2]. Moreover, this association remained materially unaltered after additional adjustment for several measures of healthy lifestyle as potential confounders, with, for example, an HR of 0.73 (95% CI 0.56–0.95; P = 0.02) after adjustment for physical activity, total cholesterol, blood pressure, BMI, diabetes and smoking status (Table 4, Model 3). The proportionality assumptions in the model were satisfied (chi-squared test 1.61; P = 0.20). Similar trends were found when considering consumption of fruits and vegetables as categorical variables (Tables 3 and 4, respectively).
In interaction analyses, the association of fruit consumption with all-cause mortality was significantly modified by eGFR and proteinuria (Pinteraction = 0.003 and 0.004, respectively). Thus, in further stratified prospective analysis by subgroups of RTRs according to renal function (eGFR ≤ or >45 mL/min/1.73 m2) and proteinuria status (< or ≥0.5 g/24 h), fruit consumption was associated with a lower risk of all-cause mortality in RTRs with eGFR >45 mL/min/1.73 m2 [HR 0.58 (95% CI 0.40–0.84); P = 0.004] or without proteinuria [HR 0.69 (95% CI 0.52–0.91); P = 0.01], as depicted in Figure 5. We found no signs of effect modification on the associations of fruit consumption with all-cause mortality by age, sex, BMI, smoking status, alcohol use and physical activity (Supplementary data, Table S4). We also found no signs of significant effect modification on the association of vegetable consumption with all-cause mortality (Supplementary data, Table S4).
DISCUSSION
In this study we show that in RTRs, vegetable consumption is inversely associated with the risk of cardiovascular and all-cause mortality. We also show that fruit consumption is inversely associated with the risk of cardiovascular and all-cause mortality in RTRs with chronic kidney disease (CKD) Stages 1, 2 and 3A or without proteinuria, but not within the subgroup of RTRs with CKD Stages 3B, 4 or 5 or with proteinuria.
Several population-based studies have shown the substantial role of adequate consumption of fruits and vegetables on prognosis outcomes [9–22]. A recent meta-analysis that included 16 prospective cohort studies provided further evidence that higher consumption of fruits and vegetables is associated with a lower risk of all-cause and, particularly, cardiovascular mortality [40]. Nevertheless, very few studies have paid attention to underlying personal characteristics, which has recently been called to be considered to accurately estimate the associations between dietary factors and risk of mortality [41]. The current study is the first one aimed at assessing the associations of consumption of fruits and vegetables with outcomes in the specific clinical setting of RTRs. Our findings are in agreement with the hypothesis that a relatively higher vegetable consumption is associated with a reduced risk of cardiovascular and all-cause mortality and provide further RTRs-specific evidence; favourable outcomes offered by relatively higher fruit consumption may vary among different subgroups of RTRs, according to eGFR and proteinuria status. It has been suggested that these factors need to be taken into account to determine the potential beneficial effect of higher fruit consumption on cardiovascular and all-cause mortality in RTRs.
There are likely to be multiple mechanisms by which higher consumption of fruits and vegetables may exert a protective effect, particularly, on cardiovascular mortality. The antioxidant hypothesis suggests that antioxidant compounds and polyphenols such as vitamin C, carotenoids and flavonoids may have a modest effect on the cardiovascular risk by preventing the oxidation of cholesterol and other lipids in the arteries [42]. Congruently, we previously showed that plasma vitamin C depletion in RTRs is associated with an increased risk of all-cause mortality [43]. Nevertheless, various underlying mechanisms are feasible to be involved in the protective effect offered by higher consumption of whole fruits and vegetables [44, 45]. It is important to take into account that the tendency to formulate hypotheses based on single nutrients may underestimate the possibilities with exposures as chemically complex as foods [46]. Remarkably, this approach, besides being consistent with advances in the science of nutrition that propose a higher relevance of foods over nutrient-based metrics [47, 48], is in keeping with the advice of current dietary guidelines of the American Heart Association [7] and the Dietary Guidelines for Americans [8], which emphasize the consumption of whole fruits and vegetables.
The strengths of the current study lie in its large sample size of stable RTRs, who were closely monitored during a considerable follow-up period by regular check-ups in the outpatient clinic, thus providing complete endpoints for evaluation without patients lost to follow-up. Moreover, data were extensively collected, which allowed adjustment for several potential confounders, among which were traditional cardiovascular risk factors, income, education level and lifestyle habits. However, as with any observational study, unmeasured confounding may occur despite the substantial number of potentially confounding factors we adjusted for. We acknowledge further limitations of the current study as follows. First, its observational design does not allow conclusions of causality. Second, this study relied on a semi-quantitative food-frequency questionnaire specific to intake of fruits and vegetables and did not include an exhaustive diet food items list, which precluded us from performing adjustment for caloric intake. Next, we excluded from the analysis the first 206 participants, for whom the food questionnaire was not available. An exhaustive comparison analysis of baseline characteristics between the study population with and without data on intake showed no baseline characteristics were significantly different, except blood pressure, which might have introduced bias that could not be controlled for. Next, in this study, we did not separately account for consumption of fresh fruits and vegetables. Unlike many previous studies, Du et al. [13] recently focused on examining the association of fresh fruit consumption with cardiovascular risk, which was much stronger than previous reports. Future investigations might be warranted to focus on consumption of fresh fruits and vegetables, as well as to account for different types of fruits and vegetables [49], to improve the assessment of their beneficial effects [50]. Finally, the fact that we did not use a full food-frequency questionnaire, but rather a questionnaire for specific items, made it impossible to investigate associations of healthy patterns of eating with outcomes. Nevertheless, our results show, for the first time, an association of consumption of fruits and vegetables with cardiovascular and all-cause mortality in the specific clinical setting of RTRs, which points to the need for future studies in which such analyses are performed.
In conclusion, in RTRs, vegetable consumption is inversely, independently and strongly associated with the risk of both cardiovascular and all-cause mortality. Furthermore, relatively higher fruit consumption is also associated with lower cardiovascular and all-cause mortality, particularly in RTRs with higher eGFR (> 45 mL/min/1.73 m2) or the absence of proteinuria. We provide relevant specific RTRs data that support and complement existing population-based studies, further adding to the evidence that higher consumption of fruits and vegetables is protective of cardiovascular prognosis in RTRs. Interventional studies are warranted to further investigate whether increasing consumption of fruits and vegetables may open opportunities for potential interventional pathways to decrease the burden of cardiovascular mortality in RTRs.
FUNDING
This study is based on data from the TransplantLines Insulin Resistance and Inflammation Biobank and Cohort Study (TxL-IRI; ClinicalTrials.gov identifier: NCT03272854), which was funded by the Dutch Kidney Foundation (grant C00.1877). Funders of this study had no role in the study design, collection of the data, analysing the data, interpretation of results, writing the manuscript or the decision to submit the manuscript.
CONFLICT OF INTEREST STATEMENT
None declared.
REFERENCES
U.S. Department of Health and Human Services and U.S. Department of Agriculture. 2015–2020 Dietary Guidelines for Americans. 8th edn. http://health.gov/dietaryguidelines/2015/guidelines/ (July 2018, date last accessed)
Expert Committee on the Diagnosis and Classification of Diabetes Mellitus.
World Cancer Research Fund/American Institute for Cancer Research.


Comments